Review
. 2013 Jul;38(2):2199-209.
doi: 10.1111/ejn.12238. Epub 2013 May 8.

Sleep: a synchrony of cell activity-driven small network states

Affiliations
Review

Sleep: a synchrony of cell activity-driven small network states

James M Krueger et al. Eur J Neurosci. 2013 Jul.

Abstract

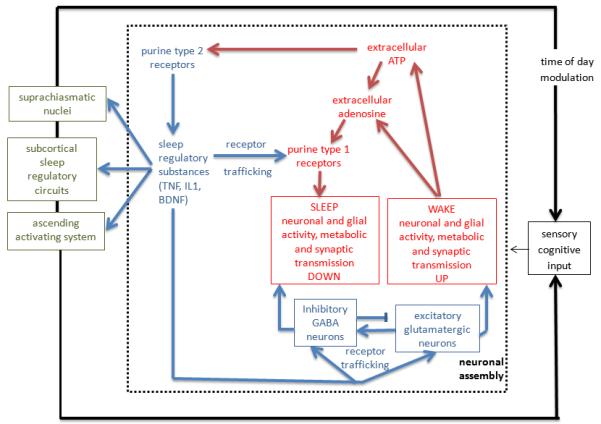
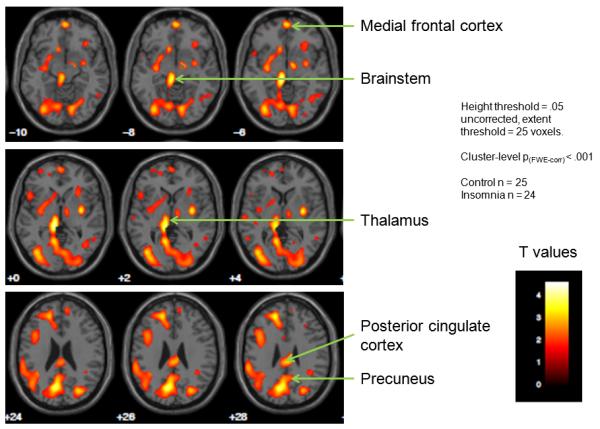
We posit a bottom-up sleep-regulatory paradigm in which state changes are initiated within small networks as a consequence of local cell activity. Bottom-up regulatory mechanisms are prevalent throughout nature, occurring in vastly different systems and levels of organization. Synchronization of state without top-down regulation is a fundamental property of large collections of small semi-autonomous entities. We posit that such synchronization mechanisms are sufficient and necessary for whole-organism sleep onset. Within the brain we posit that small networks of highly interconnected neurons and glia, for example cortical columns, are semi-autonomous units oscillating between sleep-like and wake-like states. We review evidence showing that cells, small networks and regional areas of the brain share sleep-like properties with whole-animal sleep. A testable hypothesis focused on how sleep is initiated within local networks is presented. We posit that the release of cell activity-dependent molecules, such as ATP and nitric oxide, into the extracellular space initiates state changes within the local networks where they are produced. We review mechanisms of ATP induction of sleep-regulatory substances and their actions on receptor trafficking. Finally, we provide an example of how such local metabolic and state changes provide mechanistic explanations for clinical conditions, such as insomnia.

Keywords: ATP; brain imaging; cerebral blood flow; cytokine; receptor.


Figures

Figure 1
Figure 1
Response of a rat trained to lick a sucrose solution after stimulation of a specific facial whisker. Animals were trained to lick for a sweetened water reward when a particular whisker was stimulated (Stim Reward), but not to lick when a different whisker was stimulated (Sham No Reward). Training occurred over a 3 to 6 month period. Before training, a 64 channel electrode array was also implanted over the surface of the somatosensory cortex, and individual whisker cortical columns (barrels) were mapped and associated with the particular whiskers being stimulated. Once animals achieved greater than 80% correct responses, the electrical evoked responses from each electrode corresponding to the Stim and Sham whisker were sorted into those trials that were correct (Stim Reward with Licks or Sham No Reward no Licks) and those that were incorrect (Stim Reward with no Licks or Sham No Reward with Licks), and averaged across trials. Evoked responses were over 200 uV larger before incorrect responses, suggesting that the cortical column for each whisker was in its sleep-like state during the trial that resulted in an incorrect response.
Figure 2
Figure 2
A proposed mechanism for the indexing of prior brain activity and its translation into a sleep regulatory mechanism. The steps within the broken line box are envisioned to occur within small networks such as cortical columns (see text). Those steps result in a state shift within the local network and in the production of molecules that interact with known sleep regulatory circuits (far left small boxes) that in turn coordinate state of larger areas of brain for niche-adaptation purposes. For instance, local application of IL1 to the cortex induces local cortical delta waves (Yasuda et al., 2005) and fos expression in the ventrolateral preoptic hypothalamic area (Yasuda et al., 2007), a well know sleep regulatory circuit. Neuronal activity is greater during waking than sleep (Vyazovskiy et al., 2009). Cell activity is associated with release of ATP into the extracellular (ex) space. ATPex either rapidly is catabolized to adenosine via ectonucleotidases or it binds to purine type 2 receptors. Ex-Adenosine binds to purine type 1 receptors and thereby rapidly and transiently hyperpolarizes neurons. In contrast, activation of the purine type 2 receptor P2X7 releases cytokines and neurotrophins from glia or neurons (see text); these molecules affect receptor trafficking including purine type 1, GABA, and glutamate receptors (Imeri and Opp, 2009; Reyes-Vazquez et al., 2012; Krueger et al., 2008). Cytokines also interact with known sleep regulatory circuits (far left) and thereby affect sleep (Nistico et al., 1992; Santello et al., 2011). For instance, IL1 inhibits serotonergic neurons and enhances GABAergic signaling in the dorsal raphe nucleus (Brambilla et al., 2007, 2010; Manfridi et al., 2003). IL1 also modulates locus coeruleus (DeSarro et al 1997), preoptic, basal forebrain and cholinergic laterodorsal tegmental neurons to affect sleep (Alam et al., 2004) and the suprachiasmatic nucleus to affect clock genes (Cavadini et al., 2007). indicates stimulation; indicates inhibition.
Figure 3
Figure 3
Subtraction images of [18F]-fluorodeoxyglucose positron emission tomography (FDG PET) scans conducted in participants with chronic insomnia and good sleepers. Participants in each group had FDG PET scans during morning wakefulness and the first non-rapid eye movement sleep (NREMS) period. Statistical Parametric Mapping version 8 was used to examine the interaction of sleep-wake state with participant group. The images above indicate areas in which the wake-NREMS differences were smaller for participants with chronic insomnia versus controls. Relatively smaller wake-sleep changes were observed for insomnia participants in regions related to introspective, self-focused mental activity (precuneus, posterior parietal cortex), emotion regulation (medial frontal cortex) and sleep-wake regulation (thalamus, brainstem). The color scale corresponds to t values for individual voxels in the SPM comparison. Height extent = threshold value for considering voxels significantly different. Extent threshold = number of contiguous voxels required to consider a cluster of voxels significantly different.

References

    1. Aalto J, Kiianmaa K. REM-sleep deprivation-induced increase in ethanol intake: role of brain monoaminergic neurons. Alcohol. 1986;3:377–381. - PubMed
    1. Alam MN, McGinty D, Bashir T, Kumar S, Imeri L, Opp MR, Szymusiak R. Interleukin-1 beta modulates state-dependent discharge activity of preoptic area and basal forebrain neurons: Role in sleep regulation. Eur. J. Neurosci. 2004;20:207–216. - PubMed
    1. Aton SJ, Seibt J, Dumoulin M, Jha SK, Steinmetz N, Coleman T, Naidoo N, Frank MG. Mechanisms of sleep-dependent consolidation of cortical plasticity. Neuron. 2009;61:454–466. - PMC - PubMed
    1. Balkin TJ, Braun AR, Wesensten NJ, Jeffries K, Varga M, Baldwin P, et al. The process of awakening: a PET study of regional brain activity patterns mediating the re-establishment of alertness and consciousness. Brain. 2002;125:2308–2319. - PubMed
    1. Bassetti C, Vella S, Donati F, Wielepp P, Weder B. SPECT during sleepwalking. Lancet. 2000;356:484–485. - PubMed

Publication types

LinkOut - more resources