. 2013 Aug;33(7):1100-12.
doi: 10.1111/liv.12188. Epub 2013 May 8.

Upregulation of T-cell factor-4 isoform-responsive target genes in hepatocellular carcinoma

Affiliations

Upregulation of T-cell factor-4 isoform-responsive target genes in hepatocellular carcinoma

Yoshito Tomimaru et al. Liver Int. 2013 Aug.

Abstract

Background: The Wnt/β-catenin signalling pathway regulates genes involved in cell proliferation, survival, migration and invasion through regulation by T-cell factor (TCF)-4 transcription factor proteins. However, the role of TCF-4 isoforms generated by alternative splicing events in hepatocellular carcinoma (HCC) is unknown.

Aim: Here, we investigated TCF-4 isoforms (TCF-4J and K)-responsive target genes that are important in hepatic oncogenesis and tumour development.

Methods: Gene expression microarray was performed on HCC cells overexpressing TCF-4J and K isoforms. Expression level of selected target genes was evaluated and correlations were made between their expression level and that of TCF-4 isoform in 47 pairs of human HCC tumours.

Results: Comparison by gene expression microarray revealed that 447 genes were upregulated and 343 downregulated more than 2.0-fold in TCF-4J compared with TCF-4K expressing cells. We validated expression of 18 selected target genes involved in Wnt/β-catenin, insulin/IGF-1/IRS1 and Notch signalling pathways in 47 pairs of human HCCs and adjacent uninvolved liver tissues. It was observed that 13 genes (CLDN2, STK17B, SPP1, AXIN2, WISP2, MMP7, IRS1, ANXA1, CAMK2N1, ASPH, GPR56, CD24 and JAG1) activated by TCF-4J isoform in HCC cells, were also upregulated in HCC tumours compared with adjacent peritumour tissue; more importantly, 10 genes exhibited a significant correlation with the TCF-4J expression level in tumour.

Conclusion: TCF-4 isoforms (TCF-4J and K) activated different downstream target genes in HCC. The biological consequence of TCF-4J isoform expression was upregulation of genes associated with tripartite Wnt/β-catenin, insulin/IGF-1/IRS1 and Notch signal transduction pathway activation, which contribute to the pathogenesis of HCC.

Keywords: HCC; TCF-4; Wnt; target genes.


Conflict of interest statement

CONFLICTS OF INTERESTS

None

Figures

Fig. 1
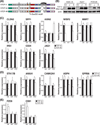
Fig. 1. The expression levels of 15 upregualted genes in HCC cells transiently transfected with TCF-4J and TCF-4K isoforms
(A) A schematic representation of human TCF7L2 gene comprising 17 exons based on the reported cDNA sequences and structural organization of human TCF-4J and TCF-4K isoforms. The alternatively spliced sites, shown with a tee-pee shape, are exon 4, 7L (LVPQ), 9L (SxxSS), 13, 14, 15, 16, and 17L. (B) Protein expression of TCF-4J (J), TCF-4K (K), and empty vector (EV) as a control in the transfected HCC cell lines. Exogenous expression of TCF-4J and TCF-4K was confirmed by Western blot analysis using antibody against Myc-tag; actin was used as a loading control. (C-E) Expression levels of the 15 genes in the transiently transfected HCC cell lines, HAK-1A (1A), Huh7 (H7), and FOCUS (FO). Expression levels were significantly increased in TCF-4J expressing cells compared to TCF-4K expressing cells of 8 genes related to Wnt/β-catenin, IN/IGF-1/IRS1, and Notch signaling pathways (C), and in 5 other selected genes (D). (E) Among the 3 genes whose expression level was higher in TCF-4K expressing cells, expression of FZD9 and CD81 were significantly increased in TCF-4K expressing cells compared to TCF-4J expressing cells. Gene expression levels were determined by qRT-PCR and the values normalized to 18S rRNA. Relative expression depicts as the fold changes compared to TCF-4J. The dotted line represents the level in TCF-4J. The data are shown as mean ± SD of triplicate assay, and the results were confirmed by three independent experiments. *, P < 0.05.
Fig. 2
Fig. 2. The protein expression levels of the selected genes in cells transiently transfected with TCF-4J and TCF-4K isoforms
(A) Protein expression of TCF-4 isoforms [TCF-4J (J) and TCF-4K (K)] and 7 genes (CLDN2, SPP1, AXIN2, WISP2, IRS1, ASPH, and JAG1) in HAK-1A, Huh7, and FOCUS HCC cell lines was determined by Western blot analysis using antibodies against Myc-tag, TCF-4, Claudin 2 (CLDN2), Osteopontin (SPP1), Axin-2 (AXIN2), WISP2, IRS1, ASPH, and Jagged1 (JAG1); actin was used as a loading control. Densitometric analyses of the protein expression were shown in Fig. S2. (B) Protein expression levels of the genes (CLDN2, SPP1, AXIN2, WISP2, IRS1, ASPH, and JAG1) in the cell lines were evaluated by ELISA using antibodies against Claudin 2 (CLDN2), Osteopontin (SPP1), Axin-2 (AXIN2), WISP2, IRS1, ASPH, and JAG1; RPLPO was used as a control. Relative expression depicts as the fold changes compared to TCF-4J. The dotted line represents the level in TCF-4J and results are shown as mean ± SD of quadruplicate assay. *, P < 0.05.
Fig. 3
Fig. 3. The expression levels of the 15 selected genes in 47-paired human HCC tissues and 3 normal livers
(A) All 13 genes upregulated in TCF-4J, transiently transfected HCC cells were also significantly increased in HCC tumors (T) compared to adjacent peritumor tissue (pT) and normal liver tissue (N). The expression level in peritumor tissue was not significantly different from normal liver tissues. (B) The expression level of 2 genes with higher expression in TCF-4K expressing cells was significantly decreased in HCC tissue compared to peritumor tissue and thus the in vitro observation were in contrast to the more important finding in human tumor and non-tumor tissue. The expression level in peritumor tissue was not significantly different from normal liver tissues. These expression levels were evaluated by qRT-PCR and the values were normalized to 18S rRNA. The results are shown as mean ± SD of triplicate assay. *, P < 0.05.
Fig. 4
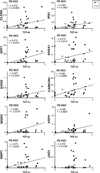
Fig. 4. Correlation between expression levels of TCF-4J and the 10 selected genes in PD HCC tumors
Correlation between expression levels of TCF-4J and each gene was evaluated in PD HCC tumors. The regression line is shown when the correlation was significant (P < 0.05). In PD HCC, expression of all 10 genes exhibited a significant correlation with the TCF-4J expression. Pearson’s correlation coefficient was interpreted as follows: r = 0; no, 0 < r ≤ 0.3; weak, 0.3 < r ≤ 0.7; moderate, and 0.7 < r ≤ 1.0; strong correlation. The expression level of TCF-4J was evaluated by semi-quantitative RT-PCR and the values were normalized to GAPDH. qRT-PCR was used to evaluate expression levels of the selected genes and the values were normalized to 18S rRNA.
Fig. 5
Fig. 5. Correlation of protein expression level of the target genes with its mRNA level and TCF-4J expression in HCC tumors
(A) Correlation between mRNA and protein expression levels of the genes (CLDN2, SPP1, AXIN2, WISP2, and ASPH) in 17-paired HCC samples. There were significant correlations between mRNA and protein expression levels of all 5 genes. (B) Correlation between TCF-4J expression and protein level of each gene in the samples. TCF-4J expression level was significantly correlated with the protein level of the genes. Spearman’s correlation coefficient was interpreted as follows: ρ = 0; no, 0 < ρ ≤ 0.3; weak, 0.3 < ρ ≤ 0.7; moderate, and 0.7 < ρ ≤ 1.0; strong correlation. The expression level of TCF-4J was evaluated by semi-quantitative RT-PCR and the values were normalized to GAPDH. The protein expression levels of the target genes were categorized into 3 groups (0, +1, +2) based on intensity of immunohistochemical staining. (C) Representative photographs of immunohistochemical staining for the genes (CLDN2, SPP1, AXIN2, WISP2, and ASPH) (100×). Antibodies against Claudin 2 (CLDN2), Osteopontin (SPP1), Axin-2 (AXIN2), WISP2, and ASPH were used for the staining. Note that higher TCF-4J expression and stronger staining of each protein were found in tumor area (T) compared to peritumor area (pT). Bar = 500µm.

Similar articles

Cited by

References

    1. Clevers H. Wnt/beta-catenin signaling in development and disease. Cell. 2006;127:469–480. - PubMed
    1. Ying Y, Tao Q. Epigenetic disruption of the WNT/beta-catenin signaling pathway in human cancers. Epigenetics. 2009;4:307–312. - PubMed
    1. El-Serag HB, Rudolph KL. Hepatocellular carcinoma: epidemiology and molecular carcinogenesis. Gastroenterology. 2007;132:2557–2576. - PubMed
    1. Bengochea A, de Souza MM, Lefrancois L, et al. Common dysregulation of Wnt/Frizzled receptor elements in human hepatocellular carcinoma. Br J Cancer. 2008;99:143–150. - PMC - PubMed
    1. Kim M, Lee HC, Tsedensodnom O, et al. Functional interaction between Wnt3 and Frizzled-7 leads to activation of the Wnt/beta-catenin signaling pathway in hepatocellular carcinoma cells. J Hepatol. 2008;48:780–791. - PMC - PubMed

Publication types

MeSH terms

Substances