

Comparative transcriptome analysis to investigate the high starch accumulation of duckweed (Landoltia punctata) under nutrient starvation
- PMID: 23651472
- PMCID: PMC3654882
- DOI: 10.1186/1754-6834-6-72
Comparative transcriptome analysis to investigate the high starch accumulation of duckweed (Landoltia punctata) under nutrient starvation
Abstract
Background: Duckweed can thrive on anthropogenic wastewater and produce tremendous biomass production. Due to its relatively high starch and low lignin percentage, duckweed is a good candidate for bioethanol fermentation. Previous studies have observed that water devoid of nutrients is good for starch accumulation, but its molecular mechanism remains unrevealed.
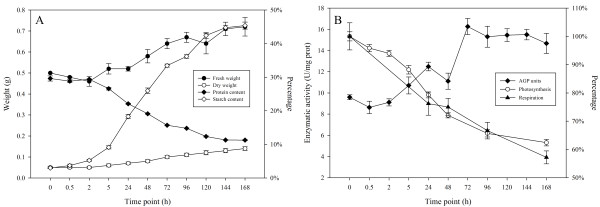
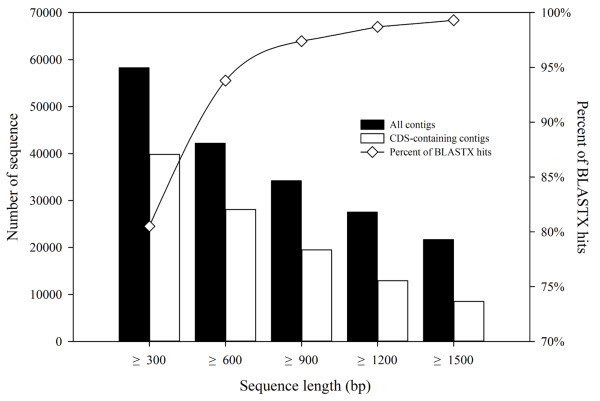
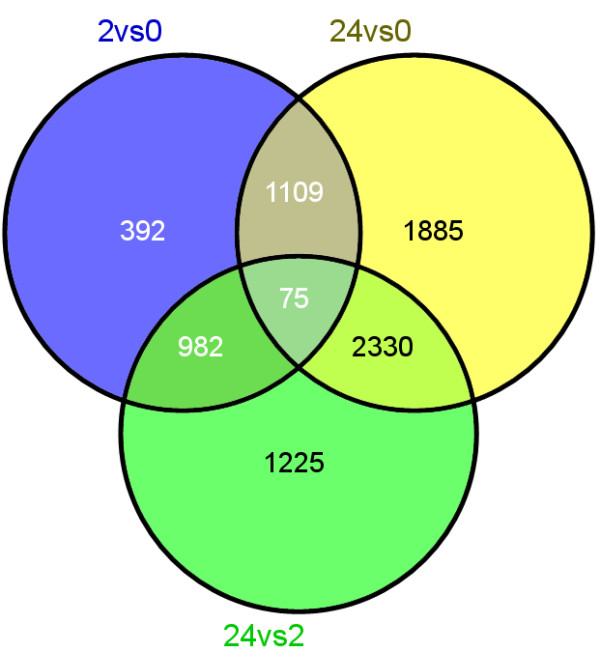
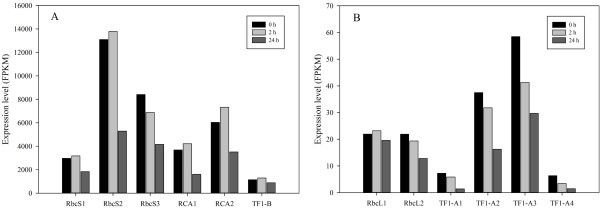
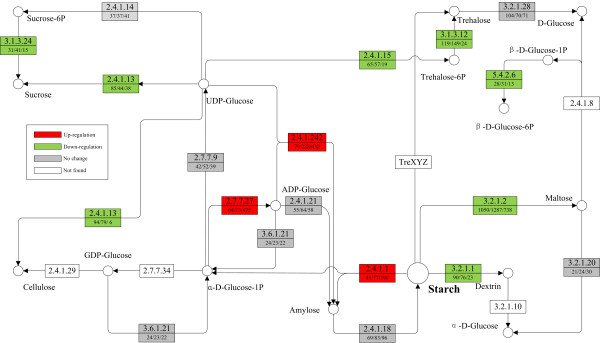
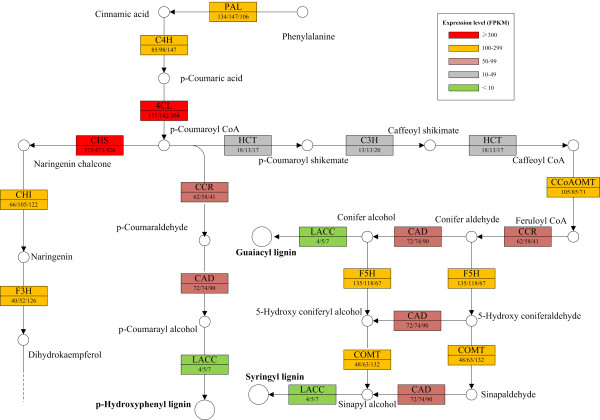
Results: This study globally analyzed the response to nutrient starvation in order to investigate the starch accumulation in duckweed (Landoltia punctata). L. punctata was transferred from nutrient-rich solution to distilled water and sampled at different time points. Physiological measurements demonstrated that the activity of ADP-glucose pyrophosphorylase, the key enzyme of starch synthesis, as well as the starch percentage in duckweed, increased continuously under nutrient starvation. Samples collected at 0 h, 2 h and 24 h time points respectively were used for comparative gene expression analysis using RNA-Seq. A comprehensive transcriptome, comprising of 74,797 contigs, was constructed by a de novo assembly of the RNA-Seq reads. Gene expression profiling results showed that the expression of some transcripts encoding key enzymes involved in starch biosynthesis was up-regulated, while the expression of transcripts encoding enzymes involved in starch consumption were down-regulated, the expression of some photosynthesis-related transcripts were down-regulated during the first 24 h, and the expression of some transporter transcripts were up-regulated within the first 2 h. Very interestingly, most transcripts encoding key enzymes involved in flavonoid biosynthesis were highly expressed regardless of starvation, while transcripts encoding laccase, the last rate-limiting enzyme of lignifications, exhibited very low expression abundance in all three samples.
Conclusion: Our study provides a comprehensive expression profiling of L. punctata under nutrient starvation, which indicates that nutrient starvation down-regulated the global metabolic status, redirects metabolic flux of fixed CO2 into starch synthesis branch resulting in starch accumulation in L. punctata.
Figures
Similar articles
-
High flavonoid accompanied with high starch accumulation triggered by nutrient starvation in bioenergy crop duckweed (Landoltia punctata).BMC Genomics. 2017 Feb 15;18(1):166. doi: 10.1186/s12864-017-3559-z. BMC Genomics. 2017. PMID: 28201992 Free PMC article.
-
Nutrient starvation and light deprivation effects on starch accumulation in Landoltia punctata cultivated on anaerobically digested dairy manure.J Environ Qual. 2020 Jul;49(4):1044-1053. doi: 10.1002/jeq2.20092. Epub 2020 Jun 3. J Environ Qual. 2020. PMID: 33016485
-
Integrated analysis of transcriptome and metabolites reveals an essential role of metabolic flux in starch accumulation under nitrogen starvation in duckweed.Biotechnol Biofuels. 2017 Jun 26;10:167. doi: 10.1186/s13068-017-0851-8. eCollection 2017. Biotechnol Biofuels. 2017. PMID: 28670341 Free PMC article.
-
Growing duckweed for biofuel production: a review.Plant Biol (Stuttg). 2015 Jan;17 Suppl 1:16-23. doi: 10.1111/plb.12216. Epub 2014 Jul 1. Plant Biol (Stuttg). 2015. PMID: 24985498 Review.
-
Accumulation of starch in duckweeds (Lemnaceae), potential energy plants.Physiol Mol Biol Plants. 2021 Nov;27(11):2621-2633. doi: 10.1007/s12298-021-01100-4. Epub 2021 Nov 19. Physiol Mol Biol Plants. 2021. PMID: 34924714 Free PMC article. Review.
Cited by
-
Over-Expression of Phosphoserine Aminotransferase-Encoding Gene (AtPSAT1) Prompts Starch Accumulation in L. turionifera under Nitrogen Starvation.Int J Mol Sci. 2022 Sep 30;23(19):11563. doi: 10.3390/ijms231911563. Int J Mol Sci. 2022. PMID: 36232863 Free PMC article.
-
Duckweed Is a Promising Feedstock of Biofuels: Advantages and Approaches.Int J Mol Sci. 2022 Dec 3;23(23):15231. doi: 10.3390/ijms232315231. Int J Mol Sci. 2022. PMID: 36499555 Free PMC article.
-
Extensive post-transcriptional regulation revealed by integrative transcriptome and proteome analyses in salicylic acid-induced flowering in duckweed (Lemna gibba).Front Plant Sci. 2024 Feb 7;15:1331949. doi: 10.3389/fpls.2024.1331949. eCollection 2024. Front Plant Sci. 2024. PMID: 38390296 Free PMC article.
-
Uniconazole-induced starch accumulation in the bioenergy crop duckweed (Landoltia punctata) II: transcriptome alterations of pathways involved in carbohydrate metabolism and endogenous hormone crosstalk.Biotechnol Biofuels. 2015 Apr 11;8:64. doi: 10.1186/s13068-015-0245-8. eCollection 2015. Biotechnol Biofuels. 2015. PMID: 25873998 Free PMC article.
-
De novo transcriptome assembly of Ipomoea nil using Illumina sequencing for gene discovery and SSR marker identification.Mol Genet Genomics. 2015 Oct;290(5):1873-84. doi: 10.1007/s00438-015-1034-6. Epub 2015 Apr 16. Mol Genet Genomics. 2015. PMID: 25877516
References
-
- Zhang LA, Chen QA, Jin YL, Xue HL, Guan JF, Wang ZY, Zhao H. Energy-saving direct ethanol production from viscosity reduction mash of sweet potato at very high gravity (VHG) Fuel Process Technol. 2010;91:1845–1850. doi: 10.1016/j.fuproc.2010.08.009. - DOI
-
- Ge LL, Wang P, Mou HJ. Study on saccharification techniques of seaweed wastes for the transformation of ethanol. Renew Energ. 2011;36:84–89. doi: 10.1016/j.renene.2010.06.001. - DOI
-
- Crutzen P, Mosier A, Smith K, Winiwarter W. N2O release from agro-biofuel production negates global warming reduction by replacing fossil fuels. Atmos Chem Phys. 2007;7:11191–11205. doi: 10.5194/acpd-7-11191-2007. - DOI
LinkOut - more resources
Full Text Sources
Other Literature Sources
Molecular Biology Databases
