

New evidence for coupled clock regulation of the normal automaticity of sinoatrial nodal pacemaker cells: bradycardic effects of ivabradine are linked to suppression of intracellular Ca²⁺ cycling
- PMID: 23651631
- PMCID: PMC3735682
- DOI: 10.1016/j.yjmcc.2013.04.026
New evidence for coupled clock regulation of the normal automaticity of sinoatrial nodal pacemaker cells: bradycardic effects of ivabradine are linked to suppression of intracellular Ca²⁺ cycling
Abstract
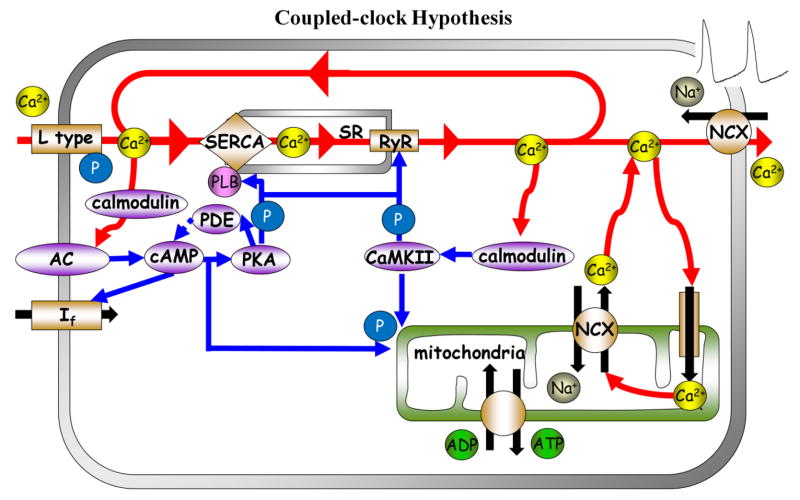
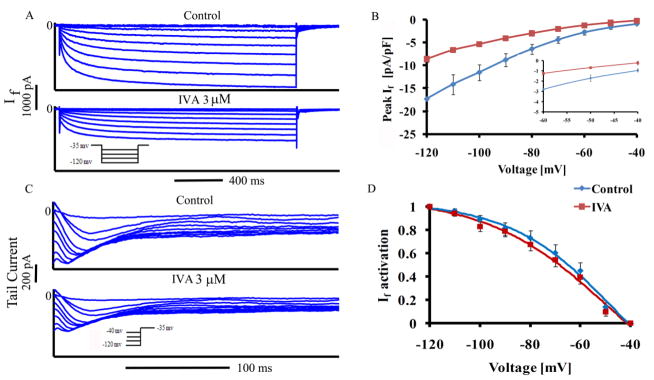
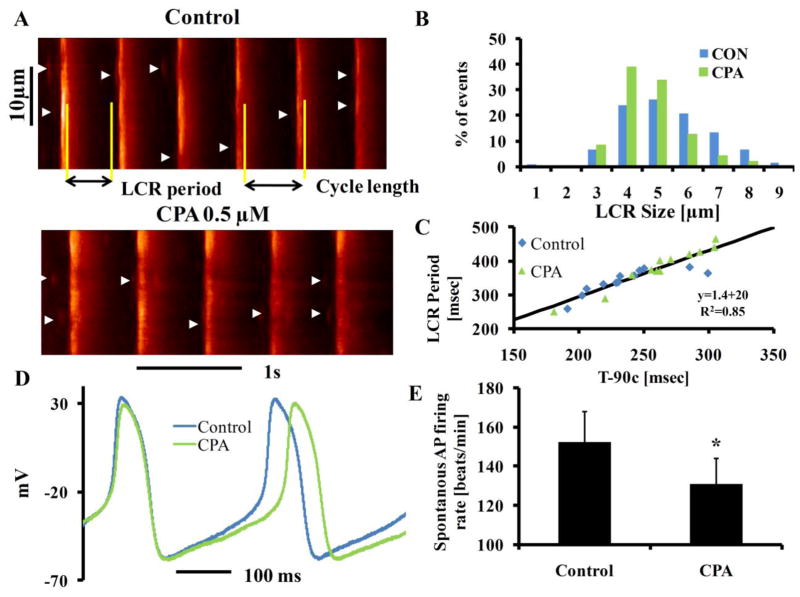
Beneficial clinical bradycardic effects of ivabradine (IVA) have been interpreted solely on the basis of If inhibition, because IVA specifically inhibits If in sinoatrial nodal pacemaker cells (SANC). However, it has been recently hypothesized that SANC normal automaticity is regulated by crosstalk between an "M clock," the ensemble of surface membrane ion channels, and a "Ca(2+) clock," the sarcoplasmic reticulum (SR). We tested the hypothesis that crosstalk between the two clocks regulates SANC automaticity, and that indirect suppression of the Ca(2+) clock further contributes to IVA-induced bradycardia. IVA (3 μM) not only reduced If amplitude by 45 ± 6% in isolated rabbit SANC, but the IVA-induced slowing of the action potential (AP) firing rate was accompanied by reduced SR Ca(2+) load, slowed intracellular Ca(2+) cycling kinetics, and prolonged the period of spontaneous local Ca(2+) releases (LCRs) occurring during diastolic depolarization. Direct and specific inhibition of SERCA2 by cyclopiazonic acid (CPA) had effects similar to IVA on LCR period and AP cycle length. Specifically, the LCR period and AP cycle length shift toward longer times almost equally by either direct perturbations of the M clock (IVA) or the Ca(2+) clock (CPA), indicating that the LCR period reports the crosstalk between the clocks. Our numerical model simulations predict that entrainment between the two clocks that involves a reduction in INCX during diastolic depolarization is required to explain the experimentally AP firing rate reduction by IVA. In summary, our study provides new evidence that a coupled-clock system regulates normal cardiac pacemaker cell automaticity. Thus, IVA-induced bradycardia includes a suppression of both clocks within this system.
Keywords: 50% decay time of intracellular Ca(2+); 90% decay time of intracellular Ca(2+); AC; AP; Action potential; Adenylyl-cyclases; CPA; Ca(2+) cycling; Cyclopiazonic acid; IVA; Ion channels; Ivabradine; LCR; Local Ca(2+) release; M; MDP; Maximum diastolic depolarization; Membrane; PKA; PLB; Phospholamban; Physiology; Protein kinase A; SANC; SR; Sarcoplasmic reticulum; Sinoatrial nodal pacemaker cells; Sinoatrial-node cells; T-50(c); T-90(c).
Published by Elsevier Ltd.
Figures


Similar articles
-
Stochasticity intrinsic to coupled-clock mechanisms underlies beat-to-beat variability of spontaneous action potential firing in sinoatrial node pacemaker cells.J Mol Cell Cardiol. 2014 Dec;77:1-10. doi: 10.1016/j.yjmcc.2014.09.008. Epub 2014 Sep 22. J Mol Cell Cardiol. 2014. PMID: 25257916 Free PMC article.
-
Phosphoprotein Phosphatase 1 but Not 2A Activity Modulates Coupled-Clock Mechanisms to Impact on Intrinsic Automaticity of Sinoatrial Nodal Pacemaker Cells.Cells. 2021 Nov 10;10(11):3106. doi: 10.3390/cells10113106. Cells. 2021. PMID: 34831329 Free PMC article.
-
Sarcoplasmic reticulum Ca2+ cycling protein phosphorylation in a physiologic Ca2+ milieu unleashes a high-power, rhythmic Ca2+ clock in ventricular myocytes: relevance to arrhythmias and bio-pacemaker design.J Mol Cell Cardiol. 2014 Jan;66:106-15. doi: 10.1016/j.yjmcc.2013.11.011. Epub 2013 Nov 22. J Mol Cell Cardiol. 2014. PMID: 24274954 Free PMC article.
-
Unique Ca2+-Cycling Protein Abundance and Regulation Sustains Local Ca2+ Releases and Spontaneous Firing of Rabbit Sinoatrial Node Cells.Int J Mol Sci. 2018 Jul 25;19(8):2173. doi: 10.3390/ijms19082173. Int J Mol Sci. 2018. PMID: 30044420 Free PMC article. Review.
-
Dynamic interactions of an intracellular Ca2+ clock and membrane ion channel clock underlie robust initiation and regulation of cardiac pacemaker function.Cardiovasc Res. 2008 Jan 15;77(2):274-84. doi: 10.1093/cvr/cvm058. Epub 2007 Nov 5. Cardiovasc Res. 2008. PMID: 18006441 Review.
Cited by
-
Drivers of Sinoatrial Node Automaticity in Zebrafish: Comparison With Mechanisms of Mammalian Pacemaker Function.Front Physiol. 2022 Feb 28;13:818122. doi: 10.3389/fphys.2022.818122. eCollection 2022. Front Physiol. 2022. PMID: 35295582 Free PMC article.
-
Age-associated abnormalities of intrinsic automaticity of sinoatrial nodal cells are linked to deficient cAMP-PKA-Ca(2+) signaling.Am J Physiol Heart Circ Physiol. 2014 May 15;306(10):H1385-97. doi: 10.1152/ajpheart.00088.2014. Epub 2014 Mar 14. Am J Physiol Heart Circ Physiol. 2014. PMID: 24633551 Free PMC article.
-
Numerical Modeling Calcium and CaMKII Effects in the SA Node.Front Pharmacol. 2014 Apr 1;5:58. doi: 10.3389/fphar.2014.00058. eCollection 2014. Front Pharmacol. 2014. PMID: 24744732 Free PMC article. Review.
-
Dual Activation of Phosphodiesterase 3 and 4 Regulates Basal Cardiac Pacemaker Function and Beyond.Int J Mol Sci. 2021 Aug 5;22(16):8414. doi: 10.3390/ijms22168414. Int J Mol Sci. 2021. PMID: 34445119 Free PMC article. Review.
-
Synergy between Membrane Currents Prevents Severe Bradycardia in Mouse Sinoatrial Node Tissue.Int J Mol Sci. 2023 Mar 17;24(6):5786. doi: 10.3390/ijms24065786. Int J Mol Sci. 2023. PMID: 36982861 Free PMC article.
References
-
- Riccioni G. Ivabradine: recent and potential applications in clinical practice. Expert Opin Pharmacother. 2011;12(3):443–50. - PubMed
-
- Busseuil D, Shi Y, Mecteau M, Brand G, Gillis MA, Thorin E, et al. Heart rate reduction by ivabradine reduces diastolic dysfunction and cardiac fibrosis. Cardiology. 2010;117(3):234–42. - PubMed
-
- Volterrani M, Cice G, Caminiti G, Vitale C, D’Isa S, Perrone Filardi P, et al. Effect of Carvedilol, Ivabradine or their combination on exercise capacity in patients with Heart Failure (the CARVIVA HF trial) Int J Cardiol. 2011;151(2):218–24. - PubMed
-
- Heusch G, Skyschally A, Gres P, van Caster P, Schilawa D, Schulz R. Improvement of regional myocardial blood flow and function and reduction of infarct size with ivabradine: protection beyond heart rate reduction. Eur Heart J. 2008;29(18):2265–75. - PubMed
Publication types
MeSH terms
Substances
Grants and funding
LinkOut - more resources
Full Text Sources
Other Literature Sources
Research Materials
Miscellaneous
