. 2013:4:1829.
doi: 10.1038/ncomms2852.

The gut microbiota suppresses insulin-mediated fat accumulation via the short-chain fatty acid receptor GPR43

Affiliations
Free PMC article

The gut microbiota suppresses insulin-mediated fat accumulation via the short-chain fatty acid receptor GPR43

Ikuo Kimura et al. Nat Commun. 2013.
Free PMC article

Abstract

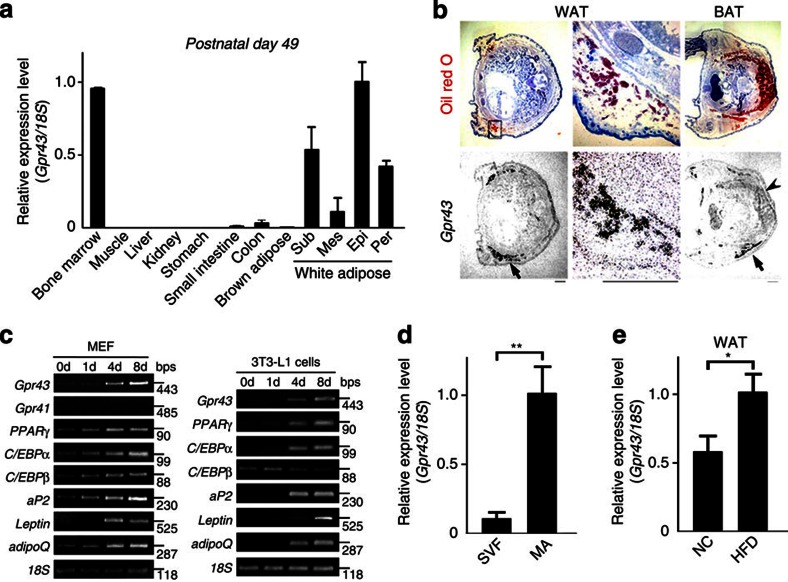
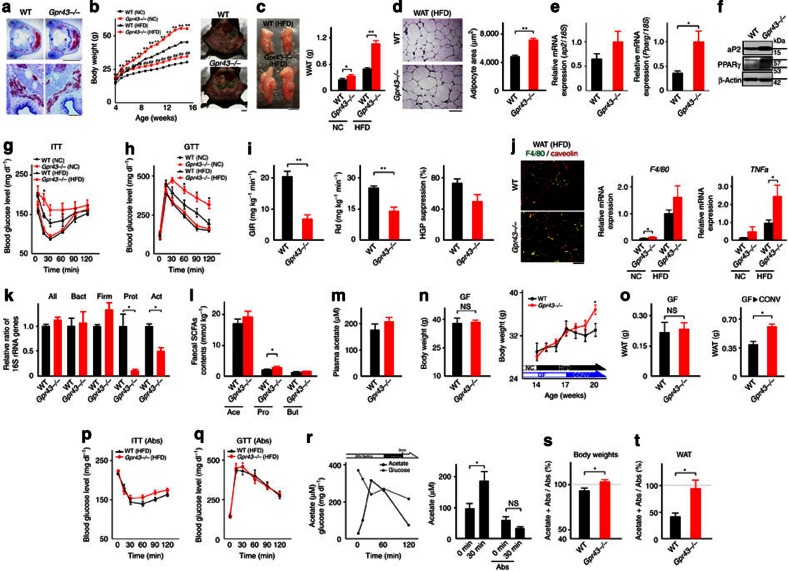
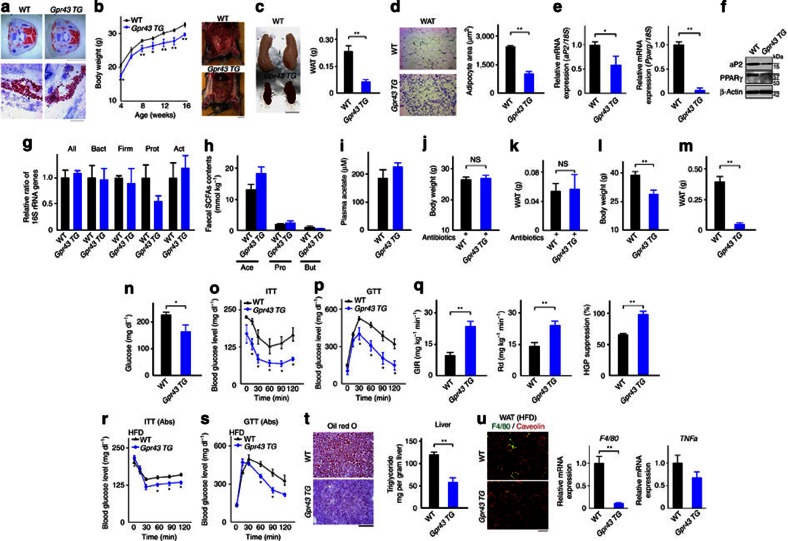
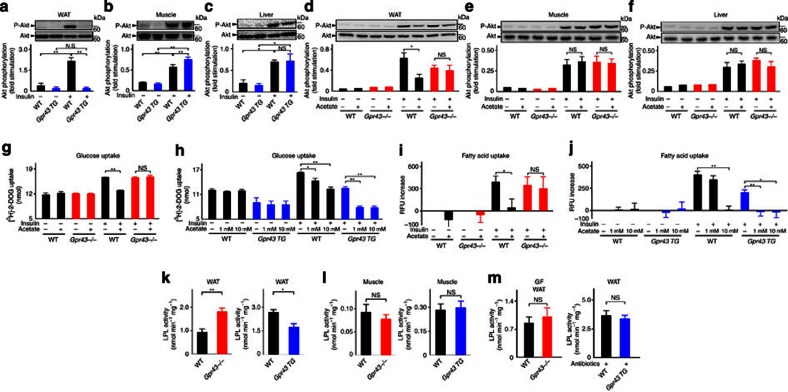
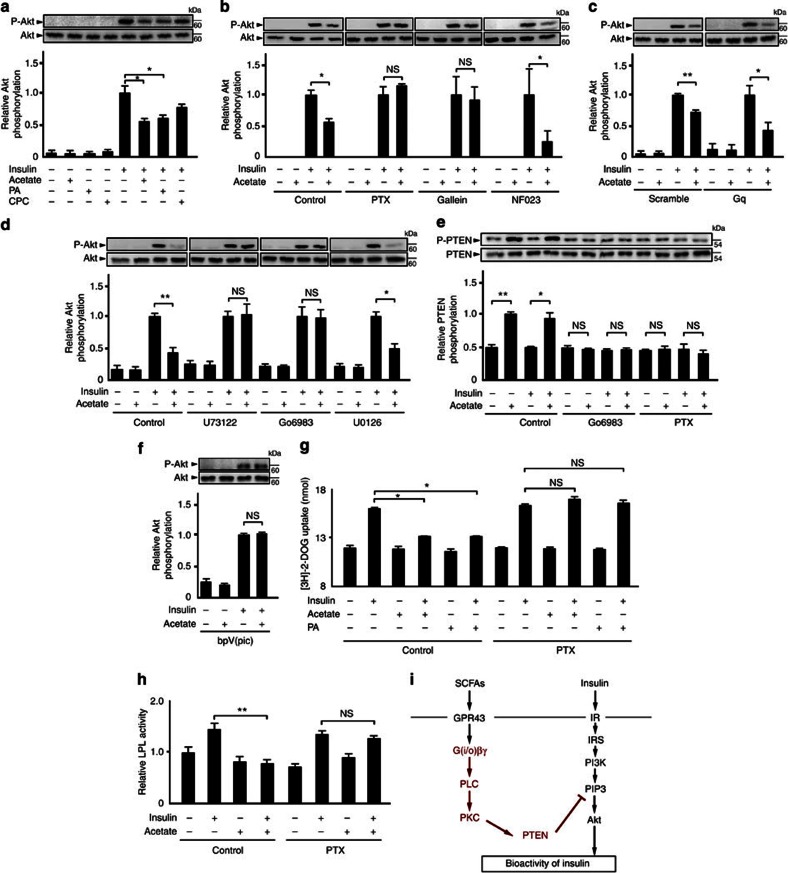
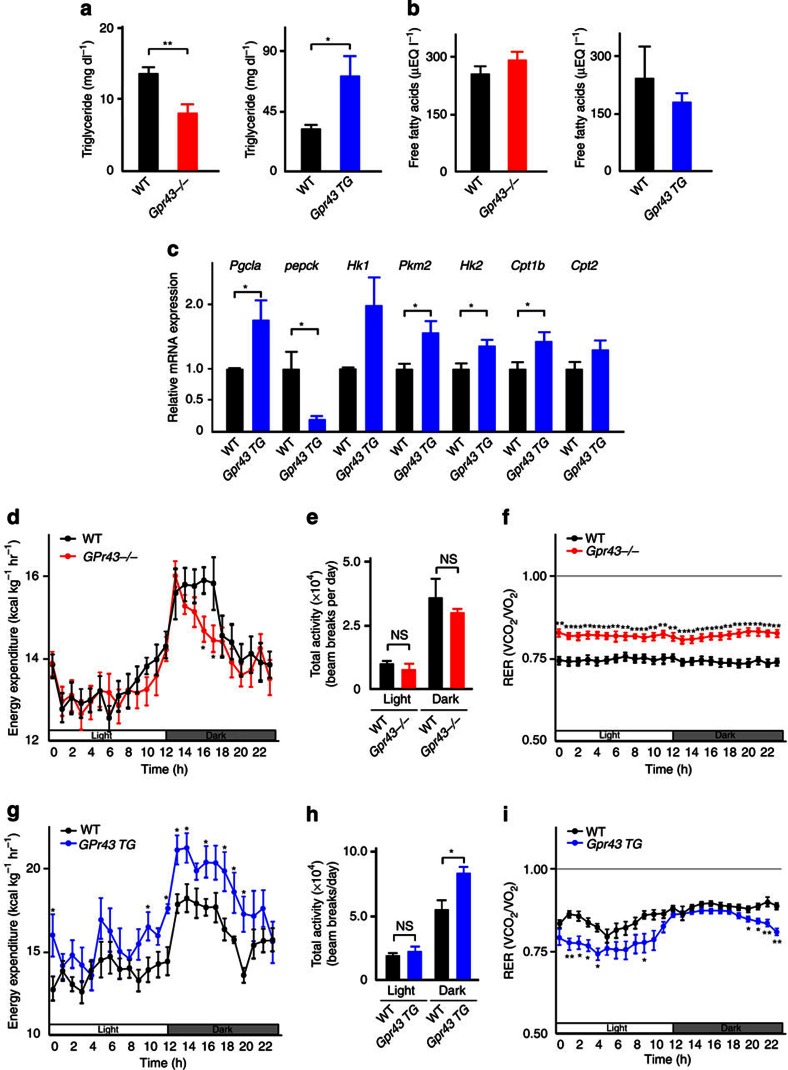
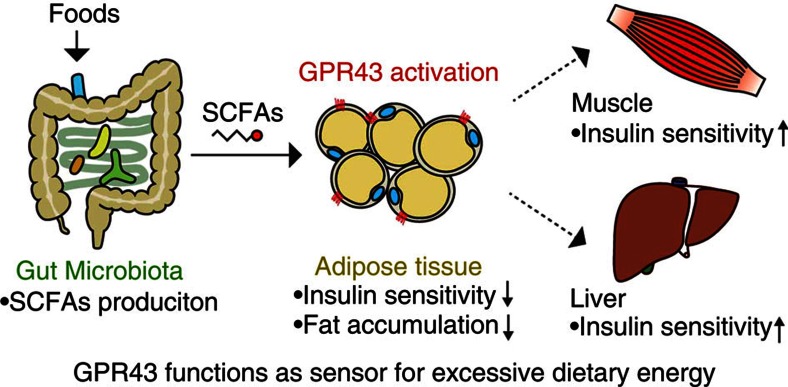
The gut microbiota affects nutrient acquisition and energy regulation of the host, and can influence the development of obesity, insulin resistance, and diabetes. During feeding, gut microbes produce short-chain fatty acids, which are important energy sources for the host. Here we show that the short-chain fatty acid receptor GPR43 links the metabolic activity of the gut microbiota with host body energy homoeostasis. We demonstrate that GPR43-deficient mice are obese on a normal diet, whereas mice overexpressing GPR43 specifically in adipose tissue remain lean even when fed a high-fat diet. Raised under germ-free conditions or after treatment with antibiotics, both types of mice have a normal phenotype. We further show that short-chain fatty acid-mediated activation of GPR43 suppresses insulin signalling in adipocytes, which inhibits fat accumulation in adipose tissue and promotes the metabolism of unincorporated lipids and glucose in other tissues. These findings establish GPR43 as a sensor for excessive dietary energy, thereby controlling body energy utilization while maintaining metabolic homoeostasis.


Figures

Figure 1
Figure 1. Gpr43 is abundantly expressed in the WATs.
(a) Gpr43 expression in postnatal mouse tissues (P49) measured by qRT-PCR (n=3). Internal control: 18S rRNA expression. (b) Gpr43 mRNA localization in mouse embryos (P1) as determined by in situ hybridization using an 35S-labelled antisense Gpr43 RNA probe. Black grains superimposed on haematoxylin−eosin (H&E) and oil red O-stained sections indicate Gpr43 mRNA localization. Arrow indicates WAT; arrowhead indicates BAT. Scale bar, 1 mm. (c) Expression of Gpr43 mRNA during differentiation. MEF and 3T3-L1 pre-adipocytes were induced to differentiate in the presence of MDI. Total RNA was analysed by RT-PCR. 18S was used as a loading control. (d) Gpr43 expression in stromal vascular fraction (SVF) and MAs measured by qRT-PCR (n=3). 18S was used as a loading control. (e) Gpr43 expression in the WAT of NC and HFD-fed mice measured by qRT-PCR (n=4); 18S was used as a loading control. Mice were analysed at 16 weeks of age (d, e). All data are presented as mean±s.e.m. Student’s t-test; *P<0.05; **P<0.005. Epi, epididymal; Mes, mesenteric; Per, perirenal; Sub, subcutaneous.
Figure 2
Figure 2. Gpr43 knockout mice are obese.
(a) WAT and BAT of littermates (P1) were stained with oil red O. Scale bar: 5 mm (upper), 100 μm (lower). Body weight (b, n=10, 11) and fat mass (c, n=6–10) changes. Scale bar, 1 cm. (d) Haematoxylin–eosin (H&E)-stained WAT and mean area of adipocytes (n=3). Scale bar, 100 μm. Expression of aP2 and Pparg mRNA (e, n=4) and protein (f) in the WAT of HFD-fed mice. ITT (g, n=4–6) and GTT (h, n=6, 7). (i) Euglycaemic hyperinsulinaemic clamp in HFD-fed mice. Left: glucose infusion ratio; middle: glucose disposal rate; right: hepatic glucose production suppression. Body weights; WT (33±2.9 g): Gpr43−/− (39±1.7 g), 14–15 weeks of age (n=4). (j) Level of inflammation (left panel) and expression of F4/80 (middle panel, n=4, 5) and TNFa (right panel, n=4−6) mRNA in WAT. Scale bar, 100 μm. (k) Comparison of microbial communities in HFD-fed mice, as assessed by qPCR (n=4). Act, actinobacteria; All, all bacteria; Bact, bacteroidetes; Firm, firmicutes; Prot, γ-proteobacteria. (l, m) Faecal major SCFA and plasma acetate contents in HFD-fed mice (n=4). Ace, acetate; But, butyrate; Pro, propionate. (n) Body weights of HFD-fed mice under GF conditions (20 weeks) (n=4, 6) (left panel). Body weight changes under GF to CONV conditions (n=4–6) (right panel). (o) Fat mass in 18-week-old mice under GF condition (n=4, 6) and 22-week-old mice on HFD under CONV conditions after 16 weeks of GF conditions (n=4, 5). (p, q) ITT and GTT under antibiotic treatment (n=4). Abs, antibiotics. (r) Acetate and glucose plasma concentrations after 1 h of feeding (24 h fasting) (left panel). Plasma acetate concentration with or without antibiotic treatment during feeding (right panel) (n=4). (s, t) Effect of acetate on body weights and fat mass under antibiotic treatment (n=6). Mice were analysed at 14 or 16 weeks of age. All data are presented as mean±s.e.m. Student’s t-test; *P<0.05; **P<0.005; NS, not significant.
Figure 3
Figure 3. Adipose tissue-specific Gpr43 transgenic mice are lean.
(a) Subcutaneous WAT and interscapular BAT of littermates (P1) were stained with oil red O. Scale bar: 5 mm (upper), 100 μm (lower). Body weight changes (b, n=6–8) and fat mass (c, n=6, 5). Scale bar, 1 cm. (d) Haematoxylin–eosin (H&E)-stained epididymal WAT and mean area of adipocytes (n=4, 3). Scale bar, 100 μm. Expression of aP2 and Pparg mRNA (e, n=6, 5) and protein (f) in the WAT; β-actin was used as a loading control. (g) Comparison of microbial communities, as assessed by qPCR (n=4). Faecal major SCFA (h, n=4) and plasma acetate (i, n=5) contents in aP2-Gpr43TG mice fed an HFD (n=4). Body weight (j) and fat mass (k) under antibiotic treatment (n=7, 6). Body weight (l) and fat mass (m) of aP2-Gpr43TG mice fed an HFD (n=7). (n) Plasma glucose concentration in aP2-Gpr43TG mice fed an HFD (n=6). ITT (o) and GTT (p) in aP2-Gpr43 TG mice fed an HFD (n=6, 5). (q) Euglycaemic hyperinsulinaemic clamp in aP2-Gpr43TG mice fed an HFD. Left: glucose infusion ratio; middle: glucose disposal rate; right: hepatic glucose production suppression. Body weights; WT (44±1.3 g): aP2-Gpr43TG (33±1.1 g), 17 weeks of age (n=6, 5). ITT (r) and GTT (s) in aP2-Gpr43TG mice fed an HFD under antibiotic treatment (n=3). (t) Oil red O-stained liver and hepatic triglyceride content in aP2-Gpr43 TG mice fed an HFD (n=6, 4). Scale bar, 100 μm. (u) Level of WAT inflammation. Merged images from WAT, costained with anti-F4/80 (green) and anti-caveolin1 (red) antibodies (left panel). Scale bar, 100 μm. Expression of F4/80 (middle panel, n=4–5) and TNFa (right panel, n=4–6) mRNA in the WAT. Mice were analysed at 16 weeks of age. All data are presented as mean±s.e.m. Student’s t-test; *P<0.05; **P<0.005; NS, not significant.
Figure 4
Figure 4. GPR43 suppresses insulin signalling in the adipose tissues but not in muscles or liver.
Insulin-stimulated Akt phosphorylation of Ser473 in the WAT (a, n=3), muscles (b, n=4) and liver (c, n=3) of aP2-Gpr43TG mice fed an HFD after 6 h of fasting. (df) Inhibitory effects of acetate on insulin signalling (1 g kg−1, i.p.). After pretreatment with acetate for 40 min, a bolus of insulin (0.15 U kg−1) with or without acetate (1 g kg−1) was administered intraperitoneally. Akt phosphorylation of Ser473 in the WAT (d, n=3), muscles (e, n=3) and liver (f, n=3) of Gpr43−/− mice after 6 h of fasting. (g, h) Effect of acetate on glucose uptake in MEF-derived adipocytes from Gpr43−/− or aP2-Gpr43TG mice (n=4, respectively). (i, j) Effect of acetate on the fatty acid uptake in MEF-derived adipocytes from Gpr43−/− or aP2-Gpr43TG mice (n=8–15). LPL activity in the WAT (k, n=4–5) and the muscles (l, n=3–5) of Gpr43−/− or aP2-Gpr43TG mice (n=3–4). (m) LPL activity of Gpr43−/− mice fed an HFD under GF conditions (n=4, 6) or aP2-Gpr43TG mice treated with antibiotics (n=7, 6). All mice were analysed at 15–16 weeks of age. All data are presented as mean±s.e.m. analysis of variance followed by Tukey–Kramer’s post hoc test (aj) and Student’s t-test (km); *P<0.05; **P<0.005; NS, not significant.
Figure 5
Figure 5. GPR43 suppresses insulin signalling via G(i/o)βγ-PLC–PKC–PTEN signalling.
(a) Inhibitory effects of GPR43 agonists (10 mM acetate and 10 μM PA) and a GPR41 agonist (10 μM cyclopropanecarboxylic acid (CPC)) on insulin-induced Akt phosphorylation (n=3). PA, phenylacetamide. (b) Effects of Gi/o signalling inhibition on suppression of insulin-induced Akt phosphorylation by acetate (n=3). (c) Effects of Gq signalling inhibition using siRNA (no. 1) on suppression of insulin-induced Akt phosphorylation by acetate (n=3). (d) Effects of Gβγ signalling inhibition on suppression of insulin-induced Akt phosphorylation by acetate (n=3). (e) Effects of GPR43 stimulation on PTEN phosphorylation (n=3). (f) Effects of PTEN signalling inhibition on suppression of insulin-induced Akt phosphorylation by acetate (n=3). Cells were stimulated with insulin (3 μg ml−1) in the presence of acetate (10 mM) and bpV(pic) (1 μM) for 5 min after pretreatment with acetate for 2 h. (g) Effect of GPR43 agonists (10 mM acetate and 10 μM PA) on insulin-induced glucose uptake (n=4). (h) Effect of acetate on insulin-induced LPL activity (n=4). Cells were stimulated with insulin (3 μg ml−1) in the presence of acetate (10 mM) and inhibitor for 30 min after pretreatment with acetate for 2 h and PTX (1 μg ml−1) for 4 h. In all experiments, cells were stimulated with insulin (3 μg ml−1) in the presence of GPR43 agonist (10 mM acetate, 10 μM PA, or 10 μM CPC) for 5 min after pretreatment with GPR43 agonists for 2 h, Gallein (10 μM), NF023 (10 μM), PTX (1 μg ml−1), U73122 (1 μM), Go6983 (10 μM),or U0126 (10 μM) for 4 h. All experiments were performed by using 3T3-L1-derived adipocytes (af, h) and MEF-derived adipocytes (g). All data are presented as mean±s.e.m. analysis of variance followed by Tukey–Kramer’s post hoc test; *P<0.05; **P<0.005; NS, not significant. (i) Schematic diagram of the mechanism for GPR43-mediated suppression of fat accumulation. Novel GPR43 signalling events in adipocytes are shown in red.
Figure 6
Figure 6. GPR43 promotes energy expenditure by increasing the consumption of lipids.
Biochemical analysis of plasma obtained from Gpr43−/− mice on an HFD as well as aP2-Gpr43TG mice: triglycerides (a, n=6–7); free fatty acids (b, n=5–9). (c) mRNA levels of genes involved in energy expenditure (Pgc1a), gluconeogenesis (Pepck), glycolysis (Hk1, Pkm2, and Hk2) and β-oxidation (Cpt1b and Cpt2) in the muscles of aP2-Gpr43TG mice on an HFD (n=4). (d) Energy expenditure of Gpr43−/− mice on an HFD (n=7). (e) Total activity in Gpr43−/− mice fed an HFD (n=5, 3). (f) RER of Gpr43−/− mice fed an HFD (n=7). (g) Energy expenditure of aP2-Gpr43TG mice (n=7). (h) Total activity in aP2-Gpr43TG mice (n=5, 4). (i) RER of aP2-Gpr43TG mice (n=7). All mice were analysed at 16 weeks of age. All data are presented as mean±s.e.m. Student’s t-test; *P<0.05; **P<0.005; NS, not significant.
Figure 7
Figure 7. Schematic model of suppression of fat accumulation via GPR43.
After feeding, SCFAs, produced by microbial fermentation in the gut, activate GPR43 in adipose tissues. SCFA-mediated GPR43 activation suppresses insulin-mediated fat accumulation and thereby regulates the energy balance by suppressing accumulation of excess energy and promoting fat consumption.

References

    1. Greiner T. & Backhed F. Effects of the gut microbiota on obesity and glucose homeostasis. Trends Endocrinol. Metab. 22, 117–123 (2011). - PubMed
    1. Kau A. L., Ahern P. P., Griffin N. W., Goodman A. L. & Gordon J. I. Human nutrition, the gut microbiome and the immune system. Nature 474, 327–336 (2011). - PMC - PubMed
    1. Delzenne N. M., Neyrinck A. M., Backhed F. & Cani P. D. Targeting gut microbiota in obesity: effects of prebiotics and probiotics. Nat. Rev. Endocrinol. 7, 639–646 (2011). - PubMed
    1. Henao-Mejia J. et al. Inflammasome-mediated dybiosis regulates progression of NAFLD and obesity. Nature 482, 179–185 (2012). - PMC - PubMed
    1. Muegge B. D. et al. Diet drives convergence in gut microbiome functions across mammalian phylogeny and within humans. Science 332, 970–974 (2011). - PMC - PubMed

Publication types

MeSH terms