. 2013 May 7;6(274):ra32.
doi: 10.1126/scisignal.2003741.

A network of substrates of the E3 ubiquitin ligases MDM2 and HUWE1 control apoptosis independently of p53

Affiliations

A network of substrates of the E3 ubiquitin ligases MDM2 and HUWE1 control apoptosis independently of p53

Manabu Kurokawa et al. Sci Signal. .

Abstract

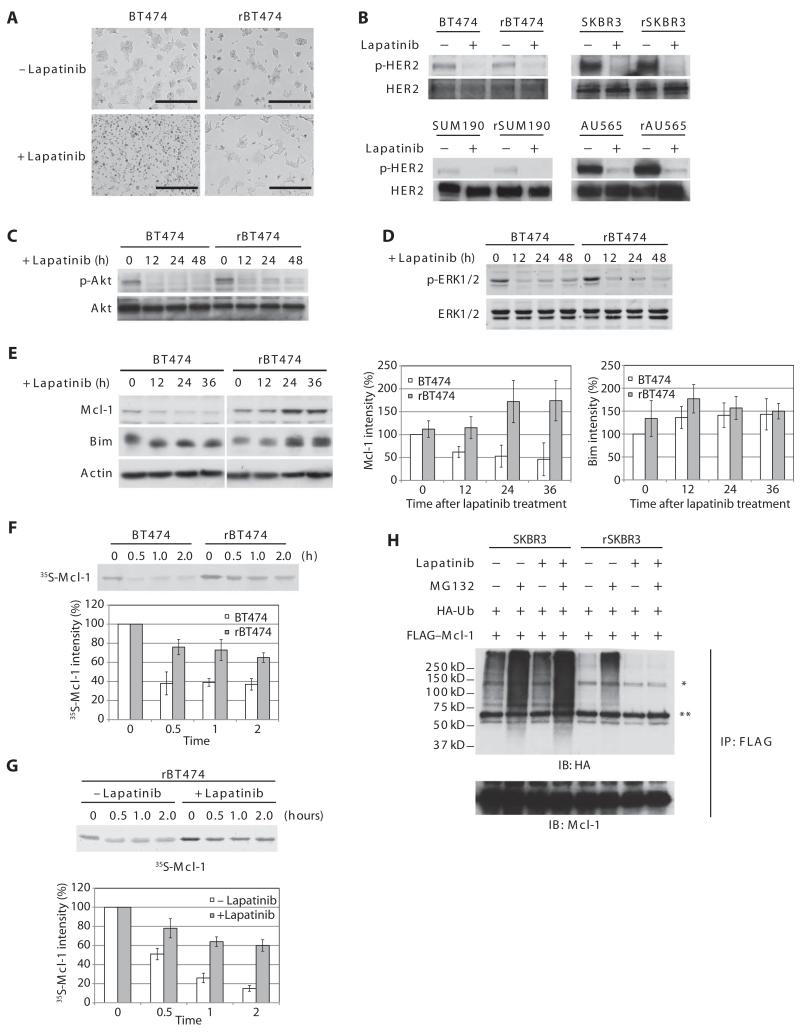
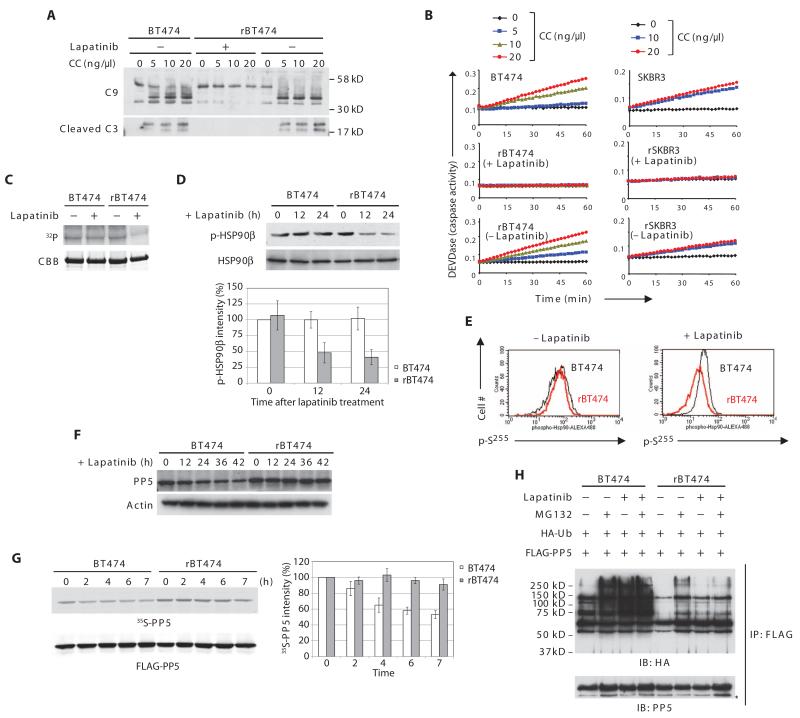
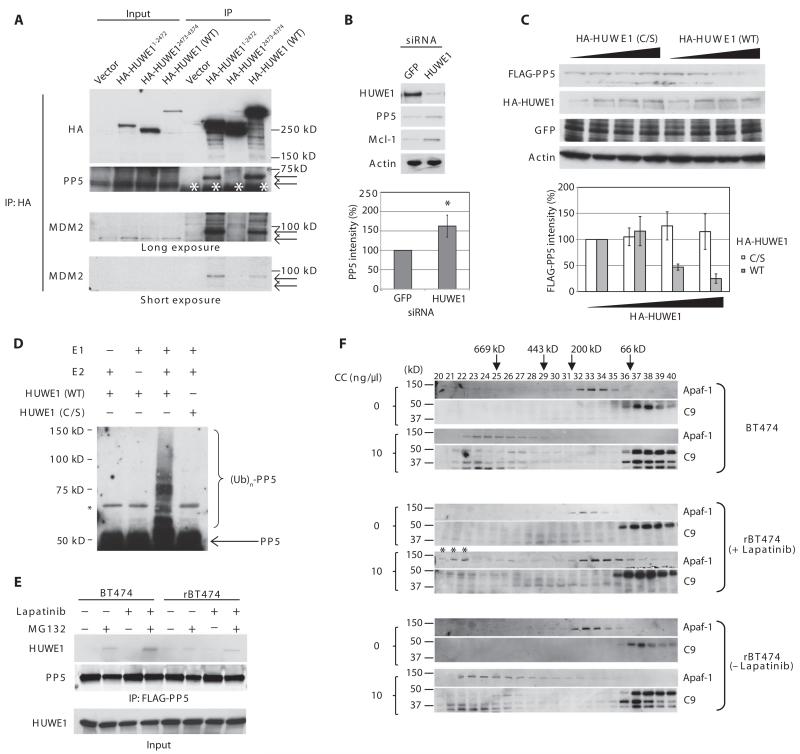
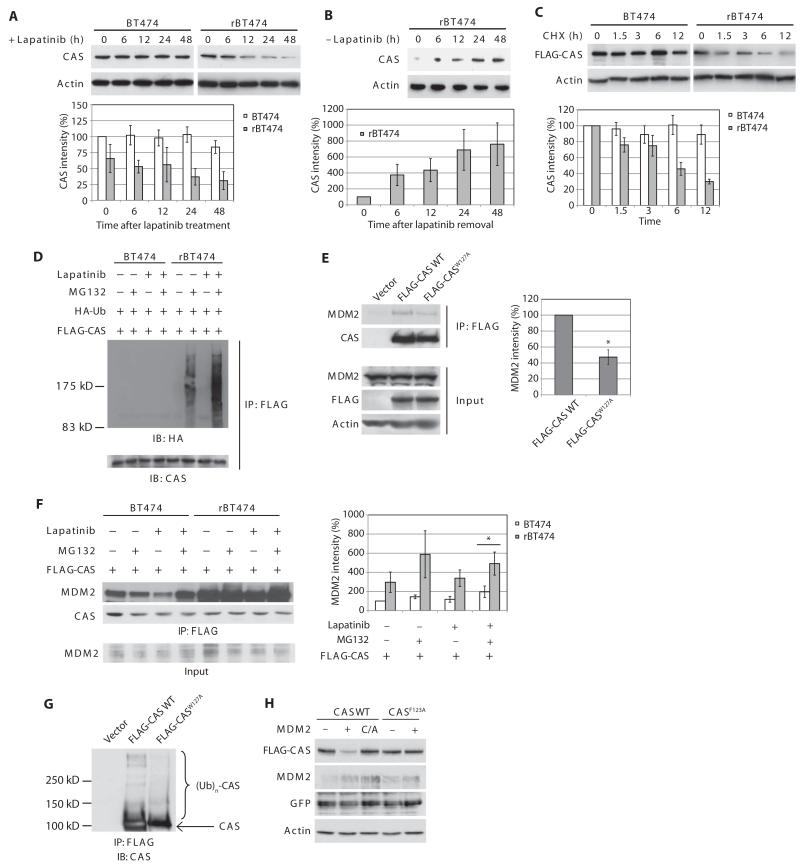
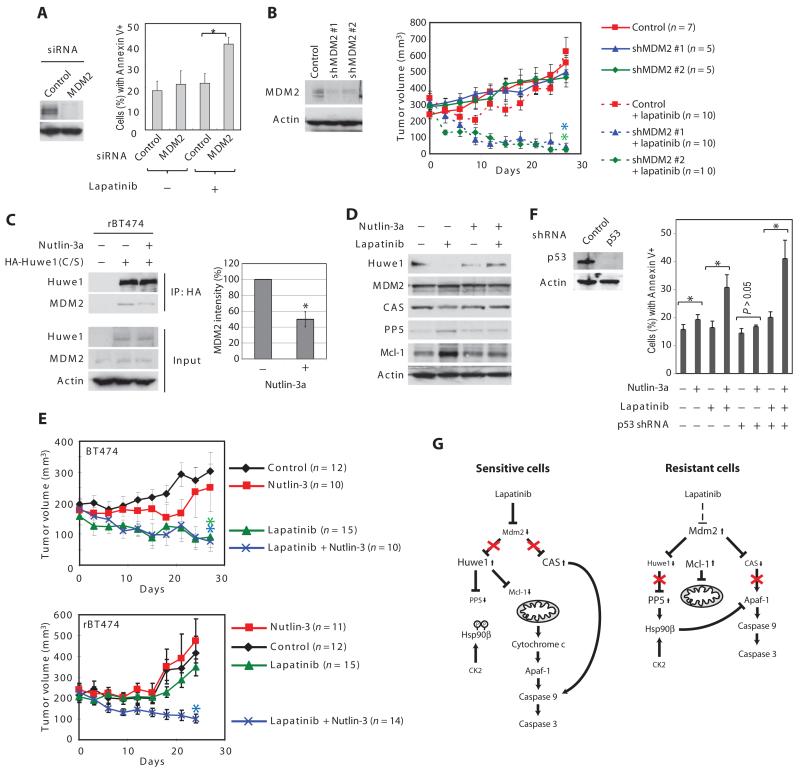
In the intrinsic pathway of apoptosis, cell-damaging signals promote the release of cytochrome c from mitochondria, triggering activation of the Apaf-1 and caspase-9 apoptosome. The ubiquitin E3 ligase MDM2 decreases the stability of the proapoptotic factor p53. We show that it also coordinated apoptotic events in a p53-independent manner by ubiquitylating the apoptosome activator CAS and the ubiquitin E3 ligase HUWE1. HUWE1 ubiquitylates the antiapoptotic factor Mcl-1, and we found that HUWE1 also ubiquitylated PP5 (protein phosphatase 5), which indirectly inhibited apoptosome activation. Breast cancers that are positive for the tyrosine receptor kinase HER2 (human epidermal growth factor receptor 2) tend to be highly aggressive. In HER2-positive breast cancer cells treated with the HER2 tyrosine kinase inhibitor lapatinib, MDM2 was degraded and HUWE1 was stabilized. In contrast, in breast cancer cells that acquired resistance to lapatinib, the abundance of MDM2 was not decreased and HUWE1 was degraded, which inhibited apoptosis, regardless of p53 status. MDM2 inhibition overcame lapatinib resistance in cells with either wild-type or mutant p53 and in xenograft models. These findings demonstrate broader, p53-independent roles for MDM2 and HUWE1 in apoptosis and specifically suggest the potential for therapy directed against MDM2 to overcome lapatinib resistance.


Figures

Fig. 1
Fig. 1. Mcl-1 is stabilized in lapatinib-resistant cells
(A) Photo micrograph of lapatinib-sensitive and resistant BT474 cells (BT474 and rBT474, respectively) treated with lapatinib. Scale bars, 400 μm. n = 3 independent experiments. (B) Cells treated with or without lapatinib in the presence of the caspase inhibitor z-VAD were immunoblotted with antibodies against phospho-HER2 (p-HER2) (Tyr877) and total HER2. n = 3 independent experiments. (C) BT474 and rBT474 cells treated with lapatinib and z-VAD for the indicated times were immunoblotted for phospho-Akt (p-Akt)(Thr308)andtotalAkt.n=2independentexperiments.(D)BT474 and rBT474 cellstreated with lapatinib and z-VAD for the indicated times were immunoblotted for phospho-ERK1/2 (p-ERK1/2) (Thr202 and Tyr204) and total ERK1/2. n = 3 independent experiments. (E) BT474 and rBT474 treated with lapatinib for the indicated times were immunoblotted for Mcl-1, Bim, and actin. A representative result is shown (left). Densitometric analysis of the abundance of Mcl-1 and Bim normalized to that of actin is shown (right). The protein abundance at the 0 time point in BT474 cells was set at 100%. n = 5 (Mcl-1) and n = 3 (Bim) independent experiments (means ± SEM). (F) 35S-labeled Mcl-1 protein was incubated in cell-free lysates prepared from BT474 and rBT474. Mcl-1 stability was monitored by detecting 35S-labeled Mcl-1 at the indicated time points. Representative result (top panel) and densitometric analysis of the abundance of Mcl-1 (bottom panel) are shown. The 35S-labeled Mcl-1 abundance at the 0 time point was set at 100%. n = 3 independent experiments (means ± SEM). (G) 35S-labeled Mcl-1 protein was incubated in lysates prepared from rBT474 cells treated with or without lapatinib for 7 days. Mcl-1 stability was monitored by detecting 35S-labeled Mcl-1 at the indicated time points. Representative result (top) and densitometric analysis of the abundance of Mcl-1 (bottom) are shown. The 35S-labeled Mcl-1 abundance at the 0 time point was set at 100%. n = 4 independent experiments (means ± SEM). (H) SKBR3 or rSKBR3 cells expressing FLAG-Mcl-1 and HA-ubiquitin (Ub) were treated with lapatinib in the presence of z-VAD and harvested after treatment with MG132 (Z-Leu-Leu-Leu-CHO). FLAG-Mcl-1 immunoprecipitates were immunoblotted for HA to analyze Mcl-1 ubiquitylation [*nonspecific band, immunoglobulin G (IgG) heavy chain]. IP, immunoprecipitation; IB, immunoblotting. n = 3 independent experiments.
Fig. 2
Fig. 2. PP5 stability and post-cytochrome c protection in lapatinib-resistant cells
(A) rBT474 cells were cultured in the presence or absence of lapatinib for 1 week, whereas BT474 cells were maintained without lapatinib. Cytosolic lysates prepared from BT474 or rBT474 cells were incubated with 2′-deoxyadenosine 5′-triphosphate (dATP) and various amounts of cytochrome c (CC). Immunoblotting was performed for caspase-9 (cleaved and noncleaved) and cleaved caspase-3 (C9 and C3, respectively). n = 5 independent experiments. (B) Caspase-3 activity was assayed by measuring cleavage of DEVD-pNA after incubation of the cell lysates with dATP and various concentrations of cytochrome c. A representative result of five independent experiments is shown. (C) BT474 or rBT474 cells were cultured in the presence or absence of lapatinib for 6 hours and in the presence of z-VAD. Recombinant His-tagged HSP90β protein on nickel beads was incubated with the cell lysates in the presence of [γ-32P]ATP. HSP90β phosphorylation (32P) and total HSP90β protein [Coomassie brilliant blue (CBB)] are shown. n = 3 independent experiments. (D) BT474 or rBT474 cells treated with lapatinib for the indicated times were analyzed by immunoblotting for phospho-HSP90β (Ser226) and total HSP90β. Densitometric analysis of phospho-HSP90β (p-HSP90β) normalized to total HSP90β from four independent experiments is shown (means ± SEM). Phospho-HSP90β at the 0 time point in BT474 cells was set at 100%. (E) BT474 or rBT474 cells treated with lapatinib were fixed and incubated with phospho-Hsp90β (Ser255) antibody followed by an Alexa Fluor 488-conjugated secondary antibody. The phosphorylation status of Ser255 was analyzed by FACS (fluorescence-activated cell sorting; black: BT474; red: rBT474). n = 2 independent experiments. (F) BT474 and rBT474 treated with lapatinib for the indicated times were immunoblotted for PP5 and actin. n = 3 independent experiments. (G) BT474 or rBT474 cells expressing FLAG-PP5 were labeled by the addition of 35[S]Met and 35[S]Cys and cultured in the presence of lapatinib. 35S radioactivity (35S-labeled PP5) was measured in FLAG-PP5 immunoprecipitates collected at the indicated time points. Densitometric analysis of the abundance of 35S-labeled PP5 from five independent experiments is shown (means ± SEM). The 35S-labeled PP5 abundance at 0 time point was set at 100%. (H) BT474 or rBT474 cells expressing FLAG-PP5 and HA-Ub were cultured in the presence or absence of lapatinib and harvested after treatment with MG132. FLAG-PP5 immunoprecipitates were immunoblotted for HA to analyze PP5 ubiquitylation (*IgG heavy chain). n = 3 independent experiments.
Fig. 3
Fig. 3. HUWE1 is a PP5 ubiquitin ligase
(A) BT474 cells were transfected with empty vector, HA-tagged HUWE1 encoding residues 1 to 2472 (HA-HUWE11-2472), 2473 to 4374 (HA-HUWE12473-4374), or the full-length protein [HA-HUWE1 WT (wild type)]. HA-HUWE1 immunoprecipitates were immunoblotted to detect the association of endogenous PP5 and MDM2 (*IgG heavy chain). After coimmunoprecipitation with HA-HUWE1, PP5 and MDM2 bands showed decreased mobility (arrows). n = 3 independent experiments. (B) BT474 cells transfected with GFP (green fluorescent protein)– or HUWE1-specific siRNA were immunoblotted with the indicated antibodies. A representative result is shown (top). Densitometric analysis of the abundance of PP5 normalized to that of actin is shown (bottom, n = 7 independent experiments). The band intensity in GFP siRNA-treated cells was set at 100%. *P < 0.05 by Student’s t test. (C) BT474 cells transfected with increasing amounts of HA-HUWE1 (WT) or its catalytically inactive mutant HA-HUWE1 (C/S) along with FLAG-PP5 and GFP (transfection control) were immunoblotted for FLAG, HA, GFP, and actin. A representative result is shown (top). Densitometric analysis of the abundance of FLAG-PP5 normalized to that of GFP is shown (bottom). The FLAG-PP5 abundance at the lowest amount of HA-HUWE1 transfected was set at 100%. n = 3 independent experiments. (D) Ubiquitylation of PP5 was reconstituted in vitro by incubating recombinant PP5 protein with E1, UbcH7 (E2), ubiquitin (Ub), and recombinant HUWE1 protein [WT or HUWE1 (C/S)] in reaction buffer. The reactions were immunoblotted for PP5. n = 3 independent experiments. (E) BT474 or rBT474 cells expressing FLAG-PP5 were treated with lapatinib and harvested after MG132 treatment. FLAG-PP5 immunoprecipitates were immunoblotted to detect the association of endogenous HUWE1 with PP5. n = 3 independent experiments. (F) Cell lysates prepared from BT474 or rBT474 cells were incubated with or without dATP and cytochrome c and subjected to gel filtration on a Superdex 200 column. Each fraction was immunoblotted for Apaf-1 and caspase-9. The asterisks show that a portion of Apaf-1 in the lapatinib-treated resistant cell lysate formed higher-order oligomers in response to cytochrome c. n = 3 independent experiments.
Fig. 4
Fig. 4. CAS degradation in lapatinib-resistant cells
(A) BT474 and rBT474 (left) cultured in the absence of lapatinibfor1weekwere treated with lapatinib for the indicated times and immunoblotted for CAS and actin (top). Densitometric analysis of the abundance of CAS normalized to that of actin from four independent experiments (means ± SEM) is shown (bottom). CAS abundance at time 0 in BT474 cells was set at 100%. (B) rBT474 cells maintained in the presence of lapatinib were harvested at various time points after removal of lapatinib and immunoblotted for CAS and actin (top). Densitometric analysis of the abundance of CAS normalized to that of actin from four independent experiments (means ± SEM) is shown (bottom). CAS abundance at time 0 was set at 100%. (C) BT474 and rBT474 cells expressing FLAG-tagged CAS were treatedwith cycloheximide(CHX)andlapatinibfortheindicated times and immunoblotted for FLAG and actin (top). Densitometric analysis of the abundance of FLAG-CAS normalized to that of actin from four independent experiments (means ± SEM) is shown (bottom). FLAG-CAS abundance at time 0 in each cell line was set at 100%. (D) BT474 and rBT474 expressing FLAG-CAS and HA-Ub were treated with lapatinib and z-VAD and harvested after MG132 treatment. FLAG-CAS immunoprecipitates were immunoblotted for HA to analyze ubiquitylation of CAS. n = 2 independent experiments. (E) H1299 cells were transfected with empty vector, FLAG-CAS WT, or FLAG-CASW127A. Immunoprecipitates of the FLAG-tagged proteins were immunoblotted for MDM2. Densitometric analysis of the abundance of immunoprecipitated MDM2 normalized to that of FLAG-CAS WT or FLAG-CASW127A from four independent experiments is shown (means ± SEM). The amount of MDM2 bound to FLAG-CAS WT was set at 100% (*P < 0.05 by paired, two-tailed t test). (F) BT474 and rBT474 cells expressing FLAG-CAS were treated with lapatinib and z-VAD and harvested after MG132 treatment. FLAG-CAS immunoprecipitates were immunoblotted to detect association of endogenous MDM2. Densitometric analysis of the abundance of immunoprecipitated MDM2 normalized to that of immunoprecipitated FLAG-CAS is shown (means ± SEM; n = 4 independent experiments). The immunoprecipitated MDM2 in BT474 cells without any treatments was set at 100% (*P < 0.05 by paired, two-tailed t test). (G) H1299 cells expressing empty vector, FLAG-CASW127A, or FLAG-CAS WT were treated with MG132. Ubiquitylation of CAS was analyzed after immunoprecipitation. n = 2 independent experiments. (H) H1299 cells expressing MDM2 (WT, C/A mutant, or empty vector), FLAG-CAS (WT or F123A mutant), and GFP (transfection control) were immunoblotted for FLAG, MDM2, GFP, and actin. n = 3 independent experiments.
Fig. 5
Fig. 5. MDM2-mediated ubiquitylation and degradation of HUWE1 in lapatinib-resistant cells
(A) Cells treated with lapatinib for various times were immunoblotted for HUWE1, MDM2, and actin. See fig. S17 for the densitometric analysis. n = 3 independent experiments except MDM2 in SUM190/rSUM190 cells (n = 5) and HUWE1 in AU565/rAU565 cells (n = 4). (B) BT474 and rBT474 cells expressing HA-tagged HUWE1 were treated with cycloheximide and lapatinib for various times and immunoblotted for HA and actin. Densitometric analysis of the abundance of HA-HUWE1 normalized to that of actin is shown (means ± SEM; n = 4 independent experiments). HA-HUWE1 abundance at time 0 was set at 100%. (C) H1299 cells were transfected with empty vector, HA-HUWE1W1202A, or HA-HUWE1WT.Immunoprecipitates of HA-tagged proteins were immunoblotted to detect the association of MDM2 (left). Densitometric analysis of the abundance of immunoprecipitated MDM2 normalized to that of immunoprecipitated HA-HUWE1 is shown (means ± SEM; n=4 independentexperiments). The amount of MDM2 that precipitated with HA-HUWE1 WT was set at 100% (*P < 0.05 by paired, two-tailed t test). (D) Fluorescence polarization binding assays were performed with recombinant human MDM2 protein and the indicated peptides. IC50 ± SD, Ki ± SD, and a representative binding curve from threeindependentexperiments are shown. (E) BT474 cells expressing increasing amounts of MDM2 were immunoblotted for HUWE1 and actin. n = 2 independent experiments. (F) SUM190 cells transfected with scrambled or MDM2-specific siRNA were immunoblotted for HUWE1, MDM2, and actin. n = 3 independent experiments. (G) Ubiquitylation of HUWE1 was reconstituted in vitro by incubating recombinant HUWE11-2472 protein with E1, UbcH5 (E2), ubiquitin (Ub), and recombinant MDM2 protein in reaction buffer. The reactions were immunoblotted for HUWE1. n = 4 independent experiments. (H) rBT474 cells were initially transfected with scrambled or MDM2-specific siRNA, then with HA-tagged HUWE1 (WT). Cells were treated with lapatinib. After 24 hours, cycloheximide was added to the culture medium for various times, and cells were immunoblotted for HA and actin. Densitometric analysis of the abundance of HA-HUWE1 normalized to that of actin at each time point is shown (means ± SEM; n = 3 independent experiments). HA-HUWE1 abundance at time 0 was set at 100%.
Fig. 6
Fig. 6. MDM2 inhibition can reverse lapatinib resistance
(A) rBT474 cells transfected with scrambled or MDM2-specific siRNA were treated with lapatinib and subjected to annexin V staining. The percentage of annexin V-positive cells was analyzed by FACS. Results are mean percentages ± SEM and analyzed by paired, two-tailed t test (*P < 0.05, n = 4 independent experiments). (B) rBT474 cells stably expressing control or MDM2-specific shRNA (#1 or #2) were injected into the mam-mary fat pad of female nude mice. The oral administration of lapatinib began when the average tumor volume surpassed 300mm3.Resultsaremean percentages ± SEM. The statistical difference in tumor volume was analyzed by one-way analysis of variance (ANOVA) (P < 0.001) followed by pairwise comparisons using the Bonferroni correction for multiple comparisons. *P < 0.05 between control and shMDM2 #1, and between control and shMDM2 #2 when the mice were treated with lapatinib. n values in the figure indicate the number of mice. (C) H1299 cells transfected with HA-HUWE1 (C/S) were treated with Nutlin-3a. HA-HUWE1 (C/S) immunoprecipitates were immunoblotted for MDM2 (left). Densitometric analysis of the abundance of immunoprecipitated MDM2 normalized to that of immunoprecipitated HA-HUWE1 (C/S) is shown (means ± SEM; n = 4 independent experiments). The amount of MDM2 that precipitated with HUWE1 in the absence of Nutlin-3a was set at 100% (*P < 0.05 by paired, two-tailed t test). (D) rSKBR3 cells were cultured in the presence or absence of lapatinib for a week, and then treated with Nutlin-3a and z-VAD for the indicated times. Cells were immunoblotted for HUWE1, CAS, MDM2, PP5, Mcl-1, and actin. See fig. S17 for the densitometric analysis. n = 6 independent experiments. (E) BT474 and rBT474 cells were injected into the mammary fad pad of each mouse. When tumors developed to a size of 200 mm3, the mice were randomly assigned to receive vehicle, lapatinib, Nutlin-3, or lapatinib and Nutlin-3. Results are mean percentages ± SEM. The statistical difference in tumor volume was analyzed by one-way ANOVA (P = 0.003 and P < 0.001 for BT474 and rBT474 xenografts. respectively) followed by pairwise comparisons using the Bonferroni correction for multiple comparisons. (Top) *P < 0.05 between control and lapatinib and between control and lapatinib + Nutlin-3, whereas the difference was not significant between control and Nutlin-3 in BT474 xenografts. (Bottom) *P < 0.05 between control and lapatinib + Nutlin-3, whereas there was no significant difference between control and Nutlin-3, and between control and lapatinib in rBT474 xenografts. n values in the figure indicate the number of mice. (F) rAU565 cells stably expressing control or p53-specific shRNA were treated with DMSO (dimethyl sulfoxide) or Nutlin-3a in the presence or absence of lapatinib. The percentage of apoptotic cell death was measured by FACS analysis with annexin V. Results are mean percentages ± SEM of annexin V-positive cells (*P < 0.05 by paired, two-tailed t test). n = 4 independent experiments. (G) Model for coordinate control of multiple apoptotic regulators by the MDM2 and HUWE1. In sensitive cells, lapatinib promotes degradation of MDM2, which leads to decreases in the degradation of CAS. Loss of MDM2 also results in increased abundance of HUWE1, which results in more PP5 and Mcl-1 degradation. In lapatinib-resistant cells, MDM2 promotes decreased CAS abundance, decreased HUWE1 abundance, and, consequently, increased abundance of PP5 and Mcl-1. In aggregate, these changes render the cells resistant to lapatinib-induced apoptosis.

References

    1. Hollstein M, Sidransky D, Vogelstein B, Harris CC. p53 mutations in human cancers. Science. 1991;253:49–53. - PubMed
    1. Feki A, Irminger-Finger I. Mutational spectrum of p53 mutations in primary breast and ovarian tumors. Crit. Rev. Oncol. Hematol. 2004;52:103–116. - PubMed
    1. Momand J, Zambetti GP, Olson DC, George D, Levine AJ. The mdm-2 oncogene product forms a complex with the p53 protein and inhibits p53-mediated transactivation. Cell. 1992;69:1237–1245. - PubMed
    1. Oliner JD, Pietenpol JA, Thiagalingam S, Gyuris J, Kinzler KW, Vogelstein B. Oncoprotein MDM2 conceals the activation domain of tumour suppressor p53. Nature. 1993;362:857–860. - PubMed
    1. Haupt Y, Maya R, Kazaz A, Oren M. Mdm2 promotes the rapid degradation of p53. Nature. 1997;387:296–299. - PubMed

Publication types

MeSH terms