Review
. 2013 Jun;139(6):759-83.
doi: 10.1007/s00418-013-1097-6. Epub 2013 May 8.

Mass spectrometry imaging with high resolution in mass and space

Affiliations
Review

Mass spectrometry imaging with high resolution in mass and space

Andreas Römpp et al. Histochem Cell Biol. 2013 Jun.

Abstract

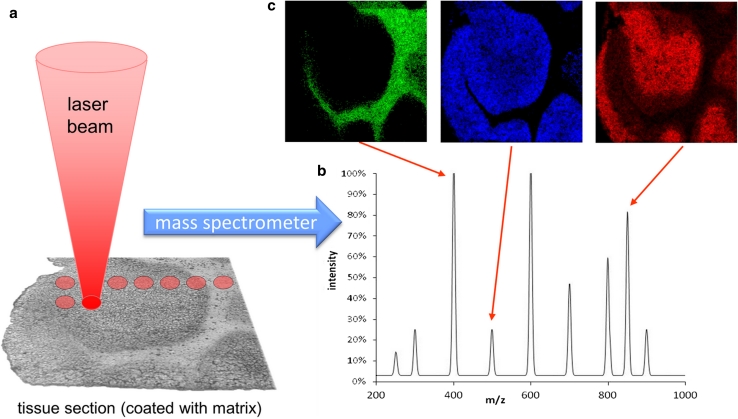
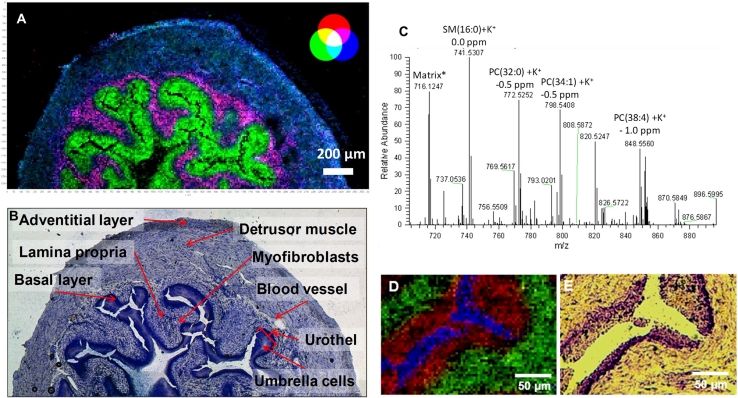
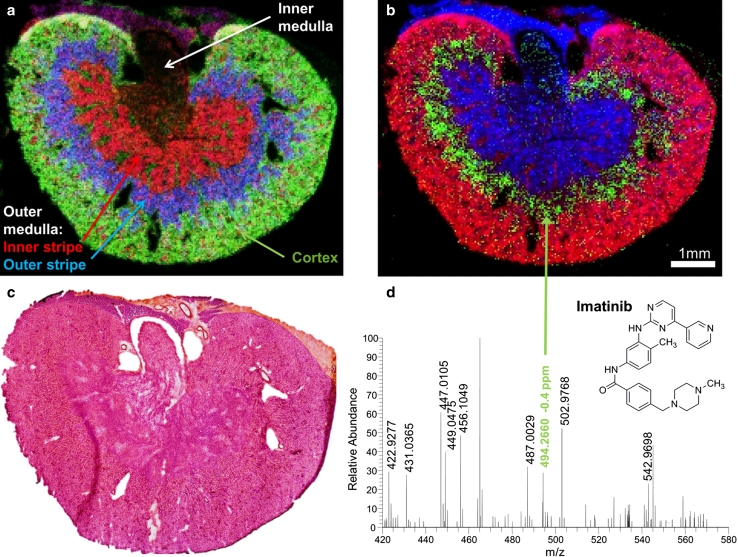
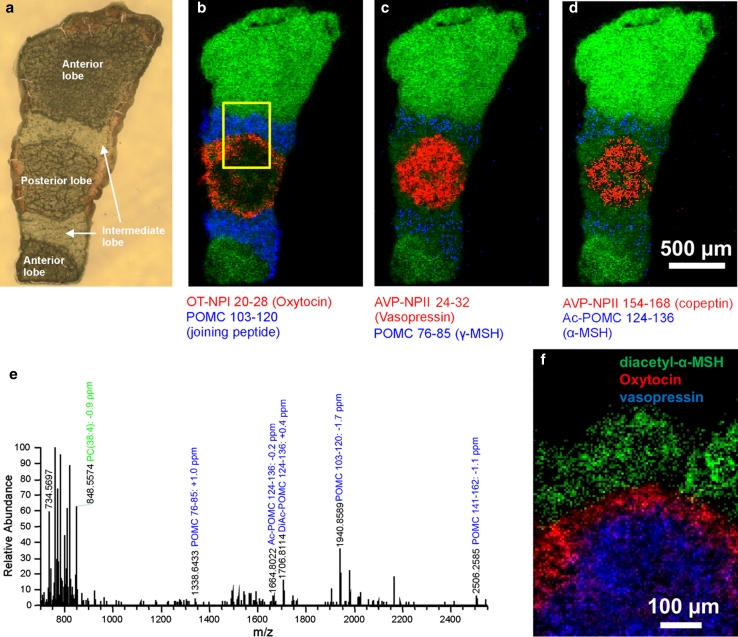
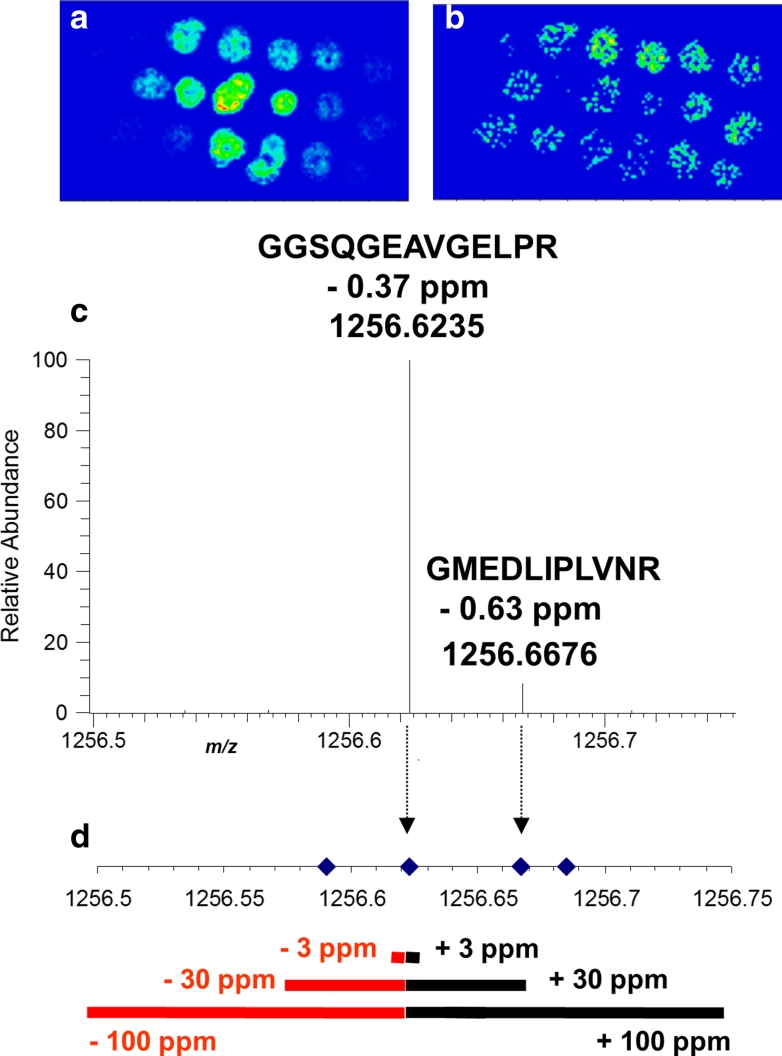
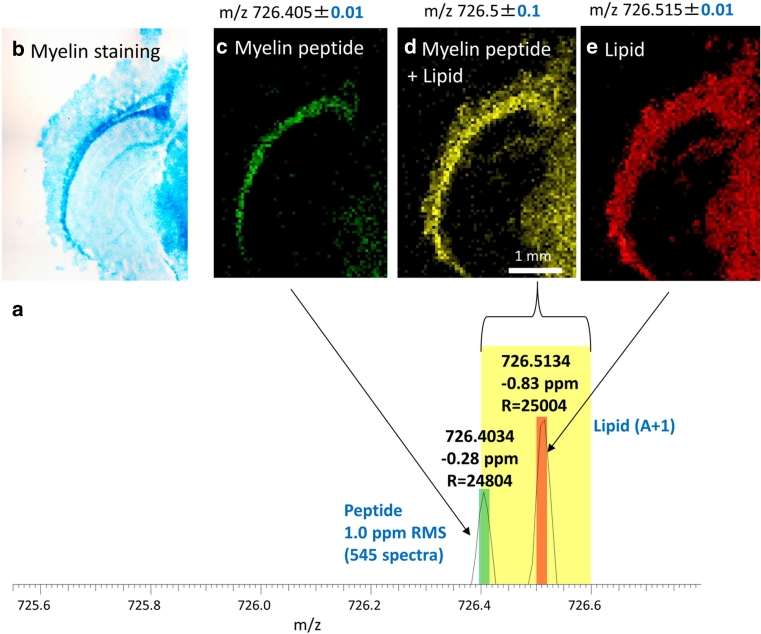
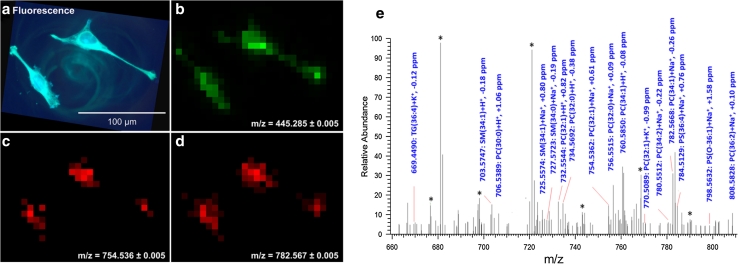
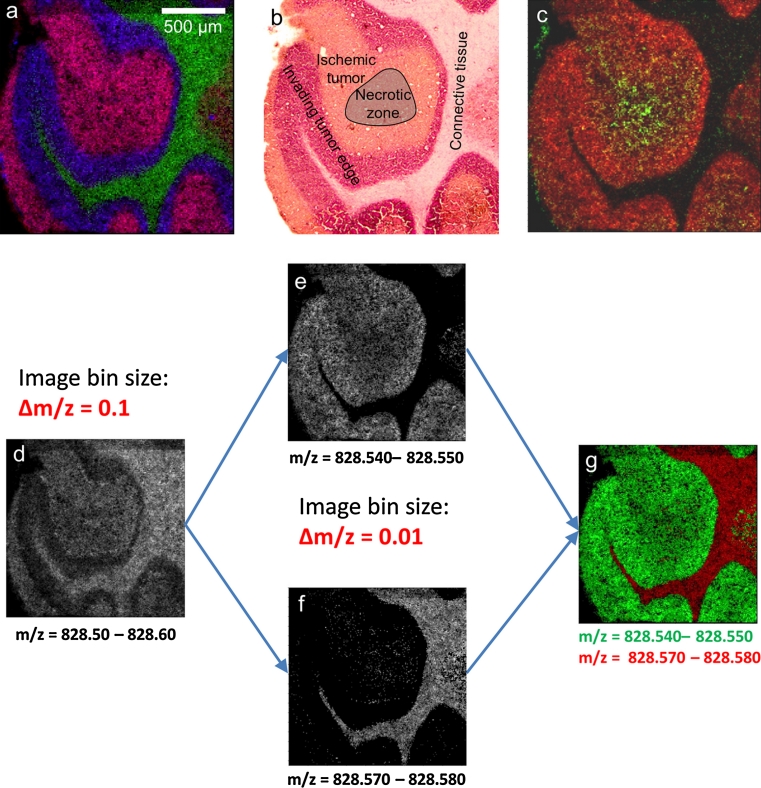
Mass spectrometry (MS) imaging links molecular information and the spatial distribution of analytes within a sample. In contrast to most histochemical techniques, mass spectrometry imaging can differentiate molecular modifications and does not require labeling of targeted compounds. We have recently introduced the first mass spectrometry imaging method that provides highly specific molecular information (high resolution and accuracy in mass) at cellular dimensions (high resolution in space). This method is based on a matrix-assisted laser desorption/ionization (MALDI) imaging source working at atmospheric pressure which is coupled to an orbital trapping mass spectrometer. Here, we present a number of application examples and demonstrate the benefit of 'mass spectrometry imaging with high resolution in mass and space.' Phospholipids, peptides and drug compounds were imaged in a number of tissue samples at a spatial resolution of 5-10 μm. Proteins were analyzed after on-tissue tryptic digestion at 50-μm resolution. Additional applications include the analysis of single cells and of human lung carcinoma tissue as well as the first MALDI imaging measurement of tissue at 3 μm pixel size. MS image analysis for all these experiments showed excellent correlation with histological staining evaluation. The high mass resolution (R = 30,000) and mass accuracy (typically 1 ppm) proved to be essential for specific image generation and reliable identification of analytes in tissue samples. The ability to combine the required high-quality mass analysis with spatial resolution in the range of single cells is a unique feature of our method. With that, it has the potential to supplement classical histochemical protocols and to provide new insights about molecular processes on the cellular level.


Figures

Fig. 1
Fig. 1
Scheme of the mass spectrometry imaging process. a The tissue section is covered with matrix and irradiated by a pulsed laser beam. b Mass spectrum acquired from the tissue section. c MS images of different m/z peaks
Fig. 2
Fig. 2
Mouse urinary bladder a MS image, 10 μm pixel size, 260 × 130 pixels, blue muscle tissue, SM (34:1), [M + K]+, m/z 741.5307, green urothelium, PC (34:1), [M + K]+, m/z 798.5410, red lamina proria, m/z 743.5482. b Optical image of same tissue section after staining (toluidine blue). c Mass spectrum acquired from a single 10-μm pixel. d MS image, 5 μm pixel size, 260 × 130 pixels (detail of larger measurement): blue substrate, Indium cation, m/z 114.9039, red PC (34:1), [M + K]+, m/z 798.5410, green SM (34:1), [M + K]+, m/z 741.5307. e Optical image of same tissue section after staining (toluidine blue). Modified from original figure by Römpp et al. (2010a). Copyright © 2010 WILEY–VCH Verlag GmbH & Co. KGaA, Weinheim
Fig. 3
Fig. 3
Mouse kidney a overlay of selected ion images: green [PC (32:0) + K]+ = 772.5253 cortex, blue [PC (40:6) + K]+ = 872.5566 outer stripe outer medulla, red [PC (38:5) + K]+ = 846.5410 inner stripe outer medulla, 225 × 150 pixels, 35 μm step size, bin width Δm/z = 0.01; b overlay of selected ion images: red [PC (32:0) + K]+ = 772.5253, green imatinib [M + H]+ = 494.2662, blue [PC (34:1) + H]+ = 760.5851, 225 × 150 pixels, 35 μm step size, bin width Δm/z = 0.01; c optical image of the investigated mouse kidney section, H&E stained after MS imaging measurement; d single-pixel mass spectrum of the outer stripe outer medulla of the mouse kidney section. Reprinted from Römpp et al. (2011b)
Fig. 4
Fig. 4
Mouse pituitary gland. a Optical image of mouse pituitary gland tissue section, b, c, d overlay of selected peptide ion images (see label below images) with selected ion image of PC (38:4) (green), 155 × 255 pixels, pixel size was 10 μm. e Single-pixel mass spectrum from intermediate lobe. f Overlay of selected peptide ion images, 100 × 140 pixels. Pixel size 5 μm. Yellow square in b indicates the location of the measured region. Modified from original figure by Guenther et al. (2011)
Fig. 5
Fig. 5
a, b Selected ion images of two identified peptides with an imaging bin width of Δm/z = 0.01. c Section of the averaged mass spectrum of high mass accuracy MS imaging of mouse brain tissue, containing two identified tryptic peptides. d m/z values of all tryptic peptides identified in homogenate LC/ESI–MS/MS measurements in the displayed mass range (m/z 1,256.50–1,256.75). Modified from original figure in Schober et al. (2011). Copyright © 2011 John Wiley & Sons, Ltd
Fig. 6
Fig. 6
Mouse brain (coronal section) after on-tissue tryptic digestion. a Mass spectrum from a single 50-μm pixel. b Optical image of adjacent section after staining for myelin (Luxol fast blue) c, d, e MS images, 50 μm pixel size, 92 × 128 pixels: c selected ion image of m/z = 726.40–726.41 corresponding to myelin peptide. d Selected ion image of m/z = 726.40–726.60. e Selected ion image of m/z = 726.51–726.52 corresponding to lipid isotopologue peak. Details on method can be found in Schober et al. (2012a)
Fig. 7
Fig. 7
HeLa cells on ITO-coated glass slide. a Optical fluorescence of DIOC6(3)-stained HeLa cells (λ = 501 nm). b, c, d MALDI imaging, 7 μm pixel size, 28 × 21 pixels (detail of larger measurement): b selected ion image of staining agent DIOC6(3), [M]+, c selected ion image of phosphatidylcholine PC (32:1), [M + Na]+ and d selected ion image of PC (34:1), [M + Na]+. e Single-pixel mass spectrum (7 μm) acquired from the region of cell nucleus. Reprinted with permission from (Schober et al. 2012b). Copyright 2012 American Chemical Society
Fig. 8
Fig. 8
Human non-small-cell lung carcinoma that was induced into a severe combined immunodeficiency (SCID) mouse model. a MS image, 10 μm pixel size, 185 × 185 pixels, red sphingomyelin SM (36:1), m/z 769.5620, green cerebroside Cer (42:2), [M + K]+, m/z 848.6376, blue phosphatidylcholine PC (36:4), [M + K]+, m/z 820.52531. b H&E staining after measurement. c MS image, 10 μm pixel size, 185 × 185 pixels, green lyso-phosphatidylcholine LPC (16:1), [M + H]+, m/z 496.3397, red phosphatidylcholine PC (38:6) [M + K]+, m/z 844.5253. d, e, g Selected ion images generated with different settings for image generation as indicated in Figure
Fig. 9
Fig. 9
Lateral ventricle region of mouse brain (coronal section). a MS image, 3 μm pixel size, 170 × 300 pixels, green phosphatidylcholine PC (38:4), [M + K]+, m/z 848.5566. blue phosphatidylcholine PC (34:1), [M + K]+, m/z 798.5410, red background signal from ITO-coated glass slide. b Optical image of imaged area before measurement. c Mass spectrum acquired from a single 3-μm pixel
Fig. 10
Fig. 10
MS images of phospholipids in tissue sections at different pixel size settings. a Mouse brain (coronal section), pixel size 5 μm, 170 × 170 pixels. b mouse brain (horizontal section), pixel size 50 μm, 207 × 260 pixels. c Intestinal tract of rat (part of whole body section), pixel size 200 μm, 128 × 150 pixels
Fig. 11
Fig. 11
Combination of data from different MS imaging platforms and software tools on the basis of the common data format imzML. See Schramm et al. (2012) for details

Similar articles

Cited by

References

    1. Abrass CK. Cellular lipid metabolism and the role of lipids in progressive renal disease. Am J Nephrol. 2004;24(1):46–53. doi: 10.1159/000075925. - DOI - PubMed
    1. Acquadro E, Cabella C, Ghiani S, Miragoli L, Bucci EM, Corpillo D. Matrix-assisted laser desorption ionization imaging mass spectrometry detection of a magnetic resonance imaging contrast agent in mouse liver. Anal Chem. 2009;81(7):2779–2784. doi: 10.1021/ac900038y. - DOI - PubMed
    1. Aerni HR, Cornett DS, Caprioli RM. Automated acoustic matrix deposition for MALDI sample preparation. Anal Chem. 2006;78(3):827–834. doi: 10.1021/ac051534r. - DOI - PubMed
    1. Altelaar AFM, van Minnen J, Jiménez CR, Heeren RMA, Piersma SR. Direct molecular imaging of lymnaea stagnalis nervous tissue at subcellular spatial resolution by mass spectrometry. Anal Chem. 2005;77(3):735–741. doi: 10.1021/ac048329g. - DOI - PubMed
    1. Altelaar AFM, Klinkert I, Jalink K, de Lange RPJ, Adan RAH, Heeren RMA, Piersma SR. Gold-enhanced biomolecular surface imaging of cells and tissue by SIMS and MALDI mass spectrometry. Anal Chem. 2006;78(3):734–742. doi: 10.1021/ac0513111. - DOI - PubMed

Publication types

MeSH terms