. 2013 Jul 1;591(13):3433-49.
doi: 10.1113/jphysiol.2012.247817. Epub 2013 May 7.

Enhanced inhibitory neurotransmission in the cerebellar cortex of Atp1a3-deficient heterozygous mice

Affiliations

Enhanced inhibitory neurotransmission in the cerebellar cortex of Atp1a3-deficient heterozygous mice

Keiko Ikeda et al. J Physiol. .

Abstract

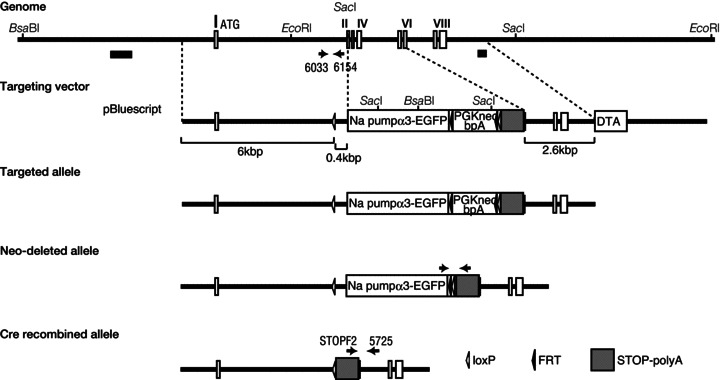
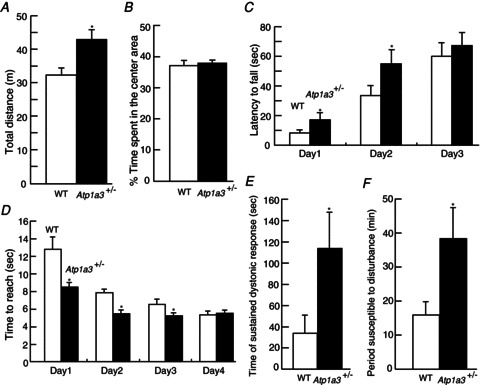
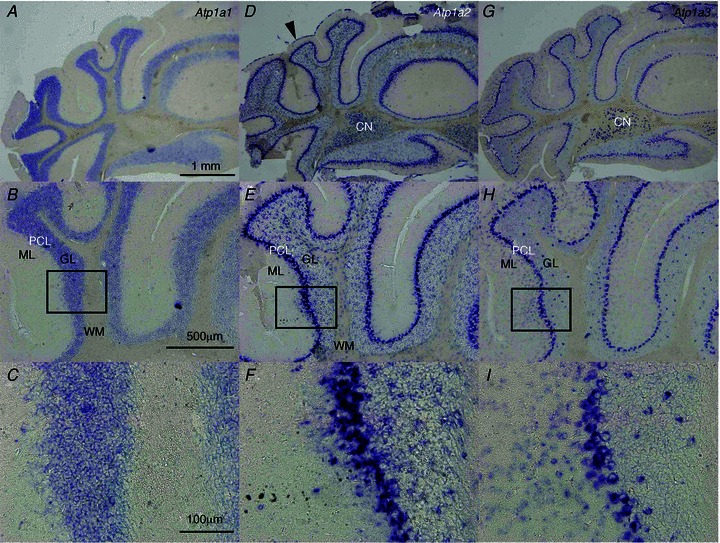
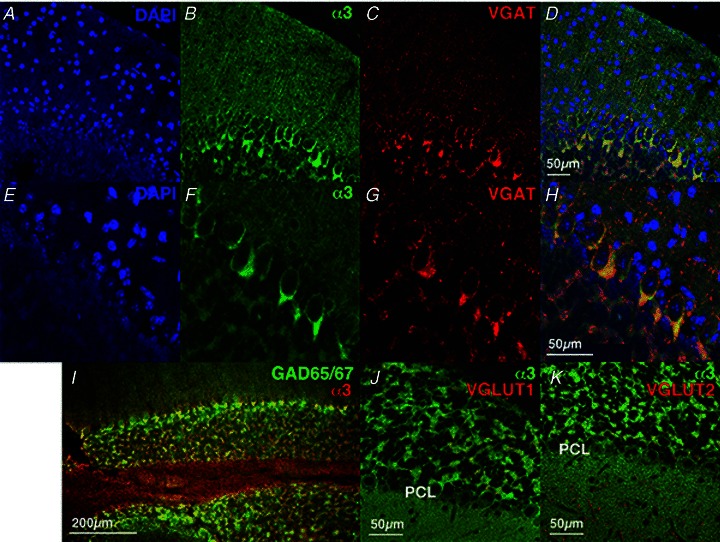
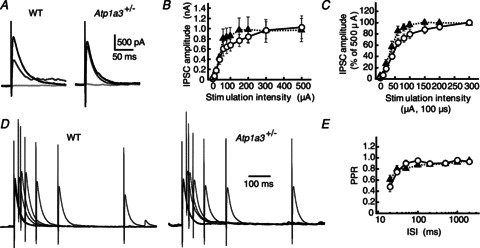
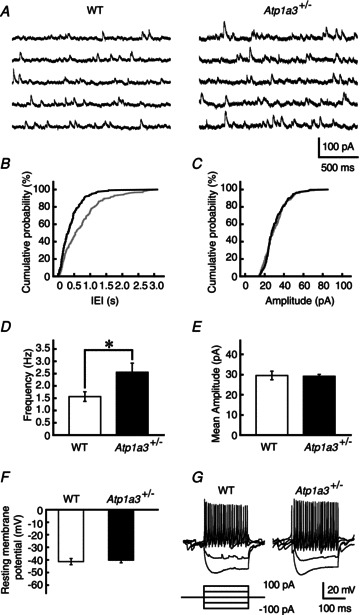
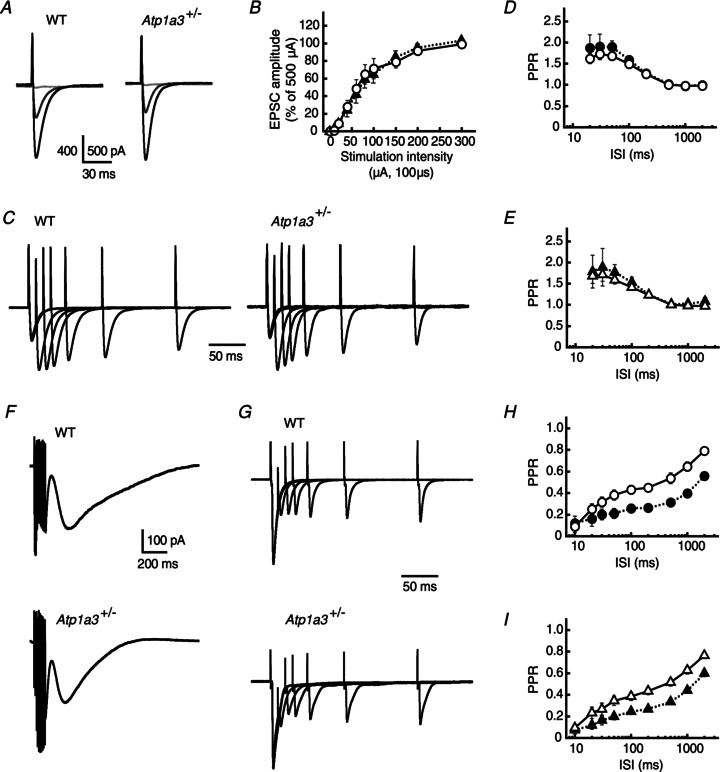
Dystonia is characterized by excessive involuntary and prolonged simultaneous contractions of both agonist and antagonist muscles. Although the basal ganglia have long been proposed as the primary region, recent studies indicated that the cerebellum also plays a key role in the expression of dystonia. One hereditary form of dystonia, rapid-onset dystonia with parkinsonism (RDP), is caused by loss of function mutations of the gene for the Na pump α3 subunit (ATP1A3). Little information is available on the affected brain regions and mechanism for dystonia by the mutations in RDP. The Na pump is composed of α and β subunits and maintains ionic gradients of Na(+) and K(+) across the cell membrane. The gradients are utilized for neurotransmitter reuptake and their alteration modulates neural excitability. To provide insight into the molecular aetiology of RDP, we generated and analysed knockout heterozygous mice (Atp1a3(+/-)). Atp1a3(+/-) showed increased symptoms of dystonia that is induced by kainate injection into the cerebellar vermis. Atp1a3 mRNA was highly expressed in Purkinje cells and molecular-layer interneurons, and its product was concentrated at Purkinje cell soma, the site of abundant vesicular γ-aminobutyric acid transporter (VGAT) signal, suggesting the presynaptic localization of the α3 subunit in the inhibitory synapse. Electrophysiological studies showed that the inhibitory neurotransmission at molecular-layer interneuron-Purkinje cell synapses was enhanced in Atp1a3(+/-) cerebellar cortex, and that the enhancement originated via a presynaptic mechanism. Our results shed light on the role of Atp1a3 in the inhibitory synapse, and potential involvement of inhibitory synaptic dysfunction for the pathophysiology of dystonia.


Figures

Figure 1
Figure 1. Targeting strategy for mutating the Na pump α3 subunit gene (Atp1a3)
Genome scheme with restriction enzyme sites in the uppermost part of the figure. The N-terminal exons of Atp1a3 (exons I–VIII) appear in white boxes. The coding sequence of Atp1a3 plus enhanced green fluorescent protein (EGFP) gene, followed by a neomycin-resistant gene cassette (PGKneobpA, depicted as a white box), flanked by FRT sequences, loxP site and STOP-polyA cassette were replaced to the covering region between exon 2 (II) and exon 6 (VI). A bacterial diphtheria toxin subunit gene (DTA, depicted as a white box) was inserted for negative selection. Southern probes used for Southern blot analyses of genomic DNA appear in the black thick bars in the uppermost part of the figure. The process used to obtain the mutant allele is described in the Methods. Neo-deleted alleles were verified by PCR using the set of primers described by the arrows on the fourth line from the top. The targeted mutant allele, i.e. cre recombined allele, was verified by PCR using primers STOPF2 and 5725 (arrows on the fifth line from the top). The inserted loxP sites and FRT sites are shown as open and filled triangles, respectively.
Figure 2
Figure 2. Altered behaviours in Atp1a3 heterozygous mice (Atp1a3+/−)
A and B, open field test (10 week-old mice); n= 12 for each male genotype mouse. A, total path length in the open-field test. Atp1a3+/− showed significantly increased activities compared with wild-type littermates (WT). B, percentage of time spent in the centre area. C, rotarod test (3 week-old female mice); n= 18 for WT and n= 19 for Atp1a3+/−. Latency to fall from the rod was measured. Atp1a3+/− showed significantly better performance than WT at days 1 and 2. No significant difference was observed on day 3. D, balanced beam test (11–14 week-old mice); n= 12 for each male genotype mouse. Time to reach an escape box was measured. Performance on days 1–3, but not day 4, was significantly better in Atp1a3+/− than WT. E, duration of sustained dystonic response (score D4/D5, Pizoli et al. 2002). Atp1a3+/− showed significantly increased time during which dystonic responses were observed. F, susceptible time of dystonia induction to disturbance. Atp1a3+/− showed significantly longer sensitivity to induced dystonic response; n= 16 (WT) and n= 15 (Atp1a3+/−). Data are mean ± SEM. Open bars: WT, filled bars: Atp1a3+/−. *P < 0.05.
Figure 3
Figure 3. mRNA expression of Na pump α subunits in the cerebellum of juvenile mouse (postnatal day 40)
Alternate sections were examined by in situ hybridization using different probes. A–C, Atp1a1 mRNA expression. D–F, Atp1a2 mRNA expression. Atp1a2 mRNA expression in the pia matter (arrowhead). G–I, Atp1a3 mRNA expression. Boxes in B, E and H show areas that are pictured beneath at higher magnifications (C, F and I, respectively). In each panel, the top is the dorsal and the right is the medial side. CN, cerebellar nuclei; ML, molecular layer; GL, granular layer; PCL, Purkinje cell layer; WM, white matter.
Figure 4
Figure 4. Expression of Na pump α3 subunits, VGAT, GAD65/67, VGLUT1 and VGLUT2 in the cerebellum of young wild-type mice
Immunofluorescence using antibodies to α3 (green, B and F) and VGAT (red, C and G). Nuclei are stained with DAPI (blue, A and E). EH, higher magnifications of AD. Merged figures of α3 and VGAT are shown in D and H. A merged figure of immunofluorescence using antibodies to α3 (red) and GAD65/67 (green) is shown in I. Merged figures using antibodies to α3 (green) and VGLUT1 (red, J) or VGLUT2 (red, K) are shown. AI, P26 mice; J and K, P39 mice.
Figure 5
Figure 5. Comparison of ML interneuron-mediated inhibitory neurotransmission onto Purkinje cells (PCs) between WT and Atp1a3+/−
A, representative traces of IPSCs recorded from a single PC of WT and Atp1a3+/−. The IPSCs were evoked by electrical stimulation with a series of different intensity (from 10 to 500 μA for 100 μs), and superimposed for stimulations at 10 (pale grey lines), 60 (dark grey lines) and 500 μA (black lines). Each trace is derived from averaging the IPSCs of several successive traces recorded every 15 s. Stimulation artifacts were truncated for clarity. B, relationship between IPSC amplitude and stimulation intensity for WT (open circles, n= 12) and Atp1a3+/− (filled triangles, n= 11). Data are mean ± SEM. C, relationship between IPSC amplitude and stimulation intensity of WT (open circles, n= 12) and Atp1a3+/− (filled triangles, n= 11). Data are relative to the amplitude examined at stimulation intensity of 500 μA. Note the significantly higher response to the weak stimulation intensity in Atp1a3+/−. D, representative averaged traces of IPSCs examined by the paired-pulse protocol in PCs of WT and Atp1a3+/−. The traces were normalized relative to the peaks of the first IPSC. E, relationship between the paired-pulse ratio (PPR) and the inter-stimulus intervals (ISI) for IPSCs examined in WT (open circles, n= 11) and Atp1a3+/− (filled triangles, n= 12).
Figure 6
Figure 6. Characterization of miniature IPSCs (mIPSCs) in Atp1a3+/− compared with WT
A, successive traces of mIPSCs recorded from single PCs of WT and Atp1a3+/− in the continuous presence of TTX (1 μm) and CNQX (20 μm). B and C, cumulative distribution of the inter-event intervals (IEI in B) and amplitude of mIPSCs (C) of WT (grey lines) and Atp1a3+/− (black lines). Data were calculated from the trace in A. Note the significant leftward shift in the IEI distribution in the Atp1a3+/− (P < 0.001, Kolmogorov–Smirnov test in B) without a change in the amplitude distribution (P= 0.33, Kolmogorov–Smirnov test in C). D and E, comparison of the frequency (D) and mean amplitude (E) between mIPSCs recorded from PCs of WT (open bar, n= 13) and Atp1a3+/− (filled bar, n= 12). F, comparison of the resting membrane potential of ML interneurons between WT (open bar and circles, n= 12) and Atp1a3+/− (filled bar and triangles, n= 11) (P= 0.46, unpaired t test). G, representative traces of voltage responses recorded from single ML interneurons from WT and Atp1a3+/−. Each trace is derived from several successive traces recorded by the current-clamp technique. Current injection protocol is shown under the trace. Data are mean ± SEM. *P < 0.05.
Figure 7
Figure 7. Comparison of parallel fibre (PF)- and climbing fibre (CF)-mediated excitatory neurotransmission onto PCs between WT and Atp1a3+/−
A, representative averaged traces of PF-mediated EPSCs recorded from a single PC of WT and Atp1a3+/−. The EPSCs were evoked by electrical stimulation with a series of different intensity (from 10 to 500 μA for 100 μs), and superimposed for stimulations at 10 (pale grey lines), 60 (dark grey lines) and 500 μA (black lines). Each trace is derived from averaging the EPSCs of several successive traces recorded every 15 s. Stimulation artifacts were truncated for clarity. B, relationship between the amplitude of PF-PC EPSCs and stimulation intensity for WT (open circles, n= 14) and Atp1a3+/− (filled triangles, n= 13). Data are mean ± SEM and are relative to the amplitude examined at a stimulation intensity of 500 μA. C, representative averaged traces of PF-PC EPSCs examined by the paired-pulse protocol in PCs of WT and Atp1a3+/−. The traces were normalized relative to the peaks of the first EPSC. D and E, relationship between the PPR and ISI for PF-PC EPSCs examined in WT (D, circles) and Atp1a3+/− (E, triangles). The magnitudes of PPR of the EPSC were not significantly different between WT and Atp1a3+/− at any interval tested in the absence (open symbols) and presence (filled symbols) of 2 mmγ-DGG and 50 μm cyclothiazide. F, representative averaged traces of mGluR1/TRPC1-mediated inward currents examined in PCs of WT and Atp1a3+/−. The currents were evoked by trains of PF stimuli (100 Hz for 100 ms) in the presence of 20 μm CNQX and 100 μm picrotoxin. G, representative averaged traces of CF-EPSCs examined by the paired-pulse protocol in PCs of WT and Atp1a3+/−. The traces were normalized relative to the peaks of the first EPSC. H and I, relationship between the PPR and ISI for CF-PC EPSCs examined in WT (H, circles) and Atp1a3+/− (I, triangles). The PPR of CF-EPSCs was not different between WT and Atp1a3+/−, when they were compared in the absence (open symbols) and presence (filled symbols) of γ-DGG and cyclothiazide.

Similar articles

Cited by

References

    1. Batchelor AM, Madge DJ, Garthwaite J. Synaptic activation of metabotropic glutamate receptors in the parallel fibre–Purkinje cell pathway in rat cerebellar slices. Neuroscience. 1994;63:911–915. - PubMed
    1. Blanco-Arias P, Einholm AP, Mamsa H, Concheiro C, Gutiérrez-de-Terán H, Romero J, Toustrup-Jensen MS, Carracedo Á, Jen JC, Vilsen B, Sobrido MJ. A C-terminal mutation of ATP1A3 underscores the crucial role of sodium affinity in the pathophysiology of rapid-onset dystonia-parkinsonism. Hum Mol Genet. 2009;18:2370–2377. - PubMed
    1. Blanco G. The Na/K-ATPase and its isozymes: what we have learned using the baculovirus expression system. Front Biosci. 2005;10:2397–2411. - PubMed
    1. Bøttger P, Tracz Z, Heuck A, Nissen P, Romero-Ramos M, Lykke-Hartmann K. Distribution of Na/K-ATPase alpha 3 isoform, a sodium-potassium P-type pump associated with rapid-onset of dystonia parkinsonism (RDP) in the adult mouse brain. J Comp Neurol. 2011;519:376–404. - PubMed
    1. Brashear A, Dobyns WB, de Carvalho Aguiar P, Borg M, Frijns CJM, Gollamudi S, Green A, Guimaraes J, Haake BC, Klein C, Linazasoro G, Münchau A, Raymond D, Riley D, Saunders-Pullman R, Tijssen MAJ, Webb D, Zaremba J, Bressman SB, Ozelius LJ. The phenotypic spectrum of rapid-onset dystonia-parkinsonism (RDP) and mutations in the ATP1A3 gene. Brain. 2007;130:828–835. - PubMed

Publication types

Substances