Comparative Study
. 2013 Jul-Aug;4(4):292-305.
doi: 10.4161/gmic.24706. Epub 2013 Apr 15.

Gut microbiota, tight junction protein expression, intestinal resistance, bacterial translocation and mortality following cholestasis depend on the genetic background of the host

Affiliations
Comparative Study

Gut microbiota, tight junction protein expression, intestinal resistance, bacterial translocation and mortality following cholestasis depend on the genetic background of the host

Samuel M Alaish et al. Gut Microbes. 2013 Jul-Aug.

Abstract

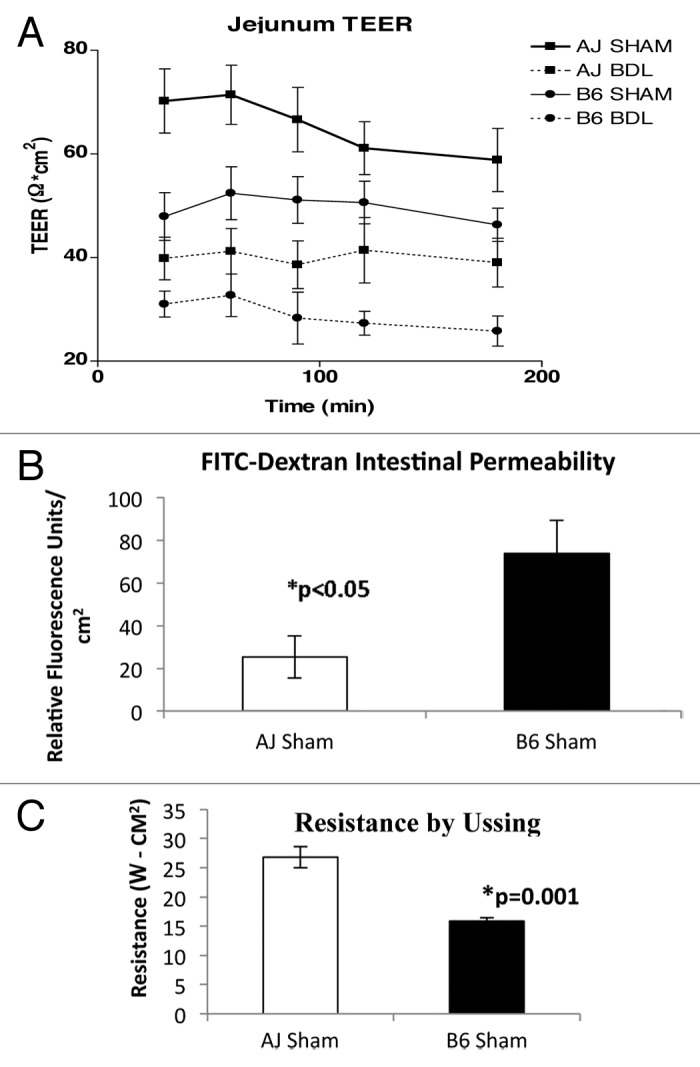
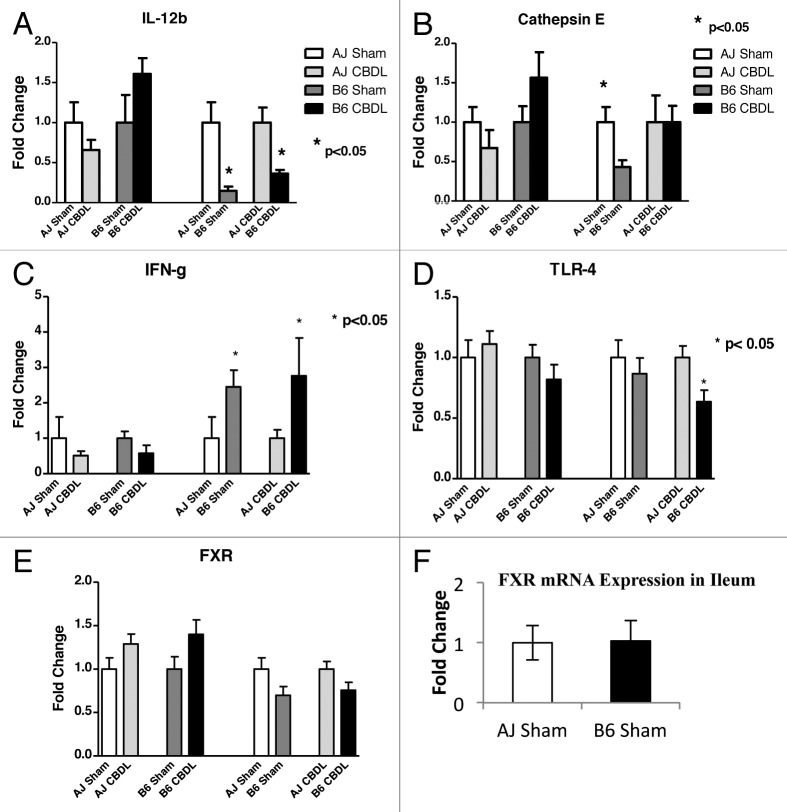
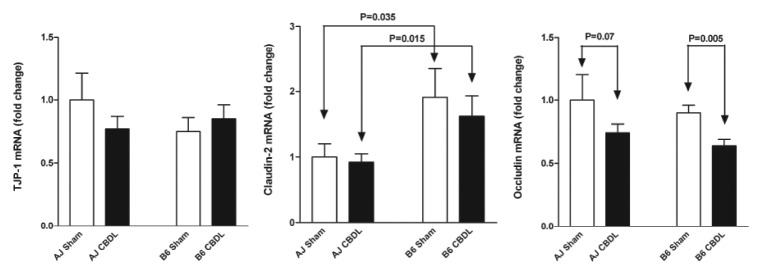
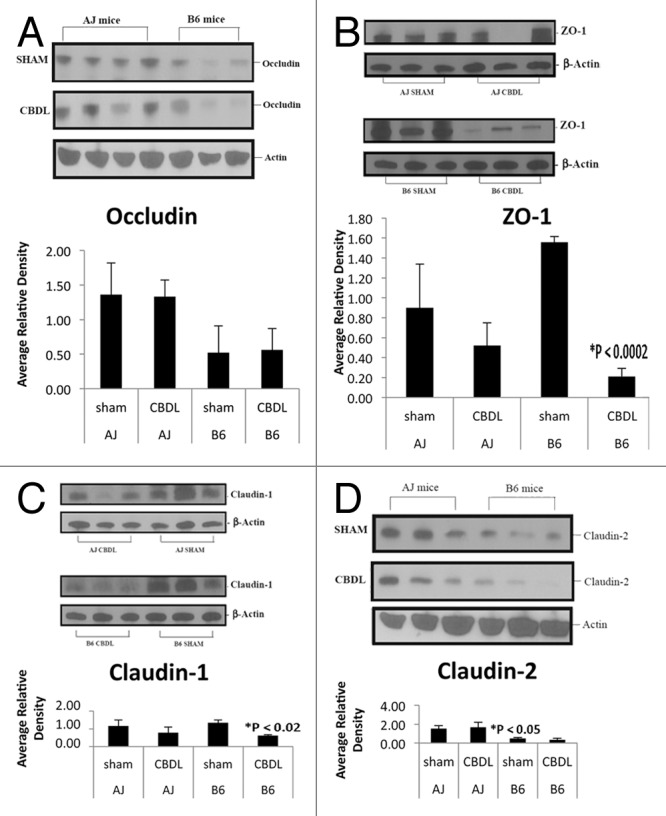
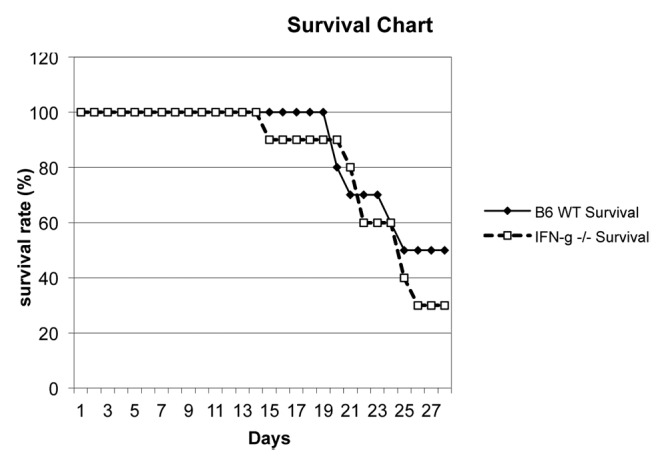
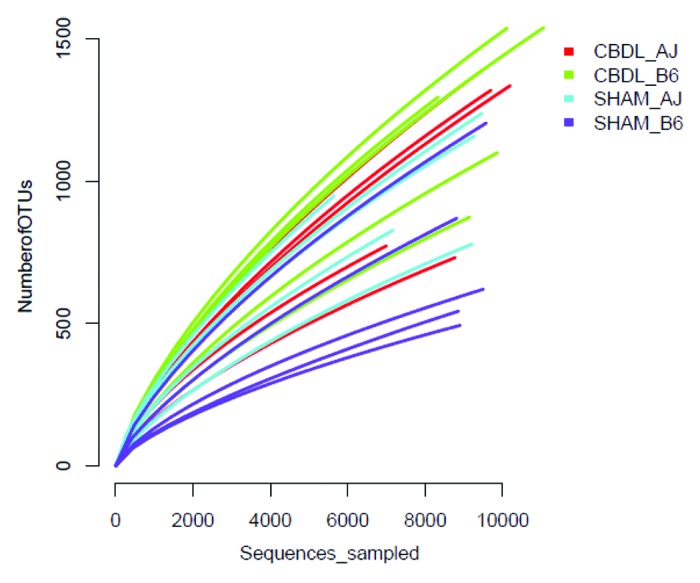
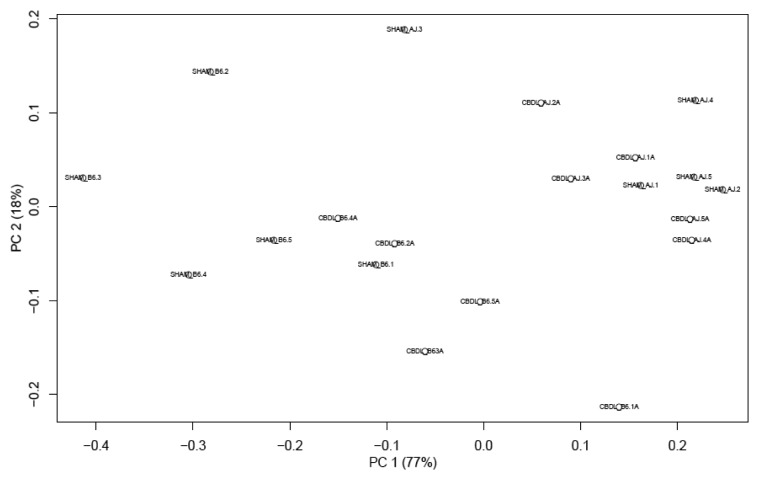
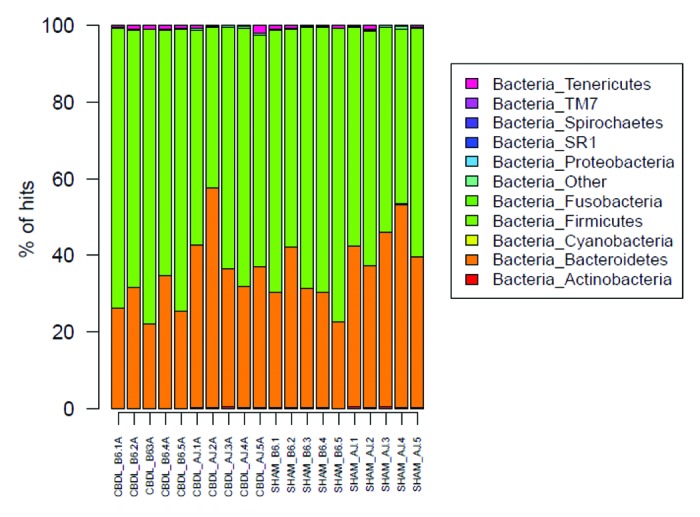
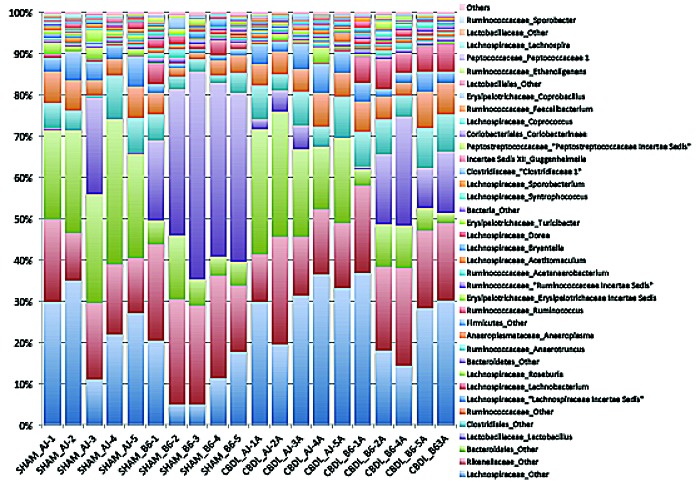
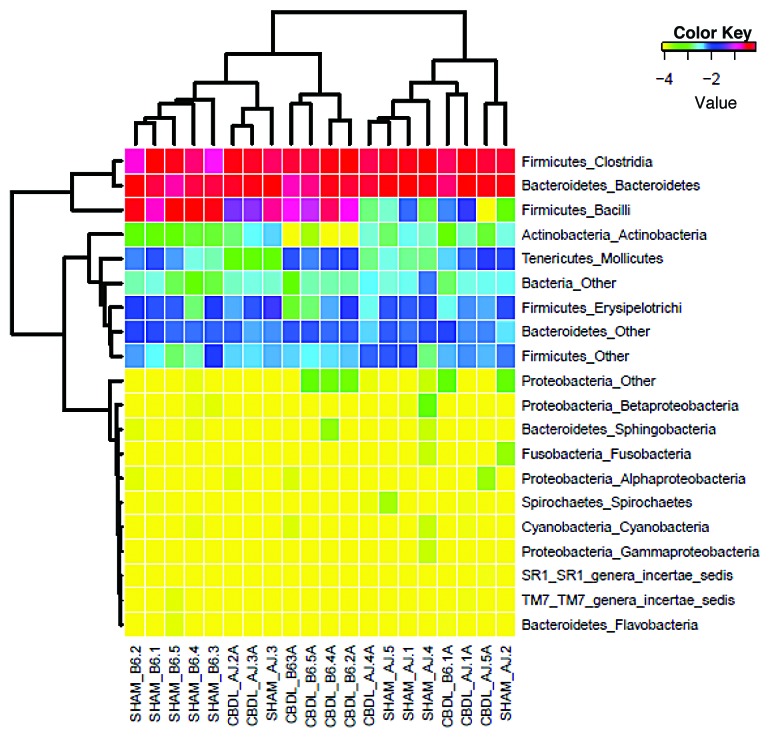
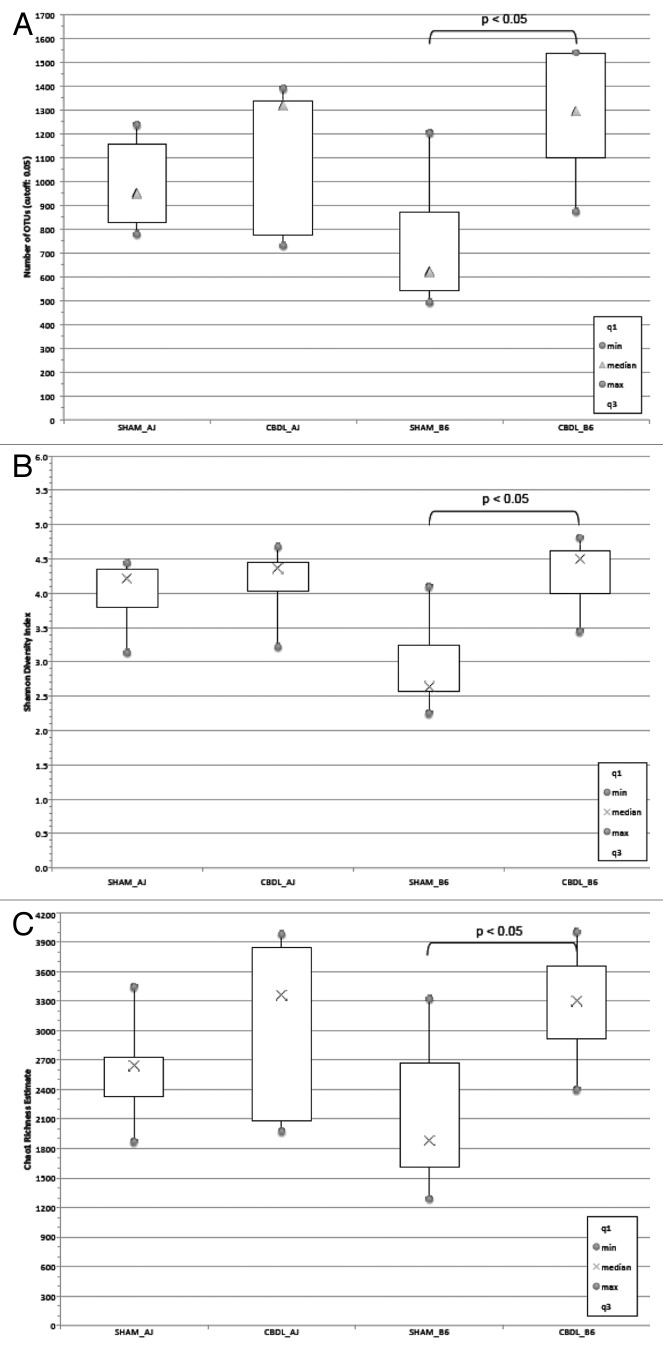
Failure of the intestinal barrier is a characteristic feature of cholestasis. We have previously observed higher mortality in C57BL/6J compared with A/J mice following common bile duct ligation (CBDL). We hypothesized the alteration in gut barrier function following cholestasis would vary by genetic background. Following one week of CBDL, jejunal TEER was significantly reduced in each ligated mouse compared with their sham counterparts; moreover, jejunal TEER was significantly lower in both sham and ligated C57BL/6J compared with sham and ligated A/J mice, respectively. Bacterial translocation to mesenteric lymph nodes was significantly increased in C57BL/6J mice vs. A/J mice. Four of 15 C57BL/6J mice were bacteremic; whereas, none of the 17 A/J mice were. Jejunal IFN-γ mRNA expression was significantly elevated in C57BL/6J compared with A/J mice. Western blot analysis demonstrated a significant decrease in occludin protein expression in C57BL/6J compared with A/J mice following both sham operation and CBDL. Only C57BL/6J mice demonstrated a marked decrease in ZO-1 protein expression following CBDL compared with shams. Pyrosequencing of the 16S rRNA gene in fecal samples showed a dysbiosis only in C57BL/6J mice following CBDL when compared with shams. This study provides evidence of strain differences in gut microbiota, tight junction protein expression, intestinal resistance and bacterial translocation which supports the notion of a genetic predisposition to exaggerated injury following cholestasis.

Keywords: bacterial translocation; bile duct ligation; cholestasis; interferon-gamma; intestinal microbiota; transepithelial electric resistance.


Figures

None
Figure 1.(A) Transepithelial electrical resistance (TEER) was measured ex vivo in jejunal specimens from sham and ligated A/J and B6 mice 7 d post-op. Measurements were taken at 30, 60, 90, 120 and 180 min following snapwell mounting. The epithelial permeability at 7 d was increased (TEER decreased) in B6 mice compared with A/J mice following sham operation (n = 8 sham A/J and 8 sham B6 mice). In addition, the epithelial permeability at seven days increased (TEER decreased) following CBDL in each strain (n = 8 CBDL A/J and 8 CBDL B6 mice). *p < 0.05 by ANOVA at every time point. (B) FITC-Dextran permeability assay results performed at the time of TEER confirm decreased intestinal barrier integrity in B6 mice compared with A/J mice, *p < 0.05. (C) Resistance calculated by Ussing chamber measurements confirm lower resistance in B6 mice compared with A/J mice, *p = 0.001.
None
Figure 2. RT-PCR analysis of intestinal specimens collected on postoperative day 7 from sham and ligated A/J and B6 mice. Jejunal mRNA expression of IL-12b, Cathepsin E, IFN-γ and TLR4 had significant findings. Please note that for A through E, the bar graphs provide four different comparisons of two bars each. For each pair of bars, the bar on the right has been normalized with respect to the bar on the left, which has been assigned a value of 1. (A) For IL-12b, there was a significant increase in ligated B6 mice compared with sham B6 mice. (B) For Cathepsin E, there was significantly greater expression in A/J sham mice compared with B6 sham mice. This difference disappeared following ligation. (C) IFN-γ mRNA expression was significantly elevated in both B6 sham and ligated mice compared with their A/J counterparts, *p < 0.05. (D) For TLR4, there was significantly less expression in ligated B6 mice compared with ligated A/J mice. n = 5 mice in each of four groups. (E) For FXR, there was no significant difference in jejunal expression between strains or following ligation. (F) FXR expression in the ileum did not vary between strains.
None
Figure 3. Jejunal tight junction protein mRNA expression in A/J and B6 mice 1 week following a sham or CBDL operation. Claudin-2 mRNA expression was increased in the B6 mice compared with the A/J mice; whereas, occludin mRNA expression was decreased in both strains following CBDL. No change was noted in TJP-1 (ZO-1) mRNA expression. n = 5 in each of four groups.
None
Figure 4. Tight junction protein expression by western blot analysis. Note each lane represents tissue from a separate mouse. (A) Occludin protein expression appeared decreased in B6 mice compared with A/J mice; however, densitometry showed only a trend when comparing shams (p = 0.10). (B) Following CBDL, ZO-1 protein expression was significantly decreased in B6 mice (*p < 0.0002) but not A/J mice. (C) Claudin-1 protein expression decreased significantly (*p < 0.02) in B6 but not A/J mice following CBDL. (D) Interestingly, claudin-2 protein expression was significantly decreased in B6 sham mice compared with A/J sham mice (*p < 0.05). There was a trend toward decreased claudin-2 expression in B6 CBDL mice compared with A/J CBDL mice (p = 0.09).
None
Figure 5. Survival graph following CBDL in IFN-γ −/− (C57BL/6J background) (n = 10) and wild-type C57BL/6J (B6) (n = 10) mice. No significant difference in mortality was found at any time point out to four weeks.
None
Figure 6. Rarefraction curves for fecal microbiota collected from sham and ligated A/J and B6 mice (n = 5 mice for each of four groups). The number of species is plotted against the number of samples analyzed.
None
Figure 7. Principal Coordinates Analysis (PCoA) plot of fecal microbiota collected from sham and ligated A/J and B6 mice (n = 5 mice for each of four groups). This analysis enables visualization of similarities of the microbiota data. Three separate clusters can be seen: ligated B6 mice, sham B6 mice and A/J mice (both sham and ligated).
None
Figure 8. Bar graph of phyla for fecal microbiota from sham and ligated A/J and B6 mice (n = 5 mice for each of four groups). Firmicutes and Bacteroidetes dominate the phyla of both strains; however, note the increased Firmicutes:Bacteroidetes ratio in the B6 as compared with the A/J mice.
None
Figure 9. Bar Graph of genera for fecal microbiota collected from sham and ligated A/J and B6 mice (n = 5 mice for each of four groups). Note the decrease in Lactobacillus (first purple bar from the bottom) and increase in Clostridiales (blue bar directly above first purple bar from the bottom) in ligated B6 mice as compared with sham B6 mice. This signifies a transition from a more benign to a more virulent microbiota.
None
Figure 10. Heat map of classes of fecal microbiota collected from sham and ligated A/J and B6 mice (n = 5 mice for each of four groups). Firmicutes and Bacteroidetes dominate, as shown in red, but note the small increase in Proteobacteria following CBDL which was found in four of five B6 mice. This increase was not found in any of the ligated A/J mice.
None
Figure 11. Diversity and richness of fecal Microbiota in sham and ligated A/J and B6 mice (n = 5 mice for each of four groups). (A) Sobs analysis of number of observed OTUs in A/J and B6 mice following Sham and CBDL procedures. Note that the number of fecal OTUs increases significantly in the B6 mice following CBDL as compared with shams, p < 0.05. There is no significant difference in the number of fecal OTUs in the A/J mice following CBDL as compared with shams. (B) Shannon Diversity Index Analysis of A/J and B6 mice following sham and CBDL procedures. The B6 mice significantly increased their fecal bacterial diversity following CBDL compared with shams, p < 0.05. No significant difference was found in the A/J mice. (C) Chao1 richness estimate analysis of A/J and B6 mice following sham and CBDL procedures. B6 mice had a significantly elevated richness estimate of their fecal bacteria following CBDL compared with shams, p < 0.05. No significant difference was found in the A/J mice.

References

    1. De Maio A, Torres MB, Reeves RH. Genetic determinants influencing the response to injury, inflammation, and sepsis. Shock. 2005;23:11–7. doi: 10.1097/01.shk.0000144134.03598.c5. - DOI - PubMed
    1. De Maio A, Mooney ML, Matesic LE, Paidas CN, Reeves RH. Genetic component in the inflammatory response induced by bacterial lipopolysaccharide. Shock. 1998;10:319–23. doi: 10.1097/00024382-199811000-00002. - DOI - PubMed
    1. Stewart D, Fulton WB, Wilson C, Monitto CL, Paidas CN, Reeves RH, et al. Genetic contribution to the septic response in a mouse model. Shock. 2002;18:342–7. doi: 10.1097/00024382-200210000-00009. - DOI - PubMed
    1. Nishikawa F, Yoshikawa S, Harada H, Kita M, Kita E. The full expression of the ity phenotype in ityr mice requires C3 activation by Salmonella lipopolysaccharide. Immunology. 1998;95:640–7. doi: 10.1046/j.1365-2567.1998.00647.x. - DOI - PMC - PubMed
    1. Banus HA, Vandebriel RJ, de Ruiter H, Dormans JA, Nagelkerke NJ, Mooi FR, et al. Host genetics of Bordetella pertussis infection in mice: significance of Toll-like receptor 4 in genetic susceptibility and pathobiology. Infect Immun. 2006;74:2596–605. doi: 10.1128/IAI.74.5.2596-2605.2006. - DOI - PMC - PubMed

Publication types

Substances