. 2013 Jun 14;288(24):17713-24.
doi: 10.1074/jbc.M112.445403. Epub 2013 May 7.

Exosome uptake depends on ERK1/2-heat shock protein 27 signaling and lipid Raft-mediated endocytosis negatively regulated by caveolin-1

Affiliations

Exosome uptake depends on ERK1/2-heat shock protein 27 signaling and lipid Raft-mediated endocytosis negatively regulated by caveolin-1

Katrin J Svensson et al. J Biol Chem. .

Abstract

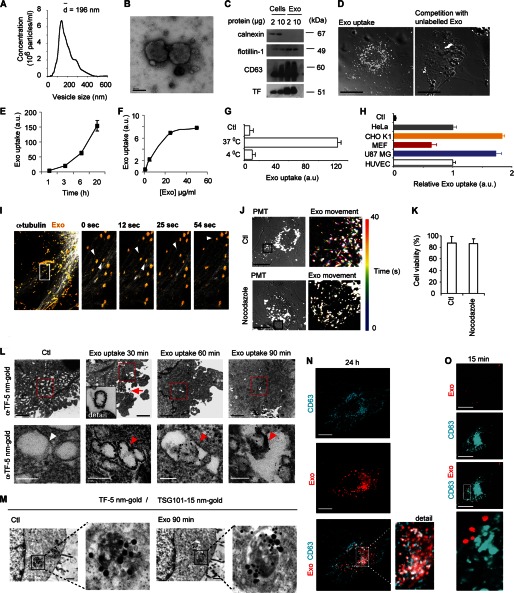
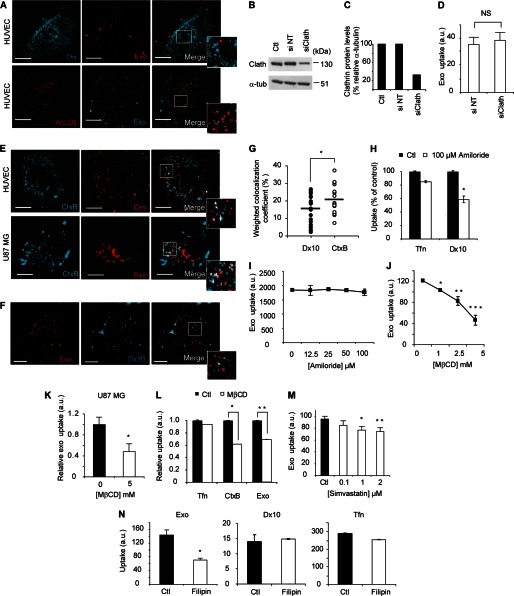
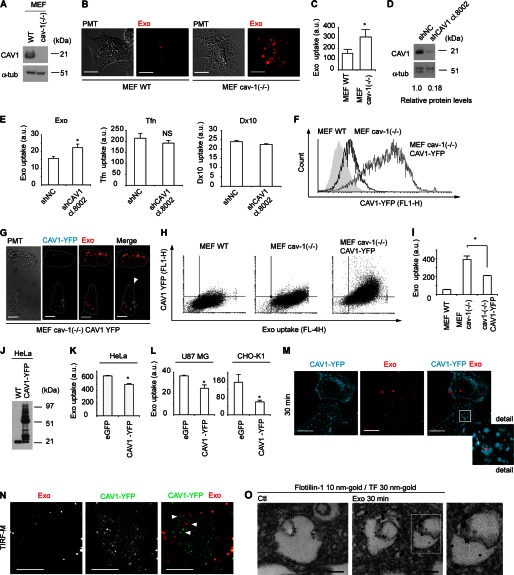
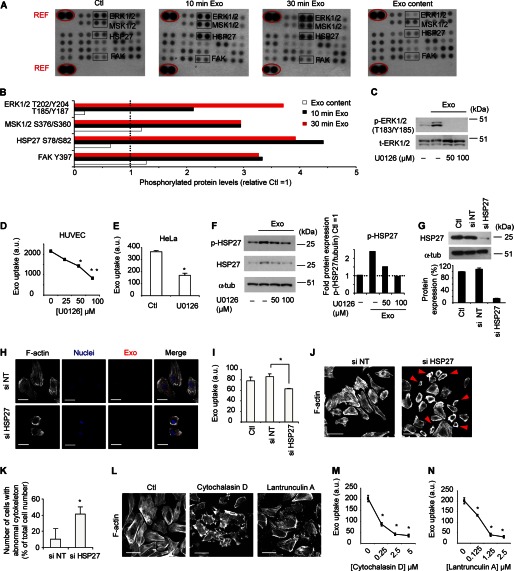
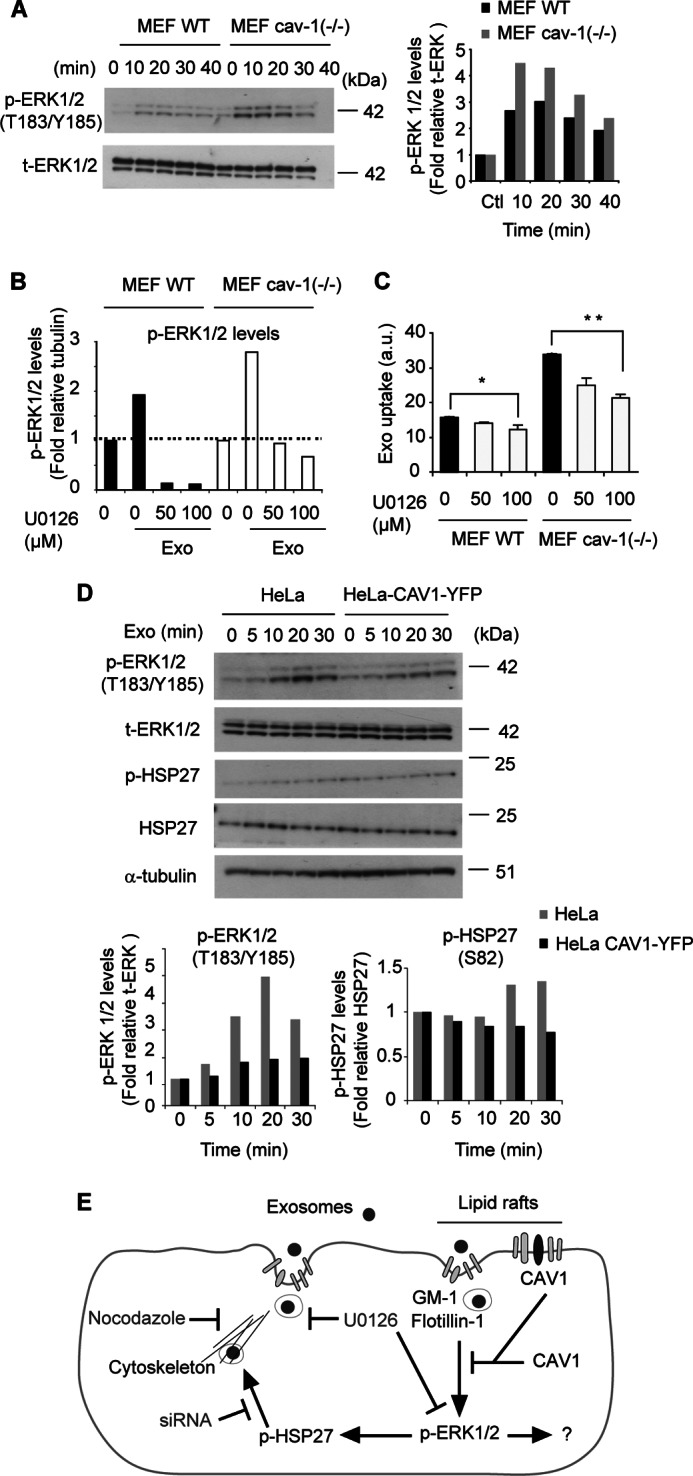
The role of exosomes in cancer can be inferred from the observation that they transfer tumor cell derived genetic material and signaling proteins, resulting in e.g. increased tumor angiogenesis and metastasis. However, the membrane transport mechanisms and the signaling events involved in the uptake of these virus-like particles remain ill-defined. We now report that internalization of exosomes derived from glioblastoma (GBM) cells involves nonclassical, lipid raft-dependent endocytosis. Importantly, we show that the lipid raft-associated protein caveolin-1 (CAV1), in analogy with its previously described role in virus uptake, negatively regulates the uptake of exosomes. We find that exosomes induce the phosphorylation of several downstream targets known to associate with lipid rafts as signaling and sorting platforms, such as extracellular signal-regulated kinase-1/2 (ERK1/2) and heat shock protein 27 (HSP27). Interestingly, exosome uptake appears dependent on unperturbed ERK1/2-HSP27 signaling, and ERK1/2 phosphorylation is under negative influence by CAV1 during internalization of exosomes. These findings significantly advance our general understanding of exosome-mediated uptake and offer potential strategies for how this pathway may be targeted through modulation of CAV1 expression and ERK1/2 signaling.

Keywords: Caveolin; Endocytosis; Exosomes; Glioblastoma; Microvesicles; Vesicles.


Figures

FIGURE 1.
FIGURE 1.
Endocytosis of GBM cell-derived exosome-like extracellular vesicles. A, characterization of U87 MG-derived vesicles by nanoparticle tracking analysis. B, electron microscopy validates intact vesicles. Scale bar, 100 nm. C, immunoblot analysis of cells and exosome-like vesicles for the exosomal markers CD63, TF, and flotillin-1, and the ER marker calnexin. D, confocal microscopy analysis of exosome uptake in the absence or presence of an excess (×4) unlabeled exosomes. Scale bars, 15 μm. E and F, time (E), and concentration (F)-dependent uptake of exosomes using flow cytometry analysis. G, insignificant passive uptake of exosomes at 4 °C. H, exosome uptake in human cervix adenocarcinoma cells (HeLa), chinese hamster ovary cells (CHO K1), mouse embryonic fibroblasts (MEF), U87 MG and HUVEC cells (n = 3). Values are normalized to HUVEC ( = 1). Control (Ctl) represents cells without exosomes. Flow cytometry graphs represent mean fluorescent values of one of two representative experiments generating similar results, error bars are ± S.D.; a.u., arbitrary units. I, exosomes move along microtubule tracks. COS-7 cells were transfected with pIRESneo-EGFP-α-tubulin 24 h prior to the addition of PKH26 labeled exosomes for an additional 16 h. Movie sequences display (4 boxed individual images, 0 s, 12 s, 25 s, 54 s) of exosome transport (yellow) along microtubule (white). Arrowheads depict intracellular, motile exosomes. Images were captured using a C-Apochromat 20X/0.8 M27 objective, 4.0 zoom, pinhole setting of 31 μm and laser gains of 5.5% (561 nm) and 5% (488 nm). Image size was x:512, y:512, and images were captured during 2 min and 11 s. Scale bar, 20 μm. For full-length movie, see supplemental video S2. J, reduced exosome transport in HUVECs treated for 10 min with 10 μg/ml nocodazole (lower panels) compared with Control (no treatment, upper panels). Pictures shown (Exo movement) represent color-coded data from time series of exosome movement in an overlay in which every time point (during 40 s) corresponds to a color. Images were captured using a C-Apochromat 63X/1.20W korr M27 objective (zoom 3.6). Scale bars, 50 μm. For full-length movies, see supplemental videos S3 and S4. K, cell viability is intact as measured by trypan blue exclusion after 10 min of nocodazole (10 μg/ml) treatment. L, electron microscopy images of compartments with internalized tissue factor (TF)-bearing exosomes over time. Low magnification overviews (upper panels, scale bars, 100 μm) confirm the intracellular localization of exosomes, and cropped pictures (lower panels, scale bars, 100 nm) demonstrate intraluminal vesicles (red arrowheads) positive for α-TF 5 nm gold particles. Note that endogenous vesicular structures in HUVECs are negative for TF (lower left panel, white arrowhead). M, electron microscopy colocalization studies in HUVECs of GBM cell-derived exosomes detected by α-TF 5 nm gold particles and MVBs distinguished by anti-TSG101 15 nm gold particles (scale bars, 100 μm). Ctl: no addition of exosomes. N–O, exosomes reside in a CD63-positive compartment after long-term incubation (24 h) but do not colocalize with CD63 at the cell surface. U87MG cells stably expressing CD63-mCherry (N) or transiently transfected with CD63-GFP (O) were incubated with PKH-labeled exosomes for the indicated time periods. Cells were washed in 1 m NaCl and PBS to remove nonspecifically bound exosomes before fixation and confocal microscopy analysis. CD63 (turquoise) and internalized exosomes (red) were captured at the indicated time points. Scale bars, 15 μm.
FIGURE 2.
FIGURE 2.
Endocytic uptake of exosomes requires intact lipid membrane rafts. A, confocal microscopy analysis shows no colocalization of Tfn (turquoise, upper panel) or AcLDL (red, lower panel) with exosomes (red/turquoise) at 30 min. Scale bars, 15 μm. B, knockdown validation of clathrin heavy chain using siRNA against clathrin (si Clath) as compared with negative control sequence (si NT) and normalized to α-tubulin (C). D, flow cytometry analysis of exosome uptake shows no difference in si Clath as compared with si NT-transfected cells. E, confocal microscopy analysis shows colocalization of CtxB (turquoise) and exosomes (red) at 30 min of uptake in HUVECs (upper panel) and U87 MG cells (lower panel). Scale bars, 15 μm. F, confocal microscopy analysis shows limited colocalization of Dx10 (turquoise) and exosomes (red) at 30 min of uptake in HUVECs. Scale bars, 15 μm. G, weighted colocalization coefficients display 20% (mean value) colocalization of CtxB and exosomes, and ∼15% for exosomes and 10 kDa dextran (Dx10). Colocalization coefficients were calculated (Dx10/exosomes, n = 23 cells; CtxB/exosomes, n = 22 cells) using Zeiss Zen software. *, p = 0.0182. All images were captured using a C-Apochromat 63X/1.20W korr M27 objective using laser gain of 6.0% in both lasers. H, macropinocytosis inhibitor amiloride (100 μm) decreases Dx10uptake (*, p = 0.01) while Tfn uptake is less affected. I, amiloride has no significant effect on exosome uptake at a wide range of concentrations. J and K, cholesterol-depleting drug MβCD dose-dependently inhibits exosome uptake. J, HUVECs (p values, *, 0.005, **, 0.0023, ***, 0.0008); K, U87 MG cells (*, p = 0.068). L, uptake of Tfn is not affected by MβCD (2.5 mm), while CtxB and exosome uptake are reduced, suggesting specific inhibition of lipid raft-dependent uptake (p values, *, 0.0006, **, 0.02). M, simvastatin dose-dependently inhibits exosome uptake (p values, *, 0.014, **, 0.011). N, sequestration of lipid rafts by filipin III substantially inhibits exosome uptake (left panel) while Dx10 (middle panel) and Tfn (right panel) uptake are less affected (*, p = 0.001). Presented graphs show mean fluorescent values (10,000 events/sample) of one of three representative experiments (n = 3) with similar results ± S.D.
FIGURE 3.
FIGURE 3.
Exosome internalization is negatively regulated by CAV1. A, mouse embryonic fibroblasts from wild-type (MEF WT) and cav-1 knock-out mice (MEF cav-1(−/−)) were analyzed for CAV1 protein. B, confocal images show elevated uptake of exosomes (red) in MEF cav-1 (−/−) as compared with MEF WT cells. Scale bars, 15 μm. C, graph shows quantitative measurement of exosome uptake in MEF WT and MEF cav-1 (−/−) cells by flow cytometry, and represents mean fluorescent values (20,000 events/sample) of three independent experiments (n = 9) ± S.D. (*, p = 0.000003). D, stable knockdown (by ∼80%) of CAV1 by lentiviral shRNA transduction in U87 MG cells. E, flow cytometry analysis demonstrates increased exosome uptake (left panel), no significant difference in Tfn uptake (middle panel), and decreased uptake of Dx10 (right panel) in CAV1 shRNA cells, as compared with cells transfected with control shRNA (shRNA NC). Graph represents mean fluorescent values (20,000 events/sample) of one of three representative experiments (n = 4) ± S.D. (*, p = 0.0019 in left panel). F, flow cytometry analysis of CAV1-YFP transfection efficiency; MEF WT (gray area), MEF cav-1 (−/−) (black line), and MEF cav-1 (−/−) cells transfected with pEX_EF1_CAV1-YFP plasmid (gray line). G, introduction of CAV1-YFP in MEF cav-1 (−/−) cells (YFP, turquoise) reduces uptake of exosomes (red). Note that the high CAV1-YFP-expressing cell (arrowhead) displays reduced exosome uptake as compared with the low CAV1-YFP expressing cell. Scale bars, 15 μm. H, dot plot analysis of exosome uptake versus CAV1-YFP expression in MEF cells, as indicated. I, quantification of the uptake in H. Graph represents mean fluorescent values (20,000 events/sample) of a representative experiment (n = 4) ± S.D. (*, p = 0.0009). J, immunoblotting for CAV1 in HeLa cells stably transfected with CAV1-YFP. K, reduced uptake of exosomes in CAV1 overexpressing HeLa cells as compared with HeLa WT cells. L, reduced uptake of exosomes in transiently CAV1 overexpressing U87 MG cells (left panel) and CHO-K1 cells (right panel) as compared with control cells transiently transfected with eGFP. Graph represents mean fluorescent values (20,000 events/sample) of one out of two independent experiments (n = 3) ± S.D. (*, p = 0.018). M, no colocalization between CAV1-YFP (turquoise) and exosomes (red) using confocal microscopy analysis. Scale bars, 15 μm. N, no colocalization between CAV1-YFP (green) and exosomes (red) using TIRF microscopy analysis. Scale bars, 10 μm. O, electron microscopy colocalization studies in HUVECs of exosomes detected by α-TF 30 nm gold particles and lipid rafts distinguished by anti-flotillin-1 10 nm gold particles. Scale bars, 100 μm. Left panel: Ctl, no addition of exosomes.
FIGURE 4.
FIGURE 4.
Exosome internalization depends on ERK1/2 and HSP27 signaling activation and an intact cytoskeleton. A, levels of phosphorylated kinases in HUVECs with no treatment (Ctl), or incubated with exosomes for 10 min (10 min Exo) or 30 min (30 min Exo). As a comparison, same protein amount of exosomes was used to visualize phosphoproteins residing in exosomes (Exo content). B, quantification of the mean value (n = 2 in each blot) of p-ERK1/2, p-MSK1/2, p-HSP27, and p-FAK relative unstimulated cells (Ctl). C, relative protein levels of p-ERK1/2 with or without exosome stimulation in the absence or presence of U0126. D, reduced exosome uptake in HUVECs treated with U0126. Graphs represents mean fluorescent values (20,000 events/sample) of one of three independent experiments (n = 3) (*, p = 0.01, **, p = 0.002) ± S.D. E, reduced exosome uptake in HeLa cells treated with U0126, expressed as mean fluorescent values (20,000 events/sample) of one of two independent experiments (n = 4) (*, p = 0.000009) ± S.D. F, induction of p-HSP27 protein by exosomes is counteracted by ERK1/2 inhibition using U0126. G, representative blot of relative HSP27 protein expression after siRNA knockdown. H, reduced exosome (red) uptake in HSP27 knockdown cells. White, f-actin; blue, nuclei. Scale bars, 15 μm. I, flow cytometry analysis of cells in H from a representative experiment (n = 4) (*, p = 0.002) ± S.D. J, actin cytoskeleton phalloidin stainings in HSP27 siRNA and siRNA NT-transfected cells. Note the abnormal cytoskeleton in siHSP27-transfected cells (right panel, red arrowheads). Scale bars, 100 μm. K, quantification of the average number of cells with abnormal cytoskeleton relative the total number of cells counted in seven independent microscopic fields; siNT cells (n = 116) and siHSP27 knockdown cells (n = 209). Data are mean values ± S.D. (*, p = 0.00018). L, disruption of the actin cytoskeleton (f-actin, white) using 0.5 μm Cytochalasin D or Lantrunculin A. Scale bars, 100 μm. M and N, exosome uptake in cells treated with varying concentrations of Cytochalasin D (M) or Lantrunculin A (N). Graphs are mean fluorescent values (10,000 events/sample) of two independent experiments with similar results ± S.D. All values (*) were significantly different from control (0 μm) with a p value of < 0.0001.
FIGURE 5.
FIGURE 5.
CAV1 negatively regulates ERK1/2-dependent endocytosis of exosomes. A, shown is a representative blot for p-ERK1/2 and total ERK1/2 (t-ERK1/2) in MEF WT and MEF cav-1 (−/−) cells stimulated with exosomes for the indicated times (left panel), and quantification of relative protein levels (right panel). B, reversal of exosome-mediated induction of p-ERK1/2 by U0126 in MEF cells. Graph shows quantification of Western blot analysis. C, up-regulation of exosome uptake in CAV1-deficient cells is counteracted by ERK1/2 inhibition. Graph represents mean fluorescent values (20,000 events/sample) of one of three independent experiments with similar results ± S.D. *, p = 0.02, **, p = 0.00001. D, overexpression of CAV1-YFP suppresses exosome-mediated induction of p-ERK1/2 and p-HSP27 in HeLa cells. Shown are representative blots for p-ERK1/2, t-ERK1/2, p-HSP27, total HSP27, and tubulin (upper panel), and quantification of relative protein levels (lower panel) in HeLa WT and CAV1-YFP cells stimulated with exosomes for the indicated times. E, schematic figure of the major findings of the present work. Exosomes are internalized by lipid raft-associated endocytosis, which is under negative control by CAV1. Additional signaling proteins involved are ERK1/2 and HSP27, and probably additional ERK1/2 downstream targets. HSP27 is known to be involved in rearrangement of the actin cytoskeleton important for the invagination of the plasma membrane during endocytosis.

References

    1. Damm E. M., Pelkmans L., Kartenbeck J., Mezzacasa A., Kurzchalia T., Helenius A. (2005) Clathrin- and caveolin-1-independent endocytosis: entry of simian virus 40 into cells devoid of caveolae. J. Cell Biol. 168, 477–488 - PMC - PubMed
    1. Doherty G. J., McMahon H. T. (2009) Mechanisms of endocytosis. Annu. Rev. Biochem. 78, 857–902 - PubMed
    1. Parton R. G., Richards A. A. (2003) Lipid rafts and caveolae as portals for endocytosis: new insights and common mechanisms. Traffic 4, 724–738 - PubMed
    1. Mayor S., Pagano R. E. (2007) Pathways of clathrin-independent endocytosis. Nat. Rev. Mol. Cell Biol. 8, 603–612 - PMC - PubMed
    1. Belting M., Wittrup A. (2008) Nanotubes, exosomes, and nucleic acid-binding peptides provide novel mechanisms of intercellular communication in eukaryotic cells: implications in health and disease. J. Cell Biol. 183, 1187–1191 - PMC - PubMed

Publication types

MeSH terms