

L-methionine placental uptake: characterization and modulation in gestational diabetes mellitus
- PMID: 23653387
- PMCID: PMC3817665
- DOI: 10.1177/1933719113488442
L-methionine placental uptake: characterization and modulation in gestational diabetes mellitus
Abstract
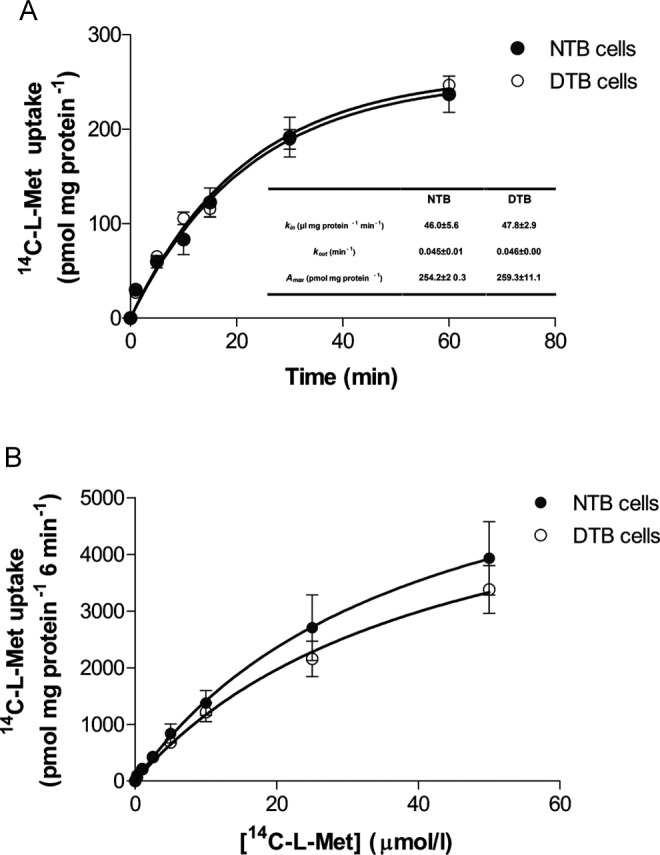
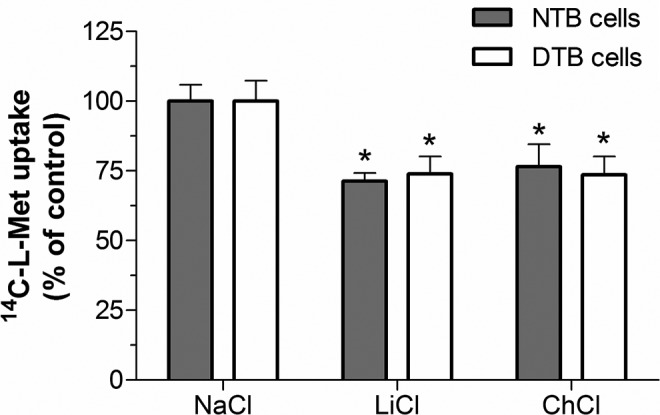
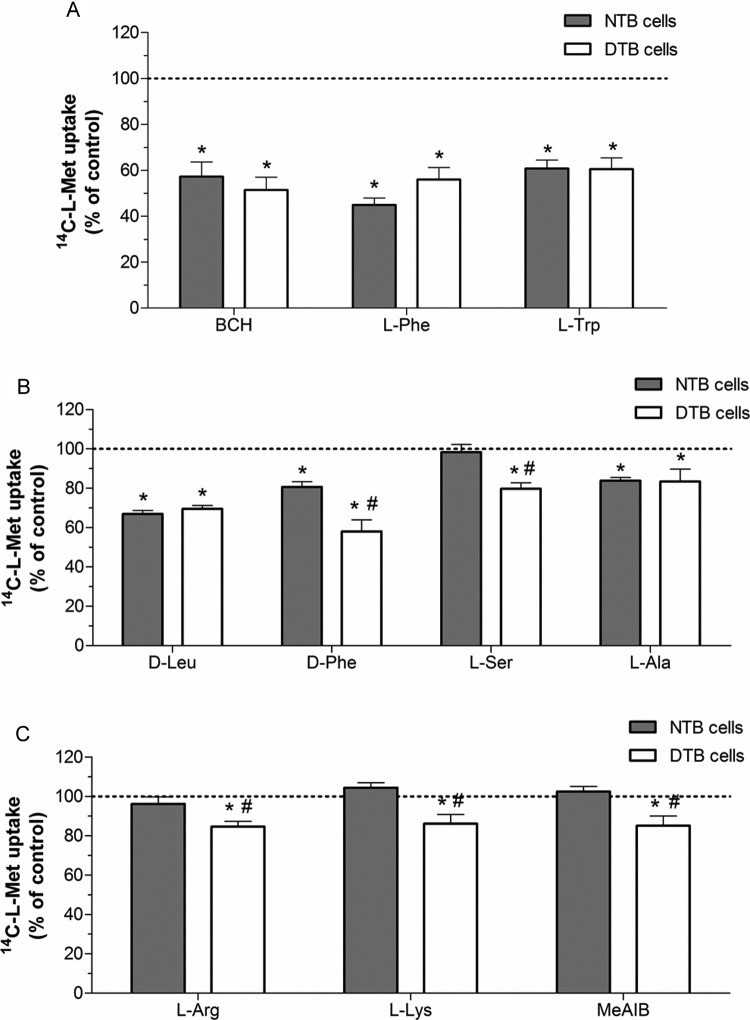
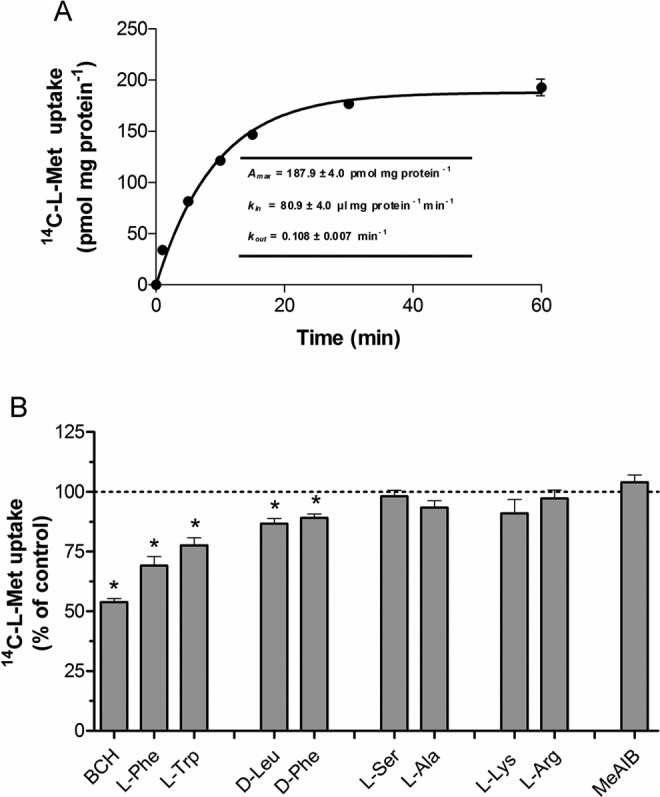
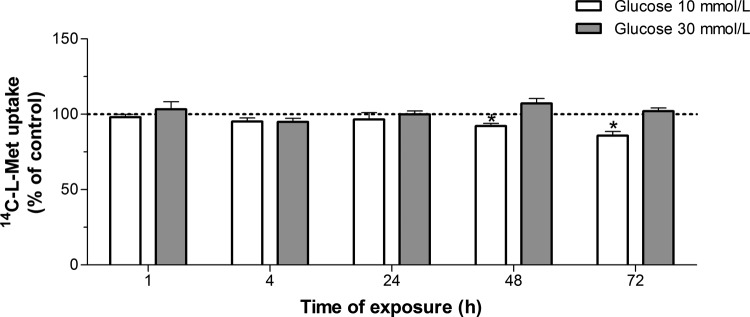
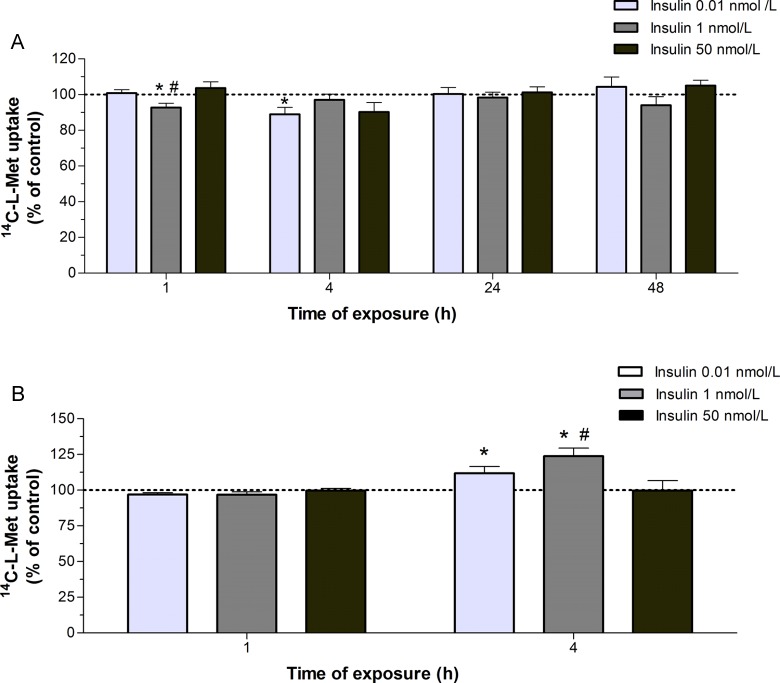
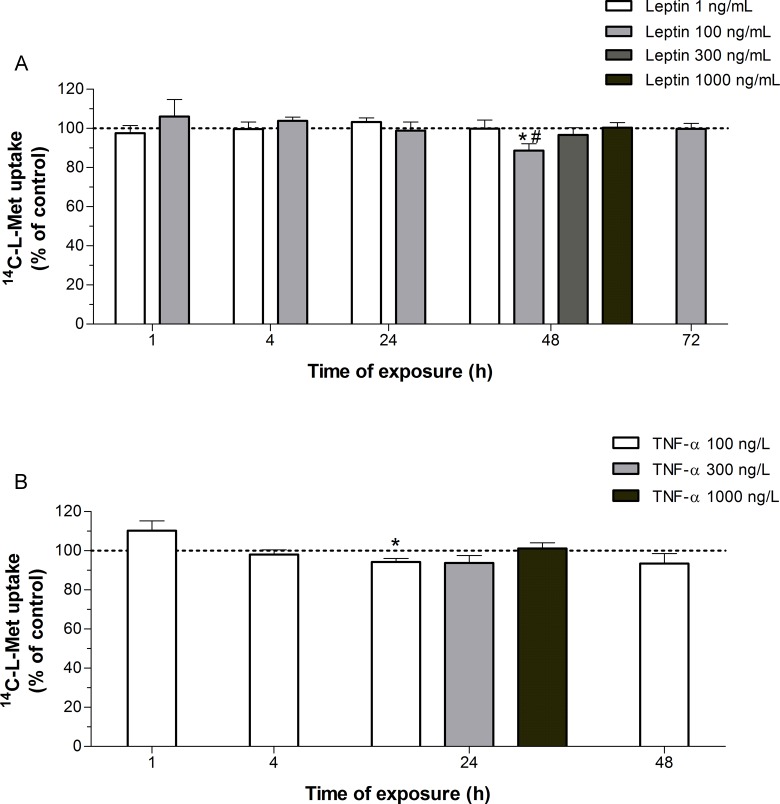
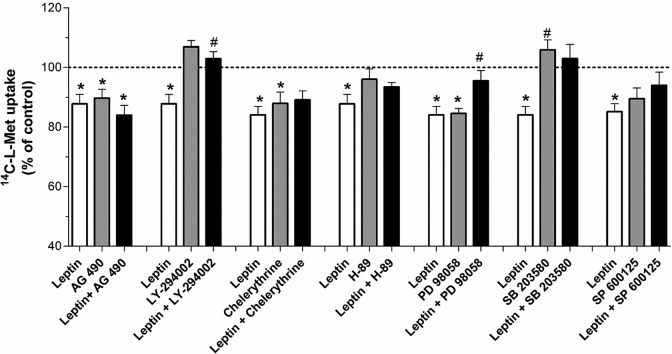
Our aim was to investigate the influence of gestational diabetes mellitus (GDM) and GDM-associated conditions upon the placental uptake of (14)C-l-methionine ((14)C-l-Met). The (14)C-l-Met uptake by human trophoblasts (TBs) obtained from normal pregnancies (normal trophoblast [NTB] cells) is mainly system l-type amino acid transporter 1 (LAT1 [L])-mediated, although a small contribution of system y(+)LAT2 is also present. Comparison of (14)C-l-Met uptake by NTB and by human TBs obtained from GDM pregnancies (diabetic trophoblast [DTB] cells) reveals similar kinetics, but a contribution of systems A, LAT2, and b(0+) and a greater contribution of system y(+)LAT1 appears to exist in DTB cells. Short-term exposure to insulin and long-term exposure to high glucose, tumor necrosis factor-α, and leptin decrease (14)C-l-Met uptake in a human TB (Bewo) cell line. The effect of leptin was dependent upon phosphoinositide 3-kinase, extracellular-signal-regulated kinase 1/2 (ERK/MEK 1/2), and p38 mitogen-activated protein kinase. In conclusion, GDM does not quantitatively alter (14)C-l-Met placental uptake, although it changes the nature of transporters involved in that process.
Keywords: l-methionine; gestational diabetes; placenta; transport.
Conflict of interest statement
Figures
Similar articles
-
Folic acid uptake by the human syncytiotrophoblast is affected by gestational diabetes, hyperleptinemia, and TNF-α.Pediatr Res. 2013 Apr;73(4 Pt 1):388-94. doi: 10.1038/pr.2013.14. Epub 2013 Jan 21. Pediatr Res. 2013. PMID: 23338599
-
Gestational diabetes mellitus decreases placental uptake of long-chain polyunsaturated fatty acids: involvement of long-chain acyl-CoA synthetase.J Nutr Biochem. 2013 Oct;24(10):1741-50. doi: 10.1016/j.jnutbio.2013.03.003. Epub 2013 Jun 18. J Nutr Biochem. 2013. PMID: 23790250
-
Small molecule inhibitors provide insights into the relevance of LAT1 and LAT2 in materno-foetal amino acid transport.J Cell Mol Med. 2020 Nov;24(21):12681-12693. doi: 10.1111/jcmm.15840. Epub 2020 Oct 1. J Cell Mol Med. 2020. PMID: 33001560 Free PMC article.
-
Overexpression of the LAT1 in primary human trophoblast cells increases the uptake of essential amino acids and activates mTOR signaling.Clin Sci (Lond). 2023 Nov 15;137(21):1651-1664. doi: 10.1042/CS20230490. Clin Sci (Lond). 2023. PMID: 37861075 Free PMC article.
-
Role of insulin, adenosine, and adipokine receptors in the foetoplacental vascular dysfunction in gestational diabetes mellitus.Biochim Biophys Acta Mol Basis Dis. 2020 Feb 1;1866(2):165370. doi: 10.1016/j.bbadis.2018.12.021. Epub 2019 Jan 17. Biochim Biophys Acta Mol Basis Dis. 2020. PMID: 30660686 Review.
Cited by
-
Identification of placental nutrient transporters associated with intrauterine growth restriction and pre-eclampsia.BMC Genomics. 2018 Mar 2;19(1):173. doi: 10.1186/s12864-018-4518-z. BMC Genomics. 2018. PMID: 29499643 Free PMC article.
-
Construction of a novel miRNA regulatory network and identification of target genes in gestational diabetes mellitus by integrated analysis.Front Genet. 2022 Dec 1;13:966296. doi: 10.3389/fgene.2022.966296. eCollection 2022. Front Genet. 2022. PMID: 36544488 Free PMC article.
-
Expression and functional characterisation of System L amino acid transporters in the human term placenta.Reprod Biol Endocrinol. 2015 Jun 9;13:57. doi: 10.1186/s12958-015-0054-8. Reprod Biol Endocrinol. 2015. PMID: 26050671 Free PMC article.
-
Impact of gestational diabetes mellitus in the maternal-to-fetal transport of nutrients.Curr Diab Rep. 2015 Feb;15(2):569. doi: 10.1007/s11892-014-0569-y. Curr Diab Rep. 2015. PMID: 25620402 Review.
-
Expression of nutrient transporters in placentas affected by gestational diabetes: role of leptin.Front Endocrinol (Lausanne). 2023 Jul 11;14:1172831. doi: 10.3389/fendo.2023.1172831. eCollection 2023. Front Endocrinol (Lausanne). 2023. PMID: 37497352 Free PMC article. Review.
References
-
- Fowden AL, Forhead AJ, Coan PM, Burton GJ. The placenta and intrauterine programming. J Neuroendocrinol. 2008;20(4):439–450. - PubMed
-
- Jansson N, Greenwood SL, Johansson BR, Powell TL, Jansson T. Leptin stimulates the activity of the system A amino acid transporter in human placental villous fragments. J Clin Endocrinol Metab. 2003;88(3):1205–1211. - PubMed
-
- Jansson T, Powell TL. Role of the placenta in fetal programming: underlying mechanisms and potential interventional approaches. Clin Sci (Lond). 2007;113(1):1–13. - PubMed
-
- Shoob HD, Sargent RG, Thompson SJ, Best RG, Drane JW, Tocharoen A. Dietary methionine is involved in the etiology of neural tube defect-affected pregnancies in humans. J Nutr. 2001;131(10):2653–2658. - PubMed
-
- Grillo MA, Lanza A, Colombatto S. Transport of amino acids through the placenta and their role. Amino Acids. 2008;34(4):517–523. - PubMed
Publication types
MeSH terms
Substances
LinkOut - more resources
Full Text Sources
Other Literature Sources
Medical
Research Materials
Miscellaneous
