. 2013 May 6:7:82.
doi: 10.3389/fncir.2013.00082. eCollection 2013.

Optogenetic elevation of endogenous glucocorticoid level in larval zebrafish

Affiliations

Optogenetic elevation of endogenous glucocorticoid level in larval zebrafish

Rodrigo J De Marco et al. Front Neural Circuits. .

Abstract

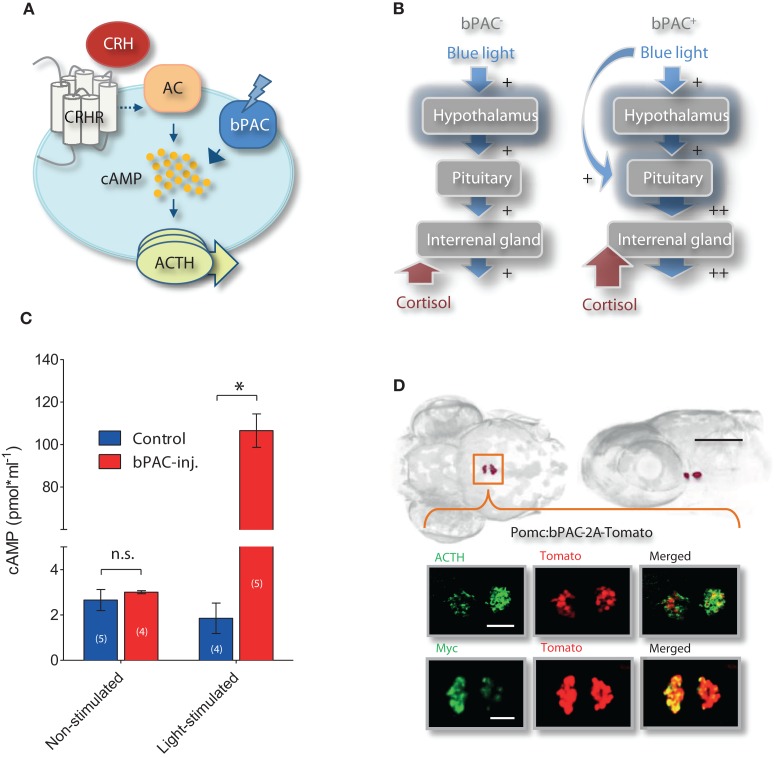
The stress response is a suite of physiological and behavioral processes that help to maintain or reestablish homeostasis. Central to the stress response is the hypothalamic-pituitary-adrenal (HPA) axis, as it releases crucial hormones in response to stress. Glucocorticoids (GCs) are the final effector hormones of the HPA axis, and exert a variety of actions under both basal and stress conditions. Despite their far-reaching importance for health, specific GC effects have been difficult to pin-down due to a lack of methods for selectively manipulating endogenous GC levels. Hence, in order to study stress-induced GC effects, we developed a novel optogenetic approach to selectively manipulate the rise of GCs triggered by stress. Using this approach, we could induce both transient hypercortisolic states and persistent forms of hypercortisolaemia in freely behaving larval zebrafish. Our results also established that transient hypercortisolism leads to enhanced locomotion shortly after stressor exposure. Altogether, we present a highly specific method for manipulating the gain of the stress axis with high temporal accuracy, altering endocrine and behavioral responses to stress as well as basal GC levels. Our study offers a powerful tool for the analysis of rapid (non-genomic) and delayed (genomic) GC effects on brain function and behavior, feedbacks within the stress axis and developmental programming by GCs.

Keywords: HPA axis; glucocorticoids; larval zebrafish; optogenetics; stress response.


Figures

Figure 1
Figure 1
A brief exposure to light is stressful for dark-adapted larvae. (A) Wild-type 6 dpf larval zebrafish display regular motion levels while swimming in darkness (overall mean ± S.E.M. shown as dotted line and gray background, respectively). (B) When dark-adapted for 15 min, 6 dpf larvae react to a 180 s squared pulse of either blue- (top) or yellow-light (bottom) with reduced locomotion after the light-onset followed by increased locomotion after the light-offset. Afterward, locomotion decreases gradually until it reaches steady-state levels tens of minutes later (light-power: 2.8 mW*cm−2; gray arrowheads indicate cortisol extraction times). (C) Such a brief exposure to either blue- or yellow-light increases whole-body cortisol level (lowercase letters indicate statistical differences among groups; sample size in parenthesis).
Figure 2
Figure 2
Optogenetic increase of the gain of the stress axis. (A) In pituitary corticotrophs, Beggiatoa photoactivated adenylyl cyclase (bPAC) is expected to amplify CRH signaling and ACTH release; CRHR, CRH receptor; AC, adenylyl cyclase. (B) We aimed to modify the gain of the HPI axis by targeting bPAC to pituitary corticotrophs. Based on this rationale, blue-light stimulation of bPAC is expected to enhance the increase in cAMP that is central to CRH signaling in corticotroph cells, thereby amplifying ACTH and subsequent cortisol release while preserving analogous levels of hypothalamus activation. According to this scheme, stress-induced over-elevation of cortisol would be varied by modifying the light-power and/or duration of the squared pulse of blue-light. (C) Blue-light dependent rise in whole-body cAMP level in 1 dpf larvae using bPAC RNA (asterisks indicate statistical difference between groups at p < 0.05). (D) Dorsal and lateral views of bPAC expression in two cell clusters in the pituitary of 6 day post fertilization (dpf) larvae (scale bar: 500 μm), as detected by fused tdTomato fluorescence; co-expression of ACTH and fluorescent tdTomato signal (top), and of myc-tag and tdTomato signal (bottom); scale bars: 50 μm.
Figure 3
Figure 3
Optogenetic elevation of stress-induced cortisol level. (A) A 180 s squared pulse of blue-light leads to higher cortisol levels in bPAC-positive larvae (bPAC+) as compared to their negative siblings (bPAC) (asterisks indicate statistical differences between groups at p < 0.05 or p < 0.01; sample size in parenthesis; the red and blue dashed lines depict significant non-linear regressions of cortisol vs. light-power for bPAC+ and bPAClarvae, respectively). Note that yellow-light fails to differentially enhance cortisol level in bPAC+ larvae. (B) Cortisol level in bPAC+ and bPAC larvae as a function of exposure time and light-power (asterisks indicate statistical differences between groups at p < 0.05, p < 0.01, or p < 0.001; sample size in parenthesis; Mean ± S.E.M. basal levels shown as dotted line and gray background, respectively).
Figure 4
Figure 4
Multiple light stimulations lead to hypercortisolic states in bPAC+ larvae. (A) Light-induced cortisol level decreases as a function of time in both bPAC+ and bPAC larvae (asterisks indicate statistical diff-erences between groups at p < 0.001; light-power: 1 mW*cm−2, exposure time: 180 s). (B) bPAC+ but not bPAC larvae respond to a sequence of three 180 s squared pulses of blue-light with increased cortisol levels (asterisks indicate statistical differences between groups at p < 0.01 or p < 0.001; light-power: 2.8 mW*cm−2; inter-trial interval: 30 min). (C) In the presence of the GR antagonist mifepristone (Mif), both bPAC+ and bPAC larvae respond to multiple light stimulations with increased cortisol levels, which are, on average, substantially higher than those from non-incubated larvae (asterisks indicate statistical differences between groups at p < 0.05 or p < 0.01; light-power: 2.8 mW*cm−2; inter-trial interval: 30 min). (B,C) Mean basal cortisol level ± S.E.M. shown as a dotted line and gray background, respectively; note that basal cortisol levels are comparatively higher in the Mif-incubated larvae.
Figure 5
Figure 5
Optogenetically elevated cortisol level leads to enhanced locomotion after stressor exposure. (A) Locomotor activity in bPAC+ (red squares) and bPAC larvae (blue squares) during and after a 180 s squared pulse of blue-light (shown as blue background) (light-power: 2.8 mW*cm−2; sample size in parenthesis). (B) In bPAC+ larvae, a 180 s squared pulse of blue-light, but not of yellow-light, leads to enhanced locomotion (measured over a 10 min period) after the light offset. In bPAC larvae, by contrast, neither blue- nor yellow-light influences locomotion after the light-offset (asterisks indicate statistical difference between groups at p < 0.05; light-power: 1 mW*cm−2; sample size in parenthesis; see Materials and Methods for details on motion calculations). (C) Over multiple light exposures, post-stimulation locomotion is higher in the bPAC+ larvae than in the bPAC larvae (asterisks indicate statistical difference between the groups at p < 0.01; light-power: 2.8 mW*cm−2; sample size in parenthesis). (D) Locomotion levels from bPAC+ and bPAC larvae plotted against corresponding cortisol levels; note how post-stimulation locomotion shows linear dependence of past cortisol levels.
Figure 6
Figure 6
Early blue-light stimulation causes long-term hypercortisolaemia in bPAC+ larvae. (A) bPAC+ (red squares) but not bPAC larvae (blue squares) show increased basal cortisol levels after having being exposed to multiple light stimulations over 2 consecutive days (asterisks indicate statistical difference between groups at p < 0.05; light-power: 0.6 mW*cm−2; sample size in parenthesis). (B) At 6 dpf, bPAC+ larvae (red squares) exposed to light stimulation at 4 and 5 dpf (early stim.) respond to a squared pulse of blue-light with higher cortisol levels as compared to either none-exposed bPAC+ (non-stim.) or exposed and non-exposed bPAC larvae (asterisks indicate statistical differences between groups at p < 0.05 or p < 0.01; light-power: 0.6 mW*cm−2; sample size in parenthesis). (A,B) Mean basal cortisol level ± S.E.M. of both bPAC+ and bPAC larvae shown as a dotted line and gray background, respectively.

Similar articles

Cited by

References

    1. Agulleiro M. J., Roy S., Sanchez E., Puchol S., Gallo-Payet N., Cerda-Reverter J. M. (2010). Role of melanocortin receptor accessory proteins in the function of zebrafish melanocortin receptor type 2. Mol. Cell. Endocrinol. 320, 145–152 10.1016/j.mce.2010.01.032 - DOI - PubMed
    1. Alderman S. L., Bernier N. J. (2009). Ontogeny of the corticotropin-releasing factor system in zebrafish. Gen. Comp. Endocrinol. 164, 61–69 10.1016/j.ygcen.2009.04.007 - DOI - PubMed
    1. Alsop D., Vijayan M. M. (2008). Development of the corticosteroid stress axis and receptor expression in zebrafish. Am. J. Physiol. Regul. Integr. Comp. Physiol. 294, R711–R719 10.1152/ajpregu.00671.2007 - DOI - PubMed
    1. Arzt E., Holsboer F. (2006). CRF signaling: molecular specificity for drug targeting in the CNS. Trends Pharmacol. Sci. 27, 531–538 10.1016/j.tips.2006.08.007 - DOI - PubMed
    1. Burgess H. A., Granato M. (2007). Modulation of locomotor activity in larval zebrafish during light adaptation. J. Exp. Biol. 210, 2526–2539 10.1242/jeb.003939 - DOI - PubMed

Publication types

Substances