. 2013 May 6:4:67.
doi: 10.3389/fmicb.2013.00067. eCollection 2013.

The YNP Metagenome Project: Environmental Parameters Responsible for Microbial Distribution in the Yellowstone Geothermal Ecosystem

Affiliations

The YNP Metagenome Project: Environmental Parameters Responsible for Microbial Distribution in the Yellowstone Geothermal Ecosystem

William P Inskeep et al. Front Microbiol. .

Abstract

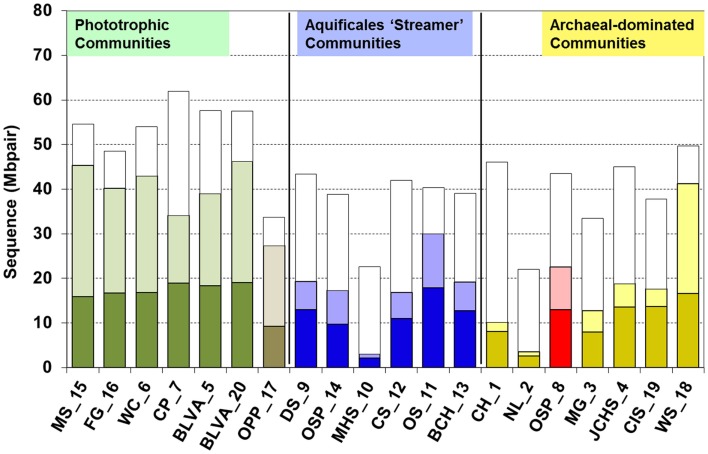
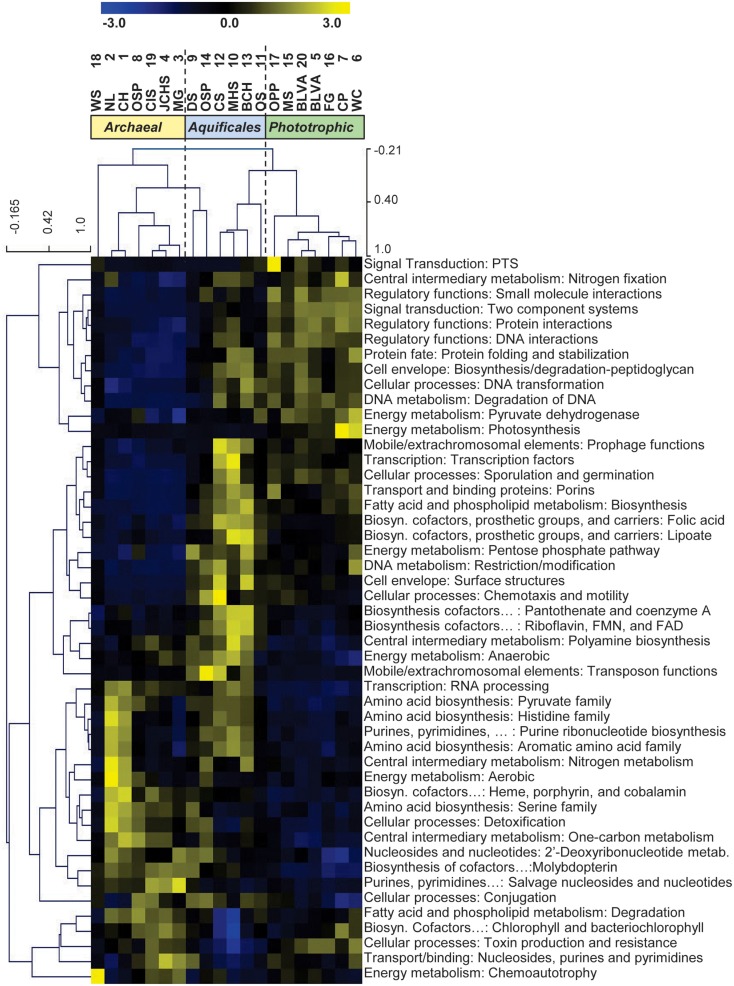
The Yellowstone geothermal complex contains over 10,000 diverse geothermal features that host numerous phylogenetically deeply rooted and poorly understood archaea, bacteria, and viruses. Microbial communities in high-temperature environments are generally less diverse than soil, marine, sediment, or lake habitats and therefore offer a tremendous opportunity for studying the structure and function of different model microbial communities using environmental metagenomics. One of the broader goals of this study was to establish linkages among microbial distribution, metabolic potential, and environmental variables. Twenty geochemically distinct geothermal ecosystems representing a broad spectrum of Yellowstone hot-spring environments were used for metagenomic and geochemical analysis and included approximately equal numbers of: (1) phototrophic mats, (2) "filamentous streamer" communities, and (3) archaeal-dominated sediments. The metagenomes were analyzed using a suite of complementary and integrative bioinformatic tools, including phylogenetic and functional analysis of both individual sequence reads and assemblies of predominant phylotypes. This volume identifies major environmental determinants of a large number of thermophilic microbial lineages, many of which have not been fully described in the literature nor previously cultivated to enable functional and genomic analyses. Moreover, protein family abundance comparisons and in-depth analyses of specific genes and metabolic pathways relevant to these hot-spring environments reveal hallmark signatures of metabolic capabilities that parallel the distribution of phylotypes across specific types of geochemical environments.

Keywords: functional genomics; geochemistry; microbial interactions; microbial mats; thermophiles.


Figures

Figure 1
Figure 1
Map of Yellowstone National Park (YNP) showing the locations of 20 geothermal sites sampled for metagenome and geochemical analysis (green = phototrophic sites; yellow/red = archaeal sites; blue = Aquificales “streamer” communities; gray = Obsidian Pool Prime; site numbers defined in Table 1). The dashed line represents the boundary of the most recent caldera.
Figure 2
Figure 2
Distribution of pH (A) and electrical conductivity (EC) (B) values across 7700 and 6450 geothermal features, respectively, cataloged in the Yellowstone Center for Resources (YCR) database (available on line via www.rcn.montana.edu). Vertical bars along pH and EC axes indicate values of the 20 sites described in the current study (Aquificales “streamer” communities = blue; archaeal-dominated sites = red; phototrophic mats = green). Ionic strengths ranging from ∼0.005–0.04 M are indicated with dashed lines (WS_18 has the highest EC in the study of ∼3.2 mmho/cm).
Figure 3
Figure 3
The thermophilic microbial communities included in the YNP Metagenome Project were separated into predominant habitat types using a decision-tree with four “nodes” or primary environmental factors: pH, temperature (°C), the presence or absence of dissolved sulfide and/or elemental S, and additional physiographic context (4a: SSMat = sub-surface sample obtained from laminated phototrophic mats; 4b: Flow = primary flow channel). Decision nodes are represented by brown squares, node output by blue rectangles, and decision endpoints by triangles (i.e., predominant habitat types, site numbers). Targeted habitat types: FAP = filamentous anoxygenic phototrophs, OP = oxygenic phototrophs, AP = anoxygenic phototrophs, AQ-Therm/Sulf/Hydro = Aquificales “streamer” communities dominated by one of three major Aquificales lineages (i.e., Thermocrinis, Sulfurihydrogenibium, Hydrogenobaculum); S-SED = bottom or suspended sulfur-rich sediments dominated by archaea; Fe-Oxide = Fe-oxyhydroxide microbial mat dominated by archaea. The bulk aqueous characteristics of OPP_17 place this sample closest to sites WC_6 and CP_7 in the decision-tree, however, this sample was collected from biofilm growth on a large glass plate (see text, Table 1).
Figure 4
Figure 4
Total amount of Sanger sequence (Mbpair) obtained for each site (top of open bars). The sum of assembled sequences (e.g., sum of all contig lengths) as well as that for all singleton sequences is shown as dark and light stacked bars, respectively [e.g., 62 Mbp of total sequence was obtained for CP_7, which resulted in 19 Mbp of assembled sequence (total contig length) and ∼14 Mbp of singleton sequences].
Figure 5
Figure 5
Principal components analysis of oligonucleotide word frequencies (i.e., k-mers) of assembled metagenome sequence data for each group of sites. (A) Phototrophic, (B) “Streamer,” and (C) Archaeal. Left Column: Assembled sequence data colored by site [Phototrophic Mats: BLVA_5, 20 = light-purple, dark-purple; WC_6 = light-blue; CP_7 = brown; MS_15 and FG_16 did not contain a significant number of contigs > 10,000 kb. “StreamerCommunities: DS_9 = yellow; OSP_14 = red; MHS_10 = green; CS_12 = violet; OS_11 = dark-blue; BCH_13 = light-blue. Archaeal Systems: CH_1 = gold; NL_2 = yellow; MG_3 = green; CIS_19 = light-blue; JCHS_4 = dark-blue; OSP_8 = red; OSP_14 = pink). Sites OPP_17 and WS_18 not included. Right Column: Phylogenetic assignment of sequence clusters (identical PCA orientation) based on comparative sequence analysis of all contigs to reference genomes (APIS, Badger et al., 2006).
Figure 6
Figure 6
Principal components analysis of normalized TIGRFAM protein family abundance data across all 20 sites. The three panels show pairwise plots of the first three principal components (PC1 and PC2 account for 80% of the variation across sites, while PC3 only represents ∼6%). The first and second components separate sites into the three main habitat types studied (site labels and color groups are described in Table 1).
Figure 7
Figure 7
Two-way hierarchical clustering of normalized TIGRFAM protein family abundance data averaged across intermediate-level TIGRFAM functional categories. The data was standardized (subtract mean and divide by standard deviation) across sites before clustering so that the color scale units are in standard deviations from the mean across sites. Yellow colors correspond to values that are higher than the site mean and blue colors to values that are lower than the mean.
Figure 8
Figure 8
Hierarchical clustering of metagenomes using relative TIGRFAM family abundances of genes in the TIGRFAM category “Electron Transport”. Note that the abundance data has not been standardized, but rather log2-transformed (absolute abundances are shown).

References

    1. Amend J. P., Rogers K. L., Shock E. L., Gurrieri S., Inguaggiato S. (2003). Energetics of chemolithotrophy in the hydrothermal system of Vulcano Island, southern Italy. Geobiology 1, 37–5810.1046/j.1472-4669.2003.00006.x - DOI
    1. Amend J. P., Shock E. L. (2001). Energetics of overall metabolic reactions of thermophilic and hyperthermophilic Archaea and Bacteria. FEMS Microbiol. Rev. 25, 175–24310.1111/j.1574-6976.2001.tb00576.x - DOI - PubMed
    1. Badger J. H., Hoover T. R., Brun Y. V., Weiner R. M., Laub M. T., Alexandre G., et al. (2006). Comparative genomic evidence for a close relationship between the dimorphic prosthecate bacteria Hyphomonas neptunium and Caulobacter crescentus. J. Bacteriol. 188, 6841–685010.1128/JB.00111-06 - DOI - PMC - PubMed
    1. Baker B. J., Tyson G. W., Webb R. I., Flanagan J., Hugenholtz P., Allen E. E., et al. (2006). Lineages of acidophilic archaea revealed by community genomic analysis. Science 314, 1933–193510.1126/science.314.5798.387a - DOI - PubMed
    1. Ball J. W., McCleskey R. B., Nordstrom D. K. (2010). Water-chemistry Data for Selected Springs, Geysers, and Streams in Yellowstone National Park, Wyoming, 2006-2008. U.S. Geological Survey Open-File Report 2010-1192, 109 Available at: http://pubs.usgs.gov/of/2010/1192/

LinkOut - more resources