. 2013 May;133(5):2803-17.
doi: 10.1121/1.4798666.

Latency of tone-burst-evoked auditory brain stem responses and otoacoustic emissions: level, frequency, and rise-time effects

Affiliations

Latency of tone-burst-evoked auditory brain stem responses and otoacoustic emissions: level, frequency, and rise-time effects

Daniel M Rasetshwane et al. J Acoust Soc Am. 2013 May.

Abstract

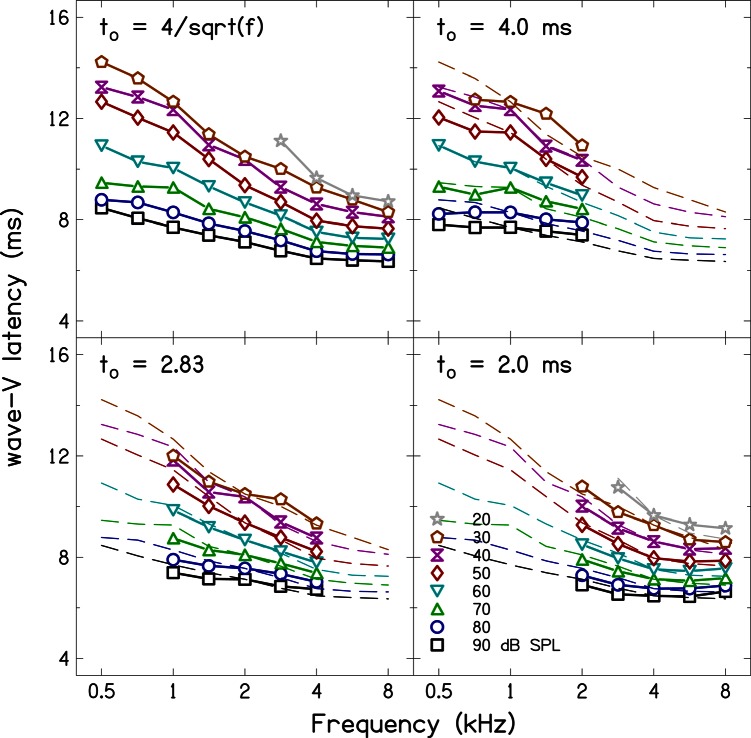
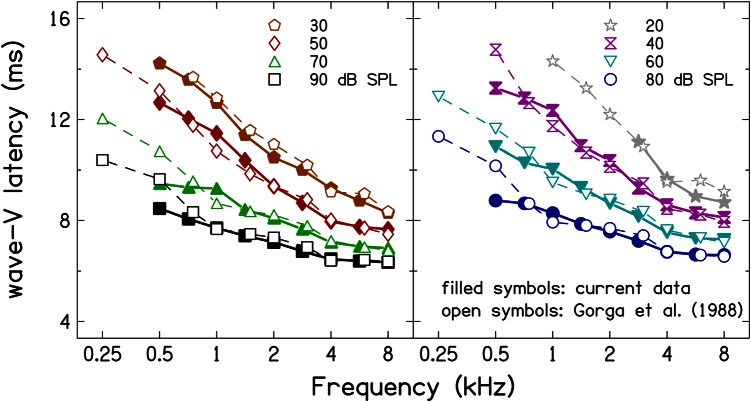
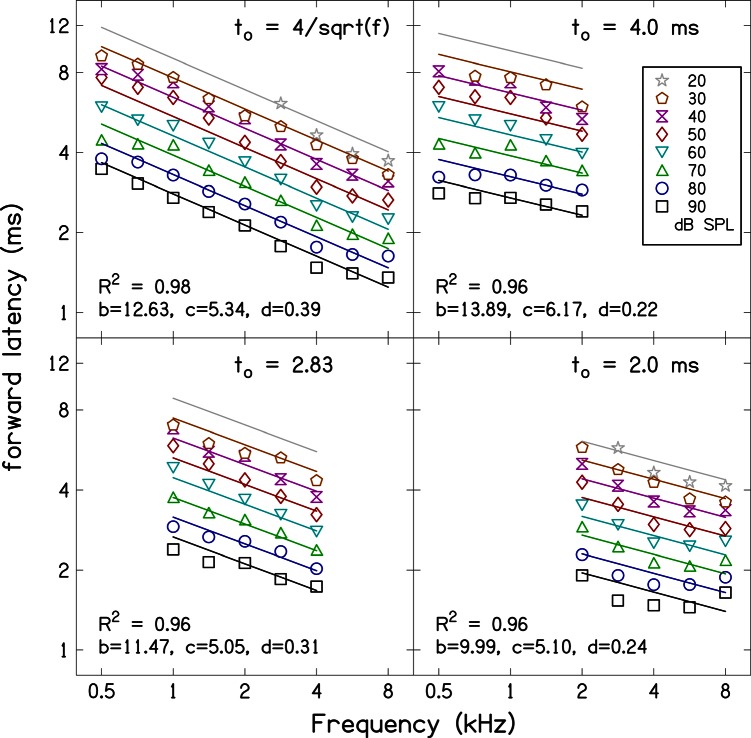
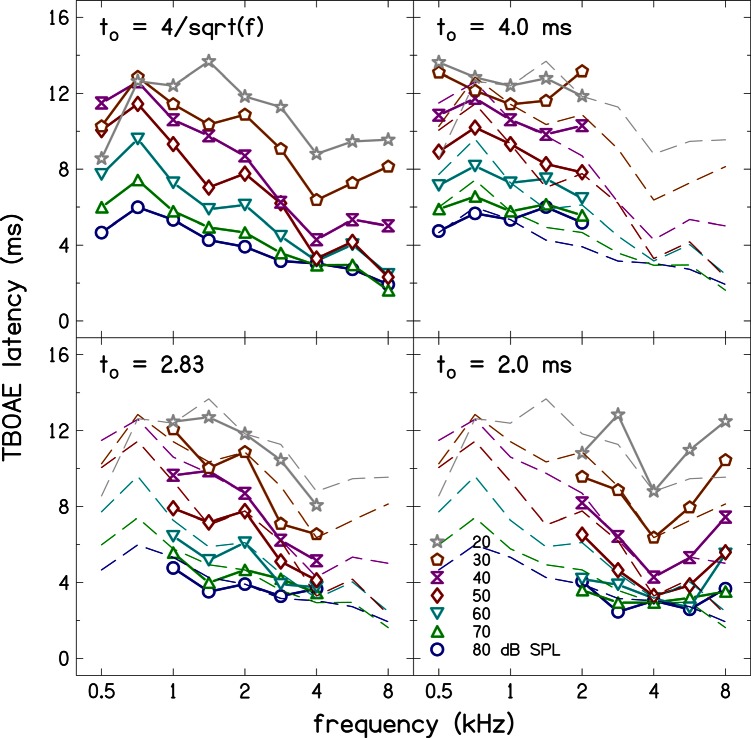
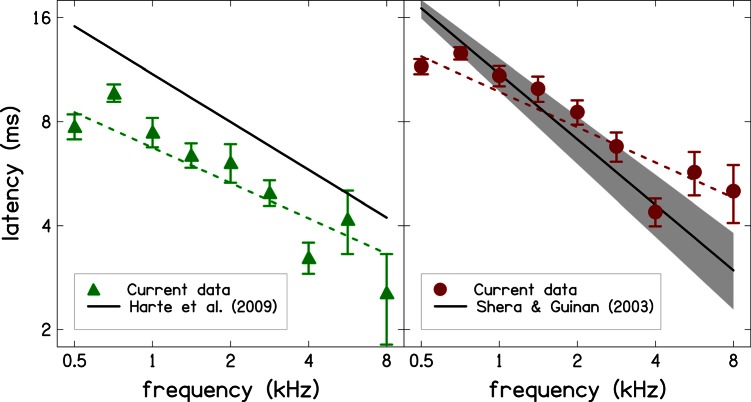
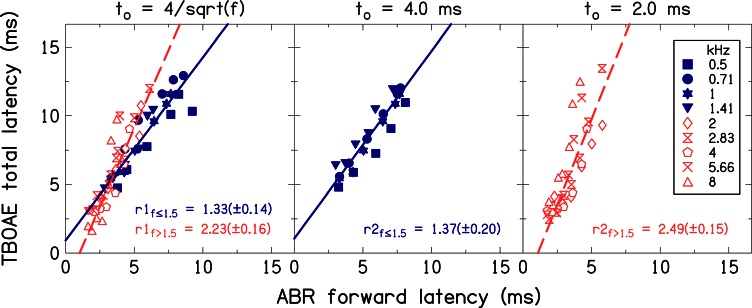
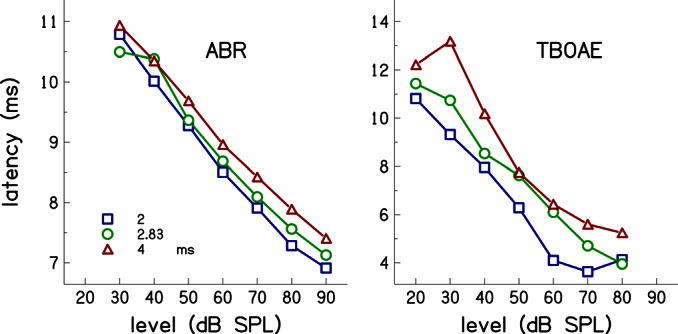
Simultaneous measurement of auditory brain stem response (ABR) and otoacoustic emission (OAE) delays may provide insights into effects of level, frequency, and stimulus rise-time on cochlear delay. Tone-burst-evoked ABRs and OAEs (TBOAEs) were measured simultaneously in normal-hearing human subjects. Stimuli included a wide range of frequencies (0.5-8 kHz), levels (20-90 dB SPL), and tone-burst rise times. ABR latencies have orderly dependence on these three parameters, similar to previously reported data by Gorga et al. [J. Speech Hear. Res. 31, 87-97 (1988)]. Level dependence of ABR and TBOAE latencies was similar across a wide range of stimulus conditions. At mid-frequencies, frequency dependence of ABR and TBOAE latencies were similar. The dependence of ABR latency on both rise time and level was significant; however, the interaction was not significant, suggesting independent effects. Comparison between ABR and TBOAE latencies reveals that the ratio of TBOAE latency to ABR forward latency (the level-dependent component of ABR total latency) is close to one below 1.5 kHz, but greater than two above 1.5 kHz. Despite the fact that the current experiment was designed to test compatibility with models of reverse-wave propagation, existing models do not completely explain the current data.


Figures

Figure 1
Figure 1
(Color online) Durations of tone-burst stimuli used at different frequencies. Four sets of stimulus durations were used in this study. In the first set (filled symbols), the duration (to) of the tone-bursts varied with frequency (fo) according to to=4/fo In the additional three sets (open symbols), the stimulus duration was held constant over a two-octave frequency range. Specifically, the constant stimulus duration of 4.00 ms was used for frequencies of 0.5–2 kHz, 2.83 ms was used for 1–4 kHz, and 2.00 ms for 2–8 kHz. Stimulus rise time is half the stimulus duration.
Figure 2
Figure 2
(Color online) ABR latencies as function of frequency for the four stimulus durations. Latencies for the stimulus duration to=4/fo are superimposed as dashed lines in the other panels for comparison. There is an orderly dependence of latency on frequency and level for each stimulus condition. However, the frequency-dependence of the latency is stronger (steeper curve) for the stimulus duration data acquired using the frequency-dependent stimulus duration compared to the constant duration stimulus.
Figure 3
Figure 3
(Color online) Comparison of current ABR latency estimates forstimulus duration to=4/fo to latency estimates of Gorga et al. (1988). There is agreement between the current latency estimates and the latency estimates from Gorga et al. (1988).
Figure 4
Figure 4
(Color online) ABR forward latency as a function of stimulus frequency. The symbols represent the same data presented in Fig. 2 but with 5 ms subtracted. The parallel lines are the power law fits to the data [see Eq. 4]. Parameters values for the power-law fit and R2 values are included as inserts in the figure panels. Equation 4 accounts for at least 92% of the variance. There is frequency and level dependence for each set of stimulus durations. However, frequency dependence is stronger for the stimulus duration to=4/fo.
Figure 5
Figure 5
(Color online) TBOAE latencies as function of frequency for the four stimulus durations. Latencies for the stimulus duration to=4/fo are superimposed as dashed lines in the other panels for comparison. The latencies depend on level and frequency. However, the dependence is not as orderly compared to that of ABR latencies.
Figure 6
Figure 6
(Color online) Power-law fits to TBOAE latency. When the data are reliable (frequency-dependent stimulus duration and stimulus duration = 2.83 ms), the frequency and level dependence of TBOAE latency is similar to that of ABR forward latency.
Figure 7
Figure 7
(Color online) Comparison of current TBOAE latencies to the TBOAE latencies of Harte et al. (2009) at 66 dB peSPL and to the SFOAE latencies of Shera and Guinan (2003) at 40 dB SPL. The shaded region describes the 95% confidence interval for the power-law fit reported by Shera and Guinan.
Figure 8
Figure 8
(Color online) Relationship between TBOAE latency and ABR forward latency. Filled symbols are used for low frequencies (≤1.5 kHz) and open symbols for high frequencies (>1.5 kHz). The solid and dashed lines are simple linear regression fits to the data at low and high frequencies, respectively. Slopes of the lines fit to the data are included as inserts in the figure panels. Uncertainties in the slope estimates (i.e., 95% confidence intervals) are also included. These slopes were used to represent the ratio of TBOAE latency to ABR forward latency.
Figure 9
Figure 9
(Color online) ABR and TBOAE latencies at 2 kHz as function of stimulus level. The parameter is stimulus duration as indicated in the figure insert.

References

    1. Burkard, R., and Secor, C. (2002). “ Overview of auditory evoked potential,” in Handbook of Clinical Audiology, edited by Katz J. (Lippincott, Williams, and Wilkins, Philadelphia, PA: ), Chap. 14, pp. 233–248.
    1. Dhar, S., Rogers, A., and Abdala, C. (2011). “ Breaking away: Violation of distortion emission phase-frequency invariance at low frequencies,” J. Acoust. Soc. Am. 129, 3115–3122.10.1121/1.3569732 - DOI - PMC - PubMed
    1. Don, M., Ponton, C. W., Eggermont, J. J., and Masuda, A. (1993). “ Gender differences in cochlear response time: An explanation for gender amplitude differences in the unmasked auditory brain stem response,” J. Acoust. Soc. Am. 94, 2135–2148.10.1121/1.407485 - DOI - PubMed
    1. Dong, W., and Olson, E. S. (2008). “ Supporting evidence for reverse cochlear traveling waves,” J. Acoust. Soc. Am. 123, 222–240.10.1121/1.2816566 - DOI - PubMed
    1. Eggermont, J. J., and Don, M. (1980). “ Analysis of the click-evoked brain stem potentials in humans using high-pass noise masking. II. Effect of click intensity,” J. Acoust. Soc. Am. 68, 1671–1675.10.1121/1.385199 - DOI - PubMed

Publication types