Toward a quantitative account of pitch distribution in spontaneous narrative: method and validation
- PMID: 23654400
- PMCID: PMC3663868
- DOI: 10.1121/1.4796111
Toward a quantitative account of pitch distribution in spontaneous narrative: method and validation
Abstract
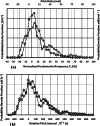
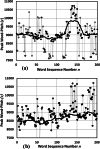
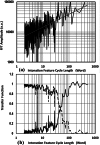
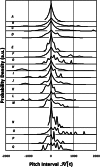
Pitch is well-known both to animate human discourse and to convey meaning in communication. The study of the statistical population distributions of pitch in discourse will undoubtedly benefit from methodological improvements. The current investigation examines a method that parameterizes pitch in discourse as musical pitch interval H measured in units of cents and that disaggregates the sequence of peak word-pitches using tools employed in time-series analysis and digital signal processing. The investigators test the proposed methodology by its application to distributions in pitch interval of the peak word-pitch (collectively called the discourse gamut) that occur in simulated and actual spontaneous emotive narratives obtained from 17 middle-aged African-American adults. The analysis, in rigorous tests, not only faithfully reproduced simulated distributions imbedded in realistic time series that drift and include pitch breaks, but the protocol also reveals that the empirical distributions exhibit a common hidden structure when normalized to a slowly varying mode (called the gamut root) of their respective probability density functions. Quantitative differences between narratives reveal the speakers' relative propensity for the use of pitch levels corresponding to elevated degrees of a discourse gamut (the "e-la") superimposed upon a continuum that conforms systematically to an asymmetric Laplace distribution.
Figures


Similar articles
-
When pitch Accents Encode Speaker Commitment: Evidence from French Intonation.Lang Speech. 2016 Jun;59(Pt 2):266-93. doi: 10.1177/0023830915587337. Lang Speech. 2016. PMID: 27363256
-
Pitch Strength as an Outcome Measure for Treatment of Dysphonia.J Voice. 2017 Nov;31(6):691-696. doi: 10.1016/j.jvoice.2017.01.016. Epub 2017 Mar 17. J Voice. 2017. PMID: 28318967 Free PMC article.
-
Long-term average spectra of adult Iranian speakers' voice.J Voice. 2014 May;28(3):305-10. doi: 10.1016/j.jvoice.2013.09.002. Epub 2013 Nov 13. J Voice. 2014. PMID: 24238703
-
Vowel space density as an indicator of speech performance.J Acoust Soc Am. 2017 May;141(5):EL458. doi: 10.1121/1.4983342. J Acoust Soc Am. 2017. PMID: 28599542 Free PMC article.
-
Issues in forensic voice.J Voice. 2014 Mar;28(2):170-84. doi: 10.1016/j.jvoice.2013.06.011. Epub 2013 Oct 28. J Voice. 2014. PMID: 24176301 Review.
Cited by
-
Robust Rate-Place Coding of Resolved Components in Harmonic and Inharmonic Complex Tones in Auditory Midbrain.J Neurosci. 2020 Mar 4;40(10):2080-2093. doi: 10.1523/JNEUROSCI.2337-19.2020. Epub 2020 Jan 29. J Neurosci. 2020. PMID: 31996454 Free PMC article.
References
-
- Abberton, E., and Fourcin, A. J. (1978). “ Intonation and speaker identification,” Lang Speech 21(4 ), 305–318. - PubMed
-
- Askenfelt, A. (1973). “ Determination of difference limen at low frequencies,” in STL-QPSR Speech Transmission Laboratory, Quarterly Progress and Status Report 14 (Royal Institute of Technology KTH, Stockholm: ), pp. 36–39.
-
- Bachorowski, J., and Owren, M. J. (2008). “ Vocal expressions of emotion,” in Handbook of Emotions, 3rd ed., edited by Lewis M., Haviland-Jones J. M., and Barrett L. F. (Guilford Press, New York: ), pp. 196–210.
-
- Bailey, G. (2001). “ The relationship between African American Vernacular English and White Vernaculars in the American South: A sociocultural history and some phonological evidence,” in Sociocultural and Historical Contexts of African American English, edited by Lanehart S. L. (John Benjamins, Amsterdam: ), pp. 53–92.
-
- Beranek, L. L. (1949). Acoustic Measurements (McGraw-Hill, New York: ), p. 523.
Publication types
MeSH terms
Grants and funding
LinkOut - more resources
Full Text Sources
Other Literature Sources

