. 2012 Nov 16;1(11):555-64.
doi: 10.1021/sb3000832. Epub 2012 Nov 5.

Genetic circuit performance under conditions relevant for industrial bioreactors

Affiliations

Genetic circuit performance under conditions relevant for industrial bioreactors

Felix Moser et al. ACS Synth Biol. .

Abstract

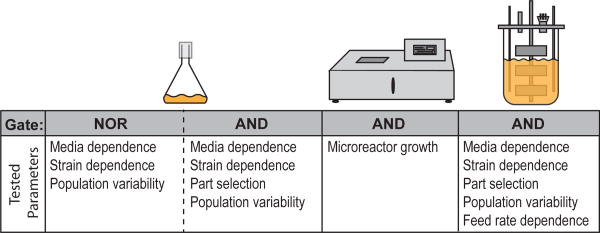
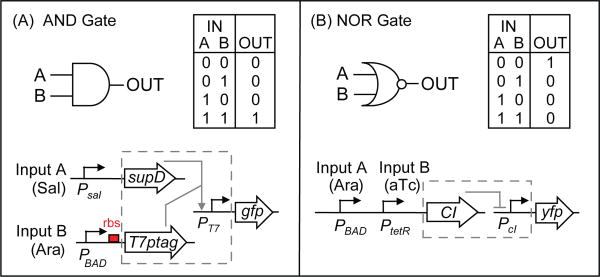
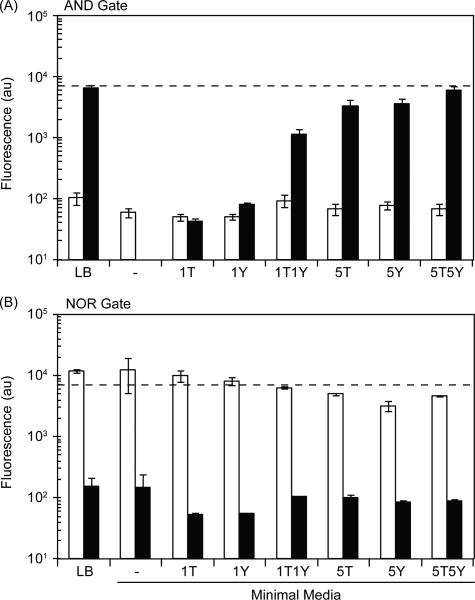
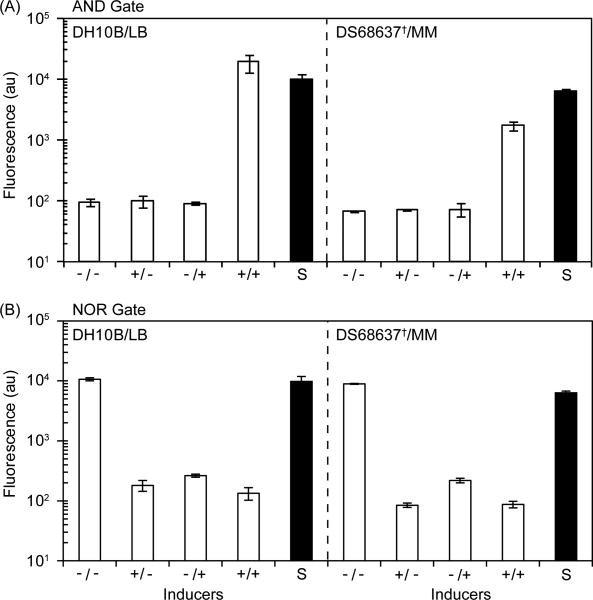
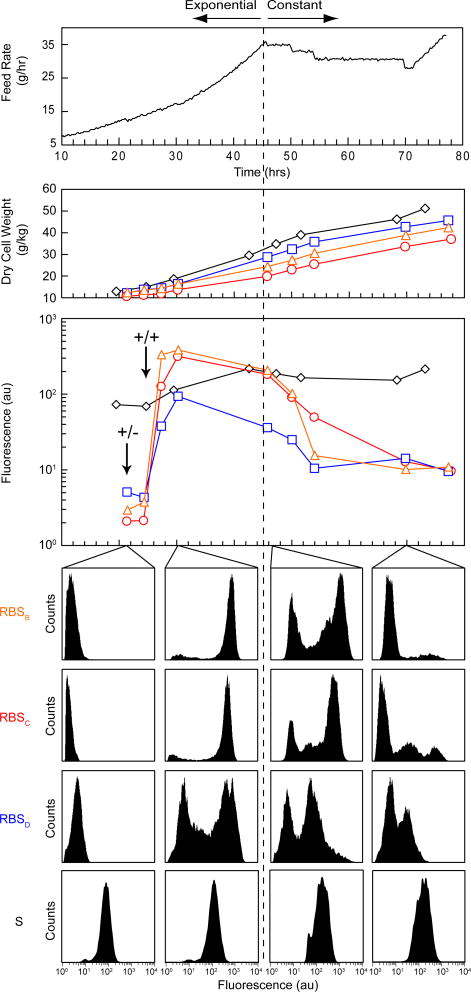
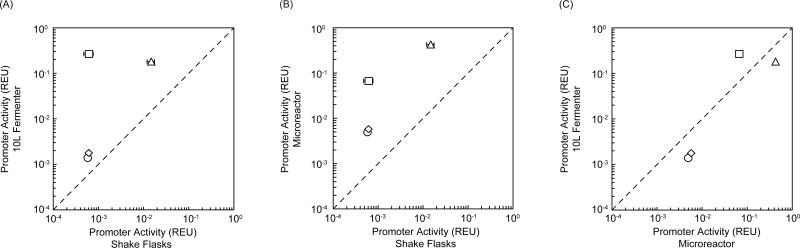
Synthetic genetic programs promise to enable novel applications in industrial processes. For such applications, the genetic circuits that compose programs will require fidelity in varying and complex environments. In this work, we report the performance of two synthetic circuits in Escherichia coli under industrially relevant conditions, including the selection of media, strain, and growth rate. We test and compare two transcriptional circuits: an AND and a NOR gate. In E. coli DH10B, the AND gate is inactive in minimal media; activity can be rescued by supplementing the media and transferring the gate into the industrial strain E. coli DS68637 where normal function is observed in minimal media. In contrast, the NOR gate is robust to media composition and functions similarly in both strains. The AND gate is evaluated at three stages of early scale-up: 100 mL shake flask experiments, a 1 mL MTP microreactor, and a 10 L bioreactor. A reference plasmid that constitutively produces a GFP reporter is used to make comparisons of circuit performance across conditions. The AND gate function is quantitatively different at each scale. The output deteriorates late in fermentation after the shift from exponential to constant feed rates, which induces rapid resource depletion and changes in growth rate. In addition, one of the output states of the AND gate failed in the bioreactor, effectively making it only responsive to a single input. Finally, cells carrying the AND gate show considerably less accumulation of biomass. Overall, these results highlight challenges and suggest modified strategies for developing and characterizing genetic circuits that function reliably during fermentation.


Figures

Figure 1
Figure 1. Overview of Experiments
The NOR gate and AND gate are compared across media and strains in shake flask experiments. The AND gate is further characterized in an MTP microreactor and 10 L bioreactor.
Figure 2
Figure 2. The Genetic AND and NOR Gates
The symbol, look-up table, and structure of the genetic logic gates are shown. (A) The AND gate is based on a variant of T7 polymerase that contains two Amber stop codons (T7ptag). Only when the tRNA Amber suppressor SupD is transcribed is the T7 polymerase translated and turns ON the output T7 promoter driving the GFP reporter. The RBS varied in this study is shown in red. (B) The NOR gate is based on two tandem promoters that drive the expression of a repressor (CI) that turns off an output promoter driving the GFP reporter.
Figure 3
Figure 3. Impact of Media on Gate Performance in E. coli DH10B
Media composition affects the performance of the AND (RBSB) and NOR gates. E. coli DH10B carrying the (A) AND or (B) NOR gate were grown both uninduced (white bars) and induced (black bars) in media of varying composition. The media composition is listed below the data. LB-Miller (LB) contains 10 g/L Tryptone, 5 g/L yeast extract, and 10 g/L NaCl. The other media is either unsupplemented minimal media (-) or minimal media supplemented as follows: 1 g/L Yeast Extract (1Y), 1 g/L Tryptone (1T), 5 g/L yeast extract (5Y), 5 g/L Tryptone (5T), 1 g/L yeast extract + 1 g/L Tryptone (1Y1T), 5 g/L yeast extract + 5 g/L tryptone (5Y5T). The output of the reference plasmid pFM46 (dotted line) is shown for comparison. All cultures were measured after 9 hours, except the cultures that were grown on minimal (unsupplemented) media, which were measured after 24 hours. Induced AND gates never grew on minimal media. The error bars represent the standard deviation of three experiments performed on different days.
Figure 4
Figure 4. Comparison of Gate Performance in E. coli DH10B and E. coli DS68637
Gate performance is measured in DH10B grown on LB and in DS68637 grown on unsupplemented minimal media (MM). (A) The output of the AND gate (RBSB) is shown for four combinations of inputs: -/- (no inducers), +/- (1.3 mM arabinose), -/+ (0.63 mM salicylate), +/+ (both inducers). The output of the reference plasmid pFM46 (S, black bars) is shown for both strain/media combinations. (B) The output of the NOR gate is shown for four combinations of inputs: -/- (no inducers), +/- (1.3 mM arabinose), -/+ (100 ng/ml aTc), +/+ (both inducers). In E. coli DH10B, the AND gates were measured after 9 hours and NOR gates were measured after 24 hours according to previously established protocols [21, 23]. In DS68637, the AND and NOR gates were both measured after 24 hours due to slower growth on the minimal media. The error bars represent the standard deviation of three experiments performed on different days.
Figure 5
Figure 5. Media and Strain Impact on RBS selection
The effect of varying the strength of the RBS connecting the arabinose sensor to the AND gate is shown. The ΔGtot is the strength of the RBS as determined using a biophysical model [21]. A more positive ΔGtot predicts strong secondary structure formation around the RBS, which correlates strongly with weaker translation [21]. Fitness scores the accuracy and function of the gate in each condition. A higher fitness indicates that the circuit is properly performing the AND function. The fitness was calculated as follows: First, the baseline fluorescence (-/-) was subtracted from each state. Then, the fluorescence of all states were normalized to the highest value of a partially induced state (-/+, +/-). Finally, the partially induced states were subtracted from the ON state (+/+). The RBSs characterized in this manuscript are colored (RBSA: green, RBSB: orange, RBSC: red, and RBSD: blue) and were previously characterized [18]. The calculated fitness is shown for the four RBS's studied for different media and strains. The media are LB broth (diamonds), minimal media containing 5 g/L yeast extract (5Y, triangles), and unsupplemented minimal media (circles). E. coli DH10B was measured in LB and 5Y, and E. coli DS68637 was measured in unsupplemented minimal medium. Error bars represent 1 standard deviation of three experiments.
Figure 6
Figure 6. Performance of an AND gate and Reference Plasmid in a Microreactor and 10 L Bioreactor
Cultures of E. coli DS68637 carrying the RBSB AND gate and a reference plasmid (pFM46) were grown in a BioLector microreactor on a 1 ml batch of rich 2xYT medium. (A) Cultures were induced at time 0 with either no inducer (-/-), single inducers (+/-, arabinose only; -/+ salicylate only) or both inducers (+/+). The fluorescence, cell density, dissolved oxygen, and pH of each culture was monitored for 40 hours (Figure S6). The reference plasmid data is shown as a dashed line. (B) The performance of E. coli DH10B carrying the RBSB AND gate is shown in a 10 L bioreactor. Both inducers (1.30 mM arabinose and 0.63 mM salicylate) are added at 42.5 hours. The fluorescence per dry cell weight (DCW) is shown for three fermentations in which the amount of yeast extract in the feed is varied: 0 g/kg (squares), 20 g/kg (diamonds), and 100 g/kg (circles). The glucose feed is initiated at 15 hours after inoculation and is exponentially increased over the course of the fermentation.
Figure 7
Figure 7. Performance in Fermentation of AND Gate RBS Variants
Three fermentations of RBS variants of the AND gate in E. coli DS68637 were performed. AND gate variants included either a strong (RBSB, orange triangles), medium (RBSC, red circles), and weak (RBSD, blue squares) RBS, which correspond in color to RBS's tested in Figure 5. These three fermentations were performed identically, with changes in feed rate and DO made as needed to match growth rates of the cultures. AND gate cultures were induced at 21 hours with 0.63 mM sodium salicylate (+/-) and then with 1.3 mM arabinose (+/+) at 24 hours. The feed rate was exponentially increased until 45 hours and then switched to a fixed feed rate; the dotted line marks the time of the switch. Samples were taken at 9 different times throughout fermentation. Dry cell weight (DCW) and fluorescence of each culture were measured at each time point. Fluorescence cytometry distributions are shown for the circuit in the OFF state (21 hours), when fully induced (30 hours), immediately after the shift to constant feeding (46 hours), and after 70 hours. For comparison, performance of an E. coli DS68637 strain carrying the reference plasmid pFM46 (S; black diamonds) is shown. The reference plasmid fermentation was carried out on a separate day and was sampled at 20, 30, 47, and 68 hours after inoculation. Data for this figure was gathered from Runs #6-8 for the AND gates and from Run #11 for the reference plasmid (Figure S7B, Table S1).
Figure 8
Figure 8. Comparison of AND gate activity across growth conditions
To compare AND gate expression across different growth conditions (shake flasks, 1 ml microreactor, and 10 L bioreactor), GFP fluorescence output of the RBSB AND gate was converted to relative expression units (REU) defined by the Kelly standard plasmid (SI Section VIII). This relative expression of the AND gate is compared in each pair of the following conditions: (A) shake flasks versus 10 L bioreactor, (B) shake flasks versus 1 ml MTP microreactor, and (C) 1 ml MTP microreactor versus 10 L bioreactor. The four different states (-/-, circles; ara/-, squares; -/sal, diamonds; +/+, triangles) are plotted. The dotted line represents a theoretically perfect correlation between states. The shake flask cultures are unable to predict the ara/-failure mode in the 1 ml microreactor and the 10 L bioreactor. However, the 1 ml microreactor predicted the ara/- failure mode of the gate in the 10 L bioreactor. Data for the shake flask cultures is taken from DS68637 grown on unsupplemented minimal media (Figure 4). The data for the microreactor corresponds to the mean fluorescence of each culture between 10 and 40 hours in Figures 6A and S6. Data for the 10 L bioreactor are derived from Run #6 (-/-, -/sal, +/+; Table S1) and Run #9 (ara/-; Figure S7B).

Similar articles

Cited by

References

    1. Medema MH, Breitling R, Bovenberg R, Takano E. Exploiting plug-and-play synthetic biology for drug discovery and production in microorganisms. Nat Rev Microbiol. 2011;9:131–137. - PubMed
    1. Anderson JC, Clarke EJ, Arkin AP, Voigt CA. Environmentally controlled invasion of cancer cells by engineered bacteria. J Mol Biol. 2006;355:619–627. - PubMed
    1. Purnick PEM, Weiss R. The second wave of synthetic biology: from modules to systems. Nat Rev. 2009;10:410–422. - PubMed
    1. Tabor JJ, Salis HM, Simpson ZB, Chevalier AA, Levskaya A, Marcotte EM, Voigt CA, Ellington AD. A synthetic genetic edge detection program. Cell. 2009;137:1272–1281. - PMC - PubMed
    1. Lou C, Liu X, Ni M, Huang Y, Huang Q, Huang L, Jiang L, Lu D, Wang M, Liu C, Chen D, Chen C, Chen X, Yang L, Ma H, Chen J, Ouyang Q. Synthesizing a novel genetic sequential logic circuit: a push-on push-off switch. Molecular Systems Biology. 2010;6:1. - PMC - PubMed

Publication types

MeSH terms

LinkOut - more resources