

Ataxia, dementia, and hypogonadotropism caused by disordered ubiquitination
- PMID: 23656588
- PMCID: PMC3738065
- DOI: 10.1056/NEJMoa1215993
Ataxia, dementia, and hypogonadotropism caused by disordered ubiquitination
Abstract
Background: The combination of ataxia and hypogonadism was first described more than a century ago, but its genetic basis has remained elusive.
Methods: We performed whole-exome sequencing in a patient with ataxia and hypogonadotropic hypogonadism, followed by targeted sequencing of candidate genes in similarly affected patients. Neurologic and reproductive endocrine phenotypes were characterized in detail. The effects of sequence variants and the presence of an epistatic interaction were tested in a zebrafish model.
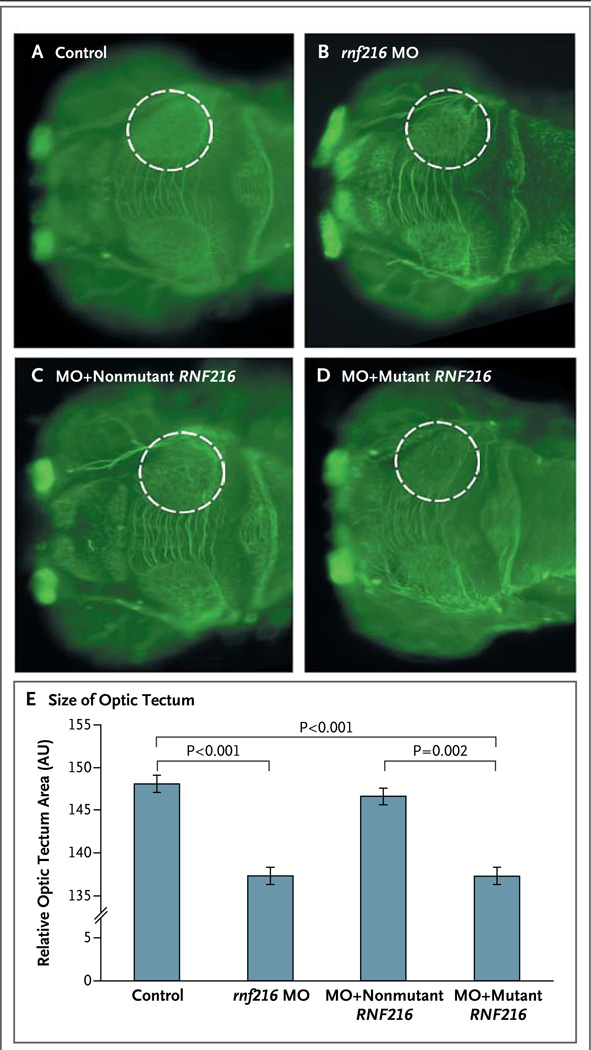
Results: Digenic homozygous mutations in RNF216 and OTUD4, which encode a ubiquitin E3 ligase and a deubiquitinase, respectively, were found in three affected siblings in a consanguineous family. Additional screening identified compound heterozygous truncating mutations in RNF216 in an unrelated patient and single heterozygous deleterious mutations in four other patients. Knockdown of rnf216 or otud4 in zebrafish embryos induced defects in the eye, optic tectum, and cerebellum; combinatorial suppression of both genes exacerbated these phenotypes, which were rescued by nonmutant, but not mutant, human RNF216 or OTUD4 messenger RNA. All patients had progressive ataxia and dementia. Neuronal loss was observed in cerebellar pathways and the hippocampus; surviving hippocampal neurons contained ubiquitin-immunoreactive intranuclear inclusions. Defects were detected at the hypothalamic and pituitary levels of the reproductive endocrine axis.
Conclusions: The syndrome of hypogonadotropic hypogonadism, ataxia, and dementia can be caused by inactivating mutations in RNF216 or by the combination of mutations in RNF216 and OTUD4. These findings link disordered ubiquitination to neurodegeneration and reproductive dysfunction and highlight the power of whole-exome sequencing in combination with functional studies to unveil genetic interactions that cause disease. (Funded by the National Institutes of Health and others.).
Figures


Similar articles
-
Ataxia and hypogonadism caused by the loss of ubiquitin ligase activity of the U box protein CHIP.Hum Mol Genet. 2014 Feb 15;23(4):1013-24. doi: 10.1093/hmg/ddt497. Epub 2013 Oct 9. Hum Mol Genet. 2014. PMID: 24113144 Free PMC article.
-
RNF216 mutations as a novel cause of autosomal recessive Huntington-like disorder.Neurology. 2015 Apr 28;84(17):1760-6. doi: 10.1212/WNL.0000000000001521. Epub 2015 Apr 3. Neurology. 2015. PMID: 25841028
-
Whole-Exome Sequencing Identified a Novel Mutation in RNF216 in a Family with Gordon Holmes Syndrome.J Mol Neurosci. 2022 Apr;72(4):691-694. doi: 10.1007/s12031-021-01953-0. Epub 2022 Jan 28. J Mol Neurosci. 2022. PMID: 35088240
-
Clinical and genetic spectrum of RNF216-related disorder: a new case and literature review.J Med Genet. 2024 Apr 19;61(5):430-434. doi: 10.1136/jmg-2023-109397. J Med Genet. 2024. PMID: 38050071 Review.
-
Ataxia and Hypogonadism: a Review of the Associated Genes and Syndromes.Cerebellum. 2024 Apr;23(2):688-701. doi: 10.1007/s12311-023-01549-x. Epub 2023 Mar 30. Cerebellum. 2024. PMID: 36997834 Review.
Cited by
-
Noncanonical regulation of alkylation damage resistance by the OTUD4 deubiquitinase.EMBO J. 2015 Jun 12;34(12):1687-703. doi: 10.15252/embj.201490497. Epub 2015 May 5. EMBO J. 2015. PMID: 25944111 Free PMC article.
-
Non-canonical regulation of the reactivation of an oncogenic herpesvirus by the OTUD4-USP7 deubiquitinases.PLoS Pathog. 2024 Jan 12;20(1):e1011943. doi: 10.1371/journal.ppat.1011943. eCollection 2024 Jan. PLoS Pathog. 2024. PMID: 38215174 Free PMC article.
-
Gordon Holmes Syndrome Model Mice Exhibit Alterations in Microglia, Age, and Sex-Specific Disruptions in Cognitive and Proprioceptive Function.eNeuro. 2024 Jan 25;11(1):ENEURO.0074-23.2023. doi: 10.1523/ENEURO.0074-23.2023. Print 2024 Jan. eNeuro. 2024. PMID: 38164552 Free PMC article.
-
RNF216 Regulates the Migration of Immortalized GnRH Neurons by Suppressing Beclin1-Mediated Autophagy.Front Endocrinol (Lausanne). 2019 Jan 24;10:12. doi: 10.3389/fendo.2019.00012. eCollection 2019. Front Endocrinol (Lausanne). 2019. PMID: 30733708 Free PMC article.
-
Spinocerebellar ataxia type 48: last but not least.Neurol Sci. 2020 Sep;41(9):2423-2432. doi: 10.1007/s10072-020-04408-3. Epub 2020 Apr 27. Neurol Sci. 2020. PMID: 32342324 Review.
References
-
- Sailer A, Houlden H. Recent advances in the genetics of cerebellar ataxias. Curr Neurol Neurosci Rep. 2012;12:227–236. - PubMed
-
- Holmes G. A form of familial degeneration of the cerebellum. Brain. 1908;30:466–489.
-
- Volpé R, Metzler WS, Johnston MW. Familial hypogonadotrophic eunuchoidism with cerebellar ataxia. J Clin Endocrinol Metab. 1963;23:107–115. - PubMed
-
- Lowenthal A, Bekaert J, Van Dessel F, van Hauwaert J. Familial cerebellar ataxia with hypogonadism. J Neurol. 1979;222:75–80. - PubMed
Publication types
MeSH terms
Substances
Grants and funding
- UC2 HL103010/HL/NHLBI NIH HHS/United States
- HL102925/HL/NHLBI NIH HHS/United States
- M01RR01066/RR/NCRR NIH HHS/United States
- HL103010/HL/NHLBI NIH HHS/United States
- P50 DK096415/DK/NIDDK NIH HHS/United States
- HL102924/HL/NHLBI NIH HHS/United States
- RC2 HL102924/HL/NHLBI NIH HHS/United States
- R01 HD043341/HD/NICHD NIH HHS/United States
- U54 HG003967/HG/NHGRI NIH HHS/United States
- R01 HD042601/HD/NICHD NIH HHS/United States
- U54 HD028138/HD/NICHD NIH HHS/United States
- HL102923/HL/NHLBI NIH HHS/United States
- RC2 HL102923/HL/NHLBI NIH HHS/United States
- UC2 HL102926/HL/NHLBI NIH HHS/United States
- RC2 HL102926/HL/NHLBI NIH HHS/United States
- UL1TR025758/TR/NCATS NIH HHS/United States
- K24 HD067388/HD/NICHD NIH HHS/United States
- HL102926/HL/NHLBI NIH HHS/United States
- M01 RR001066/RR/NCRR NIH HHS/United States
- UC2 HL102923/HL/NHLBI NIH HHS/United States
- UC2 HL102924/HL/NHLBI NIH HHS/United States
- RC2 HL103010/HL/NHLBI NIH HHS/United States
- UL1 RR025758/RR/NCRR NIH HHS/United States
- RC2 HL102925/HL/NHLBI NIH HHS/United States
- UC2 HL102925/HL/NHLBI NIH HHS/United States
LinkOut - more resources
Full Text Sources
Other Literature Sources
Medical
Molecular Biology Databases