. 2013 Jun 1;12(11):1679-87.
doi: 10.4161/cc.24757. Epub 2013 May 1.

Oncogenic miR-181a/b affect the DNA damage response in aggressive breast cancer

Affiliations

Oncogenic miR-181a/b affect the DNA damage response in aggressive breast cancer

Andrea Bisso et al. Cell Cycle. .

Abstract

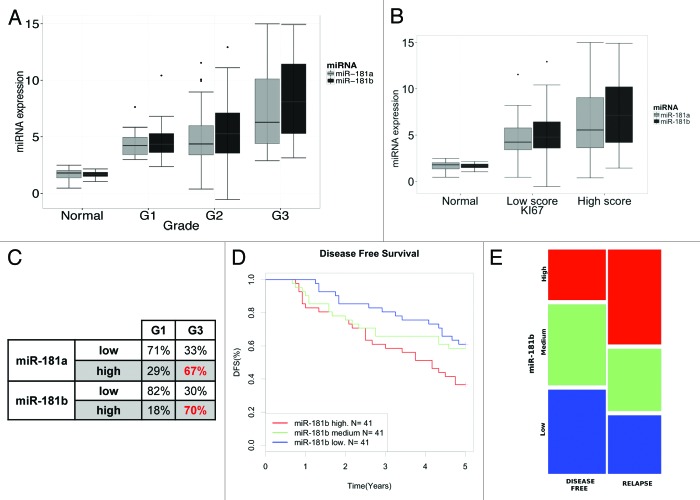
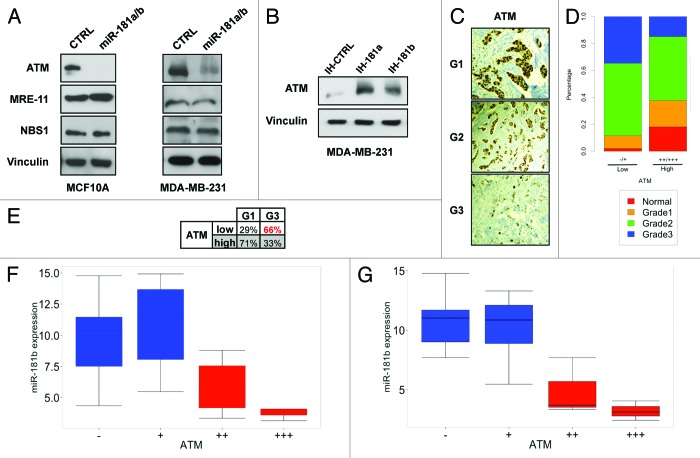
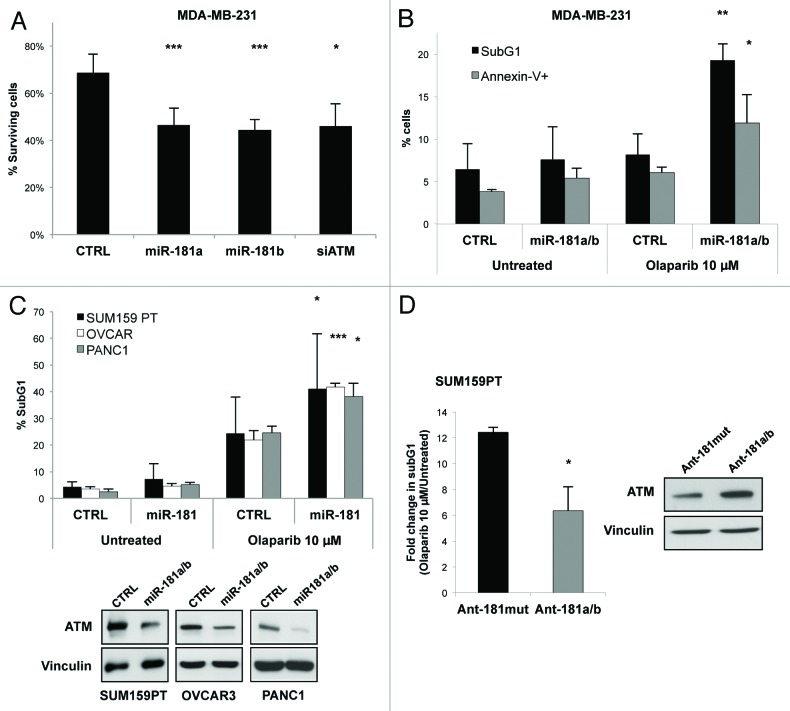
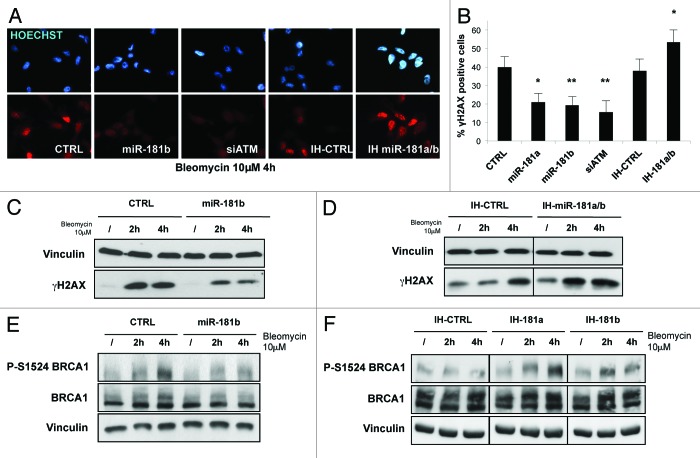
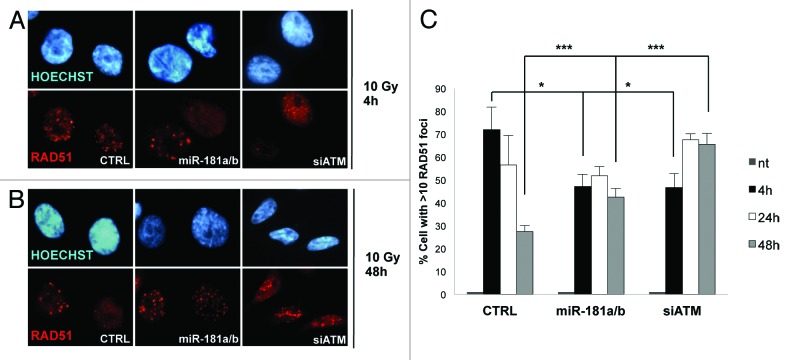
Breast cancer is a heterogeneous tumor type characterized by a complex spectrum of molecular aberrations, resulting in a diverse array of malignant features and clinical outcomes. Deciphering the molecular mechanisms that fuel breast cancer development and act as determinants of aggressiveness is a primary need to improve patient management. Among other alterations, aberrant expression of microRNAs has been found in breast cancer and other human tumors, where they act as either oncogenes or tumor suppressors by virtue of their ability to finely modulate gene expression at the post-transcriptional level. In this study, we describe a new role for miR-181a/b as negative regulators of the DNA damage response in breast cancer, impacting on the expression and activity of the stress-sensor kinase ataxia telangiectasia mutated (ATM). We report that miR-181a and miR-181b were overexpressed in more aggressive breast cancers, and their expression correlates inversely with ATM levels. Moreover we demonstrate that deregulated expression of miR-181a/b determines the sensitivity of triple-negative breast cancer cells to the poly-ADP-ribose-polymerase1 (PARP1) inhibition. These evidences suggest that monitoring the expression of miR-181a/b could be helpful in tailoring more effective treatments based on inhibition of PARP1 in breast and other tumor types.

Keywords: ATM; BRCA1; BRCAness; DNA damage response; PARP inhibitors; breast cancer; microRNA.


Figures

None
Figure 1. miR-181a/b expression levels correlate with breast cancer aggressiveness. (A) Plot of miR-181a and miR-181b expression (ΔΔCt) according to tumor grade (grade 1 tumors n = 17, grade 2 n = 60, grade 3 n = 27). miR-181a and miR-181b levels were evaluated by RT-qPCR and normalized to the expression of U6B RNA (see “Materials and Methods” for details). p < 10−7 (miR-181a) and p < 10−8 (miR-181b), Anova test on linear regression models. (B) Plot of miR-181a and miR-181b expression (ΔΔCt) according to Ki67 staining evaluated by IHC. p < 10−09 for both miR-181a and miR-181b, Anova test on linear regression models. (C) miR-181a/b expression was classified as high or low relative to the average value of expression in all samples. Percentage of miR-181a/b high or low expression within grade 1 or grade 3 tumors is reported. p = 0.0014 for miR-181a and p = 4.2 × 10⁻⁶ for miR-181b, Pearson’s Chi-square test. (D) Kaplan-Meier survival curves of disease free survival (DFS) of breast cancer patients classified according to the expression miR-181b, LogRank test, p = 0.0066, n = 123) (E) Mosaic plot showing the distribution of tumors with high (blue bars), medium (green bars) or low (red bars) miR-181b levels, assessed by comparing miRNA abundance in breast tumor samples that developed (relapse) or not (disease-free) a metastasis within 5 y after diagnosis. p-value (p < 0.05, Pearson’s Chi-square test) was calculated comparing “low” vs “high” miR-181b expression (see “Materials and Methods” for details).
None
Figure 2. miR-181a/b regulate ATM levels in breast cancer. (A) MCF10A and MDA-MB-231 cells were transfected with a combination of miR-181a/b or control siRNA and western blot analysis was performed after 72 h to detect ATM, Mre11, NBS1 and vinculin (loading control) protein levels. (B) MDA-MB-231 cells were transfected with miR-181a (anti-miR-181a), miR-181b (anti-miR-181b) or control inhibitors (anti-CTRL). Western blot analysis was performed after 96h to detect ATM and vinculin (loading control) protein levels. (C) Representative images of ATM staining in a tumor of grade 1, 2 and 3 (see “Materials and Methods” for details). (D) Mosaic plot showing the distribution of tumor grade according to ATM low (−/+) or high (++/+++) expression detected by IHC in each breast cancer sample p < 10−06, Pearson’s Chi-square test. (E) Percentage of ATM high or low expression within grade 1 or grade 3 tumors. p = 0.0014, Pearson’s Chi-square test. (F) Plot of miR-181b expression (ΔΔCt) according to ATM staining intensity in grade 3 breast cancer samples. p = 0.004665, Anova test on linear regression models. (G) Plot of miR-181b expression (ΔΔCt) according to ATM staining intensity in triple-negative breast cancer samples (n = 15). p = 0.005395, Anova test on linear regression models.
None
Figure 5. miR-181a/b sensitize cancer cells to Olaparib treatment. (A) Colony formation of MDA-MB-231 cells transfected with miR-181a, miR-181b, ATM (siATM) or control siRNA (CTRL) and treated with 1 µM Olaparib for 10 d. Percentage of surviving fraction are reported. Surviving fractions were calculated as ratio between plating efficiency in Olaparib-treated cells and plating efficiency in untreated cells. Plating efficiency was obtained according the following formula: # of colonies/# of plated cells. (B) MDA-MB-231 cells were transfected with a combination of miR-181a and miR-181b or control siRNA and 72 h hour later splitted and treated with 10 µM Olaparib. After 7 d, cells were harvested and half of them permeabilized and stained with propidium iodide, and the other half stained with PI/Annexin V, and analyzed by flow cytometry. The percentage of sub G1 population (black columns) and Annexin V positive cells (gray columns) are reported. (C) SUM159PT, OVCAR-3 and PANC1 cells transfected with a combination of miR-181a and miR-181b or control siRNA, were treated with 10 µM Olaparib for 4 (SUM159PT and PANC1) or 7 (OVCAR) d. Cells were then harvested, stained with propidium iodide and subjected to FACS analysis. The percentage of SubG1 population is reported. A representative western blot showing the levels of ATM and Vinculin as loading control is reported. (D) SUM159PT cells transfected with a combination of antagomiR against miR-181a and miR-181b (ant-181a/b) or a control antagomir mutated in five residues (Ant-181mut), and treated as in (C). A representative western blot showing the levels of ATM and Vinculin as loading control is reported. Graphs show means and s.d. for at least three independent experiments. p values were calculated with two tailed t-test: *, p < 0.05; **, p < 0.01; ***, p < 0.001.
None
Figure 3. miR-181a/b impairs ATM signaling. (A) MDA-MB-231 cells were transfected with miR-181a, miR-181b, siATM, control siRNA (CTRL) and with a combination of miR-181a and miR-181b inhibitors (IH-miR-181a/b) or control inhibitor (IH-CTRL). After 72 h cells, were split, and after 24 h treated with bleomycin (10 µM) for additional 4 h. Cells were then fixed, and immunofluorescence assay was performed to detect cells positive for γH2AX foci. A representative picture is shown for each condition. (B) Graph represents percentage of cells positive for γH2AX foci and shows means and s.d. for three independent experiments. (C) MDA-MB-231 cells transfected with miR-181b or control siRNA (CTRL) and (D) with a combination of miR-181a and miR-181b inhibitors (IH-miR-181a/b) or control inhibitor (IH-CTRL) were treated with bleomycin (10 µM) for 2 or 4 h. Western blot analysis was performed to detect phosphorylated H2AX and vinculin levels (loading control). (E) The same lysates analyzed in (C) were subjected to western blot analysis to detect phosphorylation on serine 1524 of BRCA1, total BRCA1 and vinculin levels (loading control). (F) MDA-MB-231 cells transfected with miR-181a (IH-miR-181a), miR-181b (IH-miR-181b) or control inhibitors (IH-CTRL) were treated with bleomycin (10 µM) for 2 or 4 h and subjected to western blot analysis to detect phosphorylation on serine 1524 of BRCA1, total BRCA1 and vinculin levels (loading control). p values were calculated with two tailed t-test, *, p < 0.05; **, p < 0.01; ***, p < 0.001.
None
Figure 4. miR-181a/b alters the assembly of RAD51 foci. (A and B) MDA-MB-231 cells were transfected with a combination of miR-181a/b, ATM (siATM) or control siRNA and treated with 10 Gy of IR. Cells were fixed after 4, 24 and 48 h and immunofluorescence assay was performed to detect cells positive for RAD51 foci. A representative picture is shown for cells fixed after 4 (A) and 48 (B) h. (C) Graph represents percentage of cells positive for RAD51 foci and shows means and s.d. for three independent experiments. p values were calculated with two-tailed t-test: *, p < 0.05; **, p < 0.01; ***, p < 0.001-

Comment in

References

    1. Di Micco R, Fumagalli M, Cicalese A, Piccinin S, Gasparini P, Luise C, et al. Oncogene-induced senescence is a DNA damage response triggered by DNA hyper-replication. Nature. 2006;444:638–42. doi: 10.1038/nature05327. - DOI - PubMed
    1. Bartkova J, Horejsí Z, Koed K, Krämer A, Tort F, Zieger K, et al. DNA damage response as a candidate anti-cancer barrier in early human tumorigenesis. Nature. 2005;434:864–70. doi: 10.1038/nature03482. - DOI - PubMed
    1. Ahmed M, Rahman N. ATM and breast cancer susceptibility. Oncogene. 2006;25:5906–11. doi: 10.1038/sj.onc.1209873. - DOI - PubMed
    1. Roy R, Chun J, Powell SN. BRCA1 and BRCA2: different roles in a common pathway of genome protection. Nat Rev Cancer. 2012;12:68–78. doi: 10.1038/nrc3181. - DOI - PMC - PubMed
    1. Mueller CR, Roskelley CD. Regulation of BRCA1 expression and its relationship to sporadic breast cancer. Breast Cancer Res. 2003;5:45–52. doi: 10.1186/bcr557. - DOI - PMC - PubMed

Publication types

MeSH terms