. 2013 Aug;40(2):115-21.
doi: 10.1097/SHK.0b013e318299d1a7.

CD14 contributes to warm hepatic ischemia-reperfusion injury in mice

Affiliations

CD14 contributes to warm hepatic ischemia-reperfusion injury in mice

Changchun Cai et al. Shock. 2013 Aug.

Abstract

Introduction: Ischemia/reperfusion (I/R) of the liver contributes to the pathobiology of liver injury in transplantation, liver surgery, and hemorrhagic shock. Ischemia/reperfusion induces an inflammatory response that is driven, in part, by Toll-like receptor 4 (TLR) signaling. CD14 is known to participate in the function of TLR4. We hypothesized that CD14 would be involved in the pathobiology of warm hepatic I/R.

Methods: Using a 70% liver inflow inclusion model, CD14 knockout and wild-type (WT) mice were subjected to 1-h warm ischemia followed by reperfusion. CD14 mRNA, circulating transaminase, interleukin 6, soluble CD14, and high-mobility group box 1 (HMGB1) levels were measured. CD14 neutralizing antibody or isotype control antibody was given before ischemia or reperfusion for CD14 blockade in WT mice. Recombinant HMGB1 was given before reperfusion in some experiments to test if liver injury worsens.

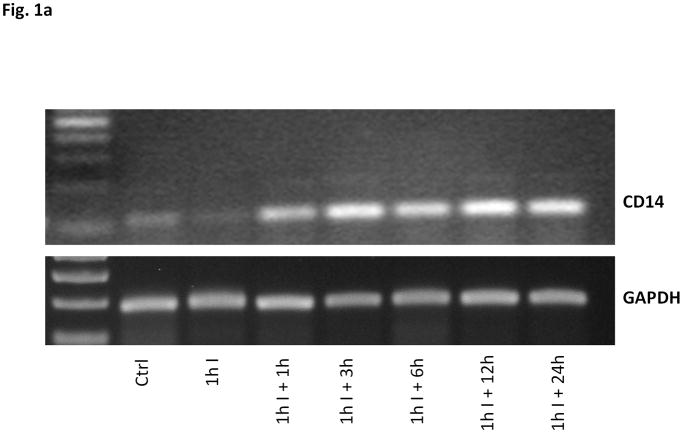
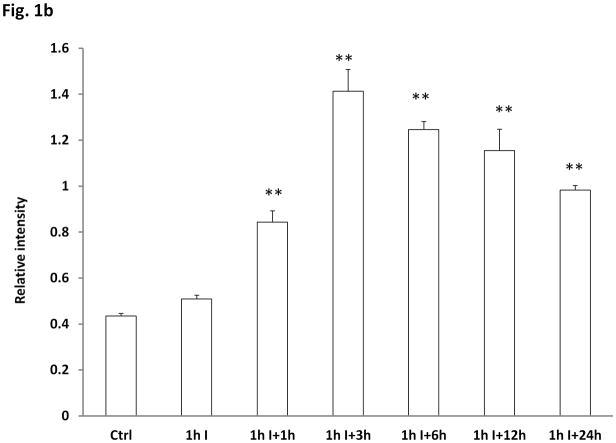
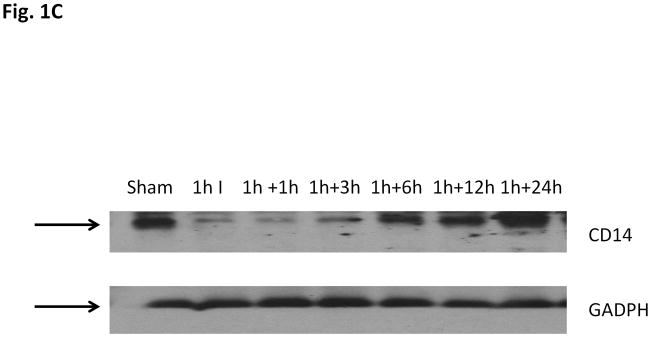
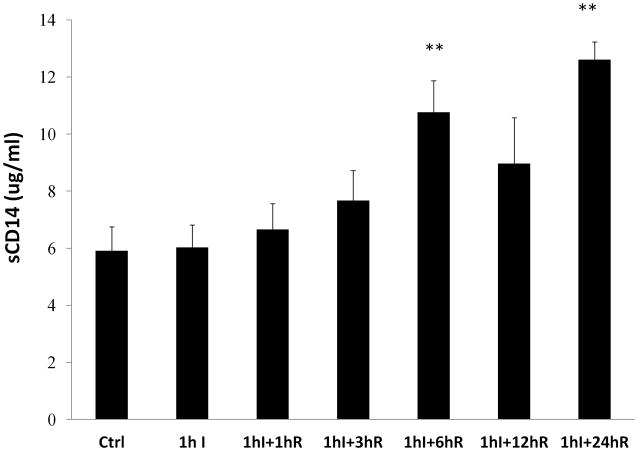
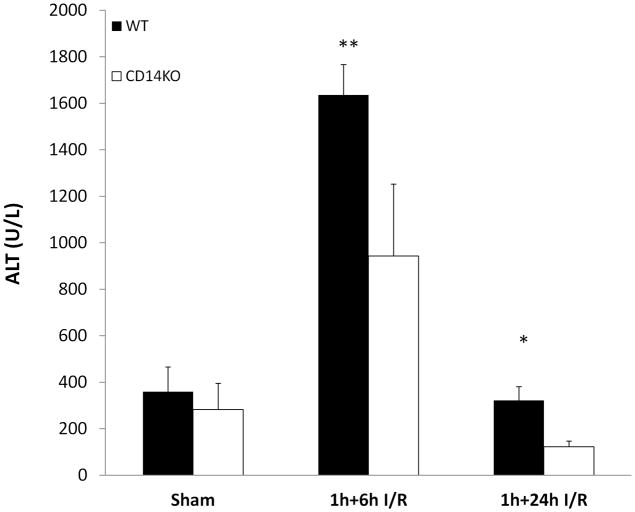
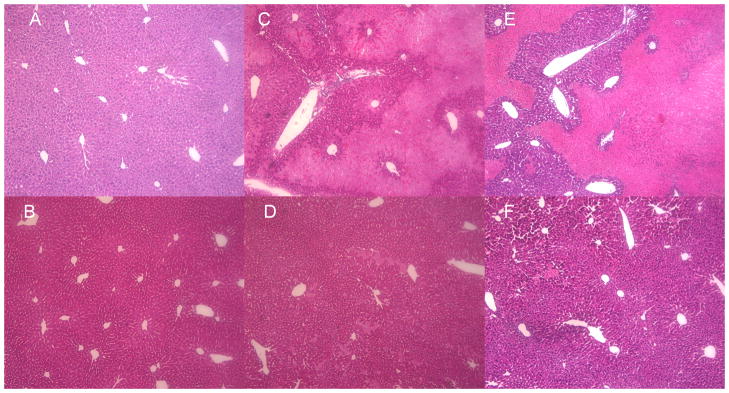
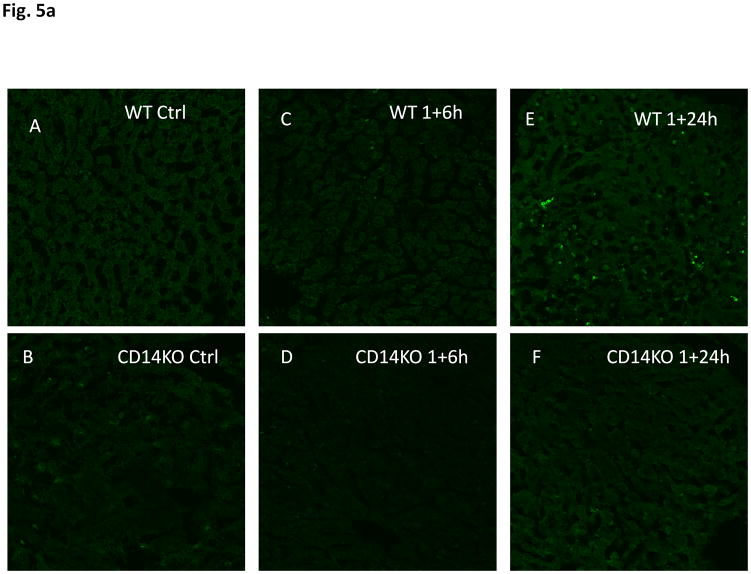
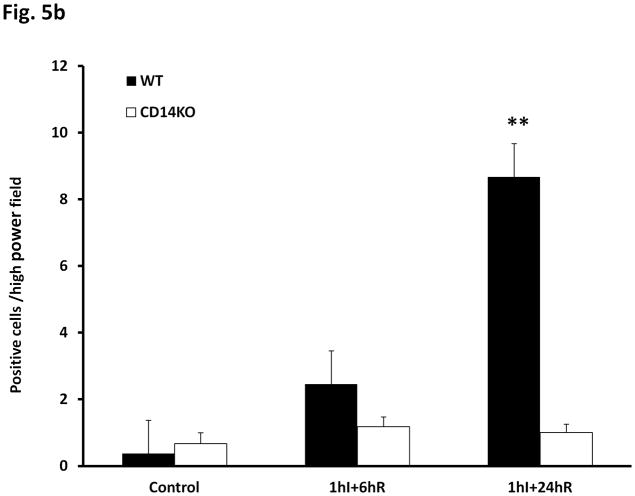
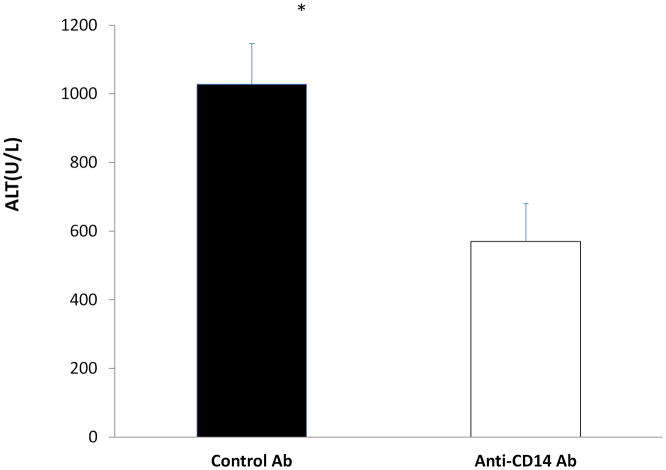
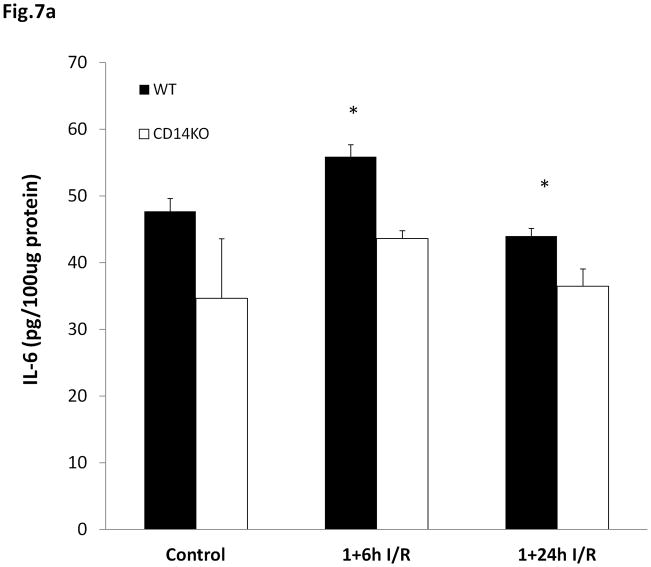
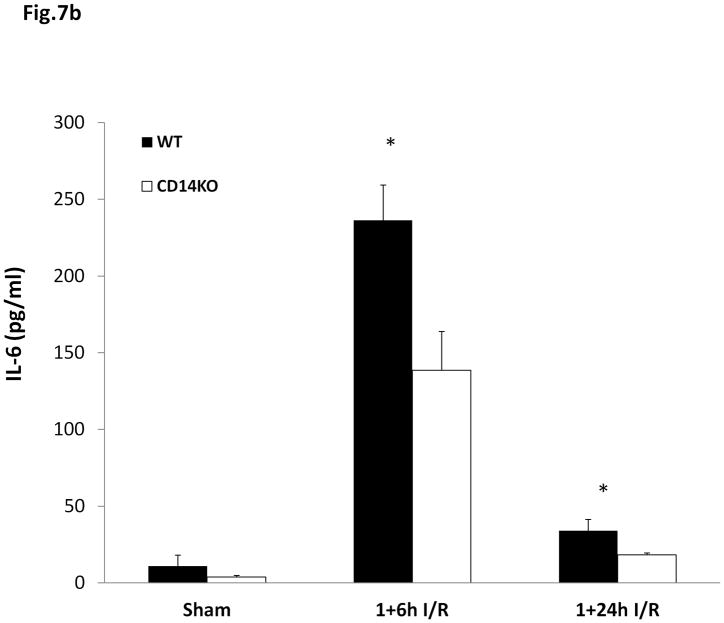
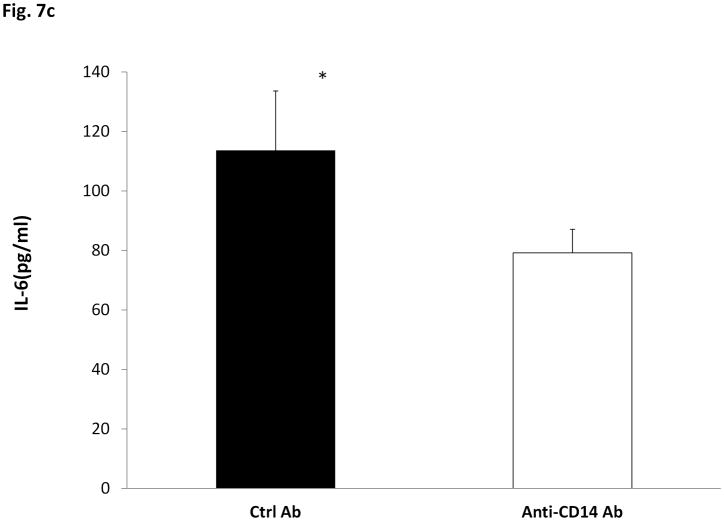
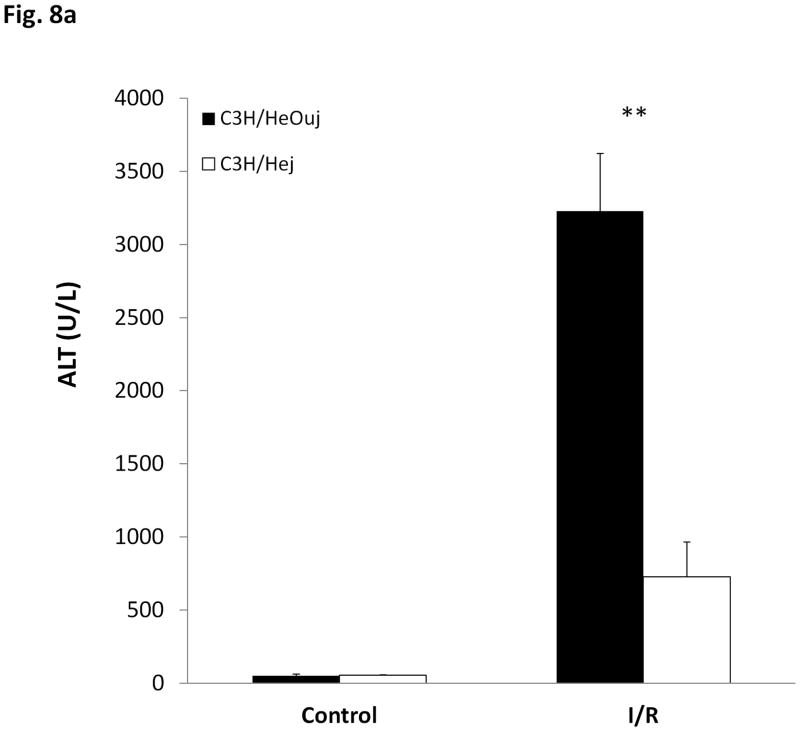
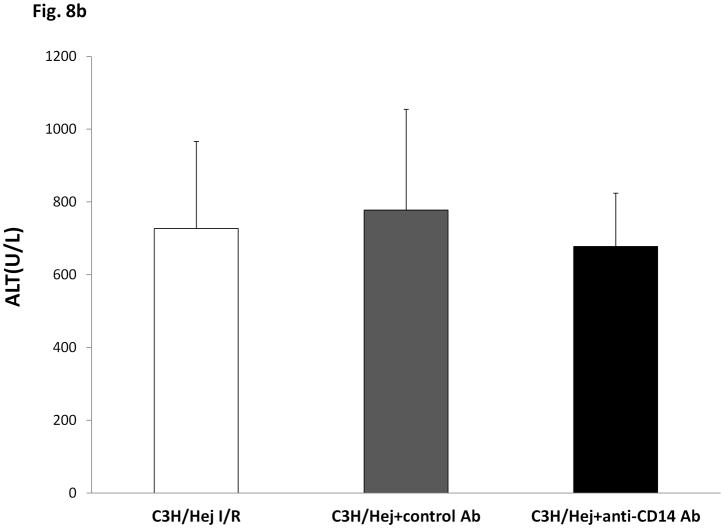
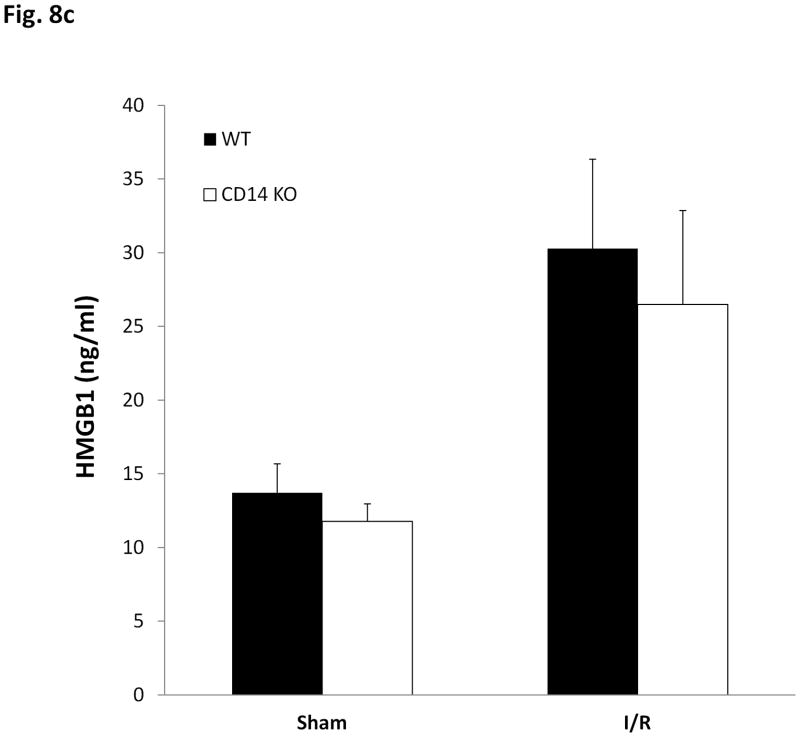
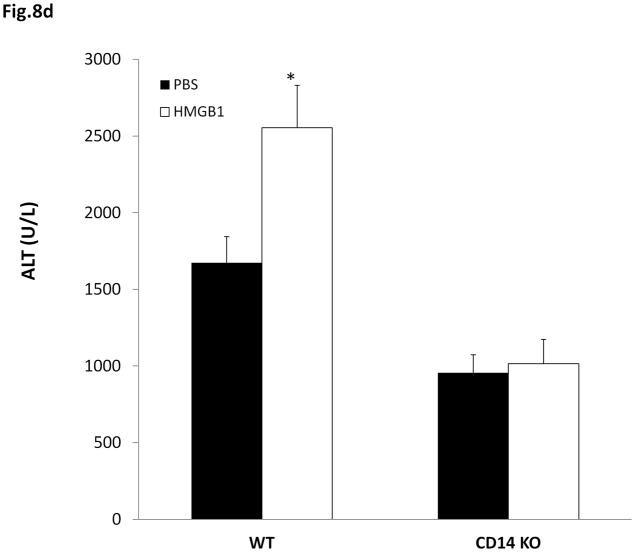
Results: There was an upregulation of CD14 mRNA in reperfused livers together with increased soluble CD14 levels in the circulation. Compared with WT control mice, CD14 knockout mice had much lower alanine aminotransferase and interleukin 6 levels at 6 and 24 h following I/R, and much less liver necrosis by histology. TUNEL (terminal deoxynucleotidyl-transferase dUTP nick end labeling) staining displayed less apoptosis at 24 h in the absence of CD14. CD14 blockage by neutralizing antibody also attenuated liver injury and the inflammatory response in C57BL/6 mice following I/R, but did not provide additional protection to TLR4 mutant C3H/Hej mice. CD14 deficiency did not change circulating HMGB1 levels following I/R (6 h). A dose of recombinant HMGB1, which worsened hepatic injury when given before reperfusion in WT mice, did not increase liver damage in CD14-deficient mice.

Conclusions: CD14 is actively involved in hepatic I/R injury. Its deficiency or blockade ischemia attenuates liver injury and inflammatory response. CD14 mediates liver damage and inflammatory responses in the setting of warm hepatic I/R in mice.


Figures

Fig. 1
Fig. 1
Fig. 1a Upregulation of CD14 mRNA after hepatic I/R. CD14 mRNA levels measured by RT-PCR in the livers of control mice and mice subjected to ischemia (I, 60 minutes) and reperfusion (R) for the indicated time periods. A representative gel of three similar experiments showed upregulation of CD14 mRNA with the start of reperfusion. Fig. 1b Quantification of CD14 mRNA expression after hepatic I/R. Compared with CD14 mRNA level in control livers, there is no difference with 1h ischemia only, but with the start of reperfusion, its expression was significantly increased (**P<0.01, n=3/group). Fig. 1c CD14 protein levels in hepatic I/R livers. A representative western blot analysis result of CD14 protein levels in homogenates of the liver lobes subjected to I/R. The blot shown is representative of five experiments yielding similar results.
Fig. 1
Fig. 1
Fig. 1a Upregulation of CD14 mRNA after hepatic I/R. CD14 mRNA levels measured by RT-PCR in the livers of control mice and mice subjected to ischemia (I, 60 minutes) and reperfusion (R) for the indicated time periods. A representative gel of three similar experiments showed upregulation of CD14 mRNA with the start of reperfusion. Fig. 1b Quantification of CD14 mRNA expression after hepatic I/R. Compared with CD14 mRNA level in control livers, there is no difference with 1h ischemia only, but with the start of reperfusion, its expression was significantly increased (**P<0.01, n=3/group). Fig. 1c CD14 protein levels in hepatic I/R livers. A representative western blot analysis result of CD14 protein levels in homogenates of the liver lobes subjected to I/R. The blot shown is representative of five experiments yielding similar results.
Fig. 2
Fig. 2. Time-course of sCD14 levels in the circulation after hepatic I/R
Wild type mice were subjected to I/R and serum assessed for sCD14 levels at the indicated time points. sCD14 levels at 6hr and 24hr of reperfusion were significantly higher than the control group (**both P<0.01, Values are expressed as mean ± SEM, n=6–8/ group).
Fig. 3
Fig. 3. ALT levels in wild type and CD14 knockout mice after hepatic I/R
Wild-type and CD14 knockout mice were subjected to I/R and ALT levels measured a 6 and 24 hours. Values are expressed as mean ± SEM. There was no difference between the sham groups. CD14 knockout mice had significantly lower ALT levels after 6hr (** P<0.01, n=8–9) and 24hr of reperfusion (* P<0.05, n=5–7).
Fig. 4
Fig. 4. Histological findings after hepatic I/R
Representative histological liver images of WT and CD14 knockout mice subjected to I/R. A. Shows representative normal liver structures in WT control mice (× 100) B. Shows representative normal liver structures in CD14KO control mice (× 100) C. Shows representative WT liver histological changes after 1h ischemia+6h reperfusion (× 100). D. Shows representative CD14KO mice liver structure after 1h ischemia+ 6h reperfusion (× 100). E. Shows representative WT liver after 1h ischemia+24h reperfusion (× 100). F. Shows representative CD14KO mice after 1h ischemia+ 24h reperfusion (× 100).
Fig. 5
Fig. 5
Fig. 5a Apoptosis in WT and CD14KO mice after hepatic I/R by TUNEL staining and morphology Representative TUNEL staining images of WT and CD14KO mouse livers. A. Negative staining in WT control liver (× 100) B. CD14 knockout control liver (× 100) C. WT liver after 1h ischemia+6h reperfusion (× 100) D. CD14 knockout liver after 1h ischemia+ 6h reperfusion (× 100) E. WT liver after 1h ischemia+24h reperfusion (× 100) F. CD14 knockout liver after 1h ischemia+ 24h reperfusion (× 100) Fig. 5b Quantitative analysis of positive TUNEL-staining cells. Positive stained cell numbers per high power field were compared between WT, CD14KO control groups and I/R groups. Results are expressed as mean±SEM, ** P<0.01, 3–4 mice/group.
Fig. 5
Fig. 5
Fig. 5a Apoptosis in WT and CD14KO mice after hepatic I/R by TUNEL staining and morphology Representative TUNEL staining images of WT and CD14KO mouse livers. A. Negative staining in WT control liver (× 100) B. CD14 knockout control liver (× 100) C. WT liver after 1h ischemia+6h reperfusion (× 100) D. CD14 knockout liver after 1h ischemia+ 6h reperfusion (× 100) E. WT liver after 1h ischemia+24h reperfusion (× 100) F. CD14 knockout liver after 1h ischemia+ 24h reperfusion (× 100) Fig. 5b Quantitative analysis of positive TUNEL-staining cells. Positive stained cell numbers per high power field were compared between WT, CD14KO control groups and I/R groups. Results are expressed as mean±SEM, ** P<0.01, 3–4 mice/group.
Fig. 6
Fig. 6. CD14 Neutralizing antibody treatment reduced liver I/R injury
Anti-CD14 or isotype control antibody was given to wild type mice 30 minutes prior to I/R. Liver injury was assessed by measuring circulating ALT levels at 6 hrs. Values are expressed as mean±SEM (n=5–6/group) *P<0.05.
Fig. 7
Fig. 7. IL-6 levels after hepatic I/R following treatment with anti-CD14 antibody
Fig. 7a: Comparison of IL-6 levels in ischemic liver hemogenates after hepatic I/R between WT and CD14 Knockout mice. Values are expressed as mean ± SEM. n=4–6/ group. * P<0.05; Fig.7b: IL-6 levels in the circulation after hepatic I/R in WT and CD14 knockout mice. Values are expressed as mean ± SEM. * P<0.05, n=4–6; Fig.7c : Serum IL-6 levels after hepatic I/R in wild type pretreated with control or anti-CD14 antibody. Values are expressed as mean ± SEM. n=5/ group. * P<0.05
Fig. 8
Fig. 8. Liver injuries of CD14 blockade in TLR4 mutant mice and HMGB1 treatment in CD14 deficient mice
Fig. 8a: Liver injury after hepatic I/R in C3H/Hej and C3H/HeOuj mice was assessed by measuring circulating ALT levels. Values are expressed as mean ± SEM n=7/ group. ** P<0.01; Fig.8b: ALT levels after hepatic I/R in C3H/Hej mice treated with anti-CD14 antibody. Values are expressed as mean ± SEM. n=4–7/ group. P=0.75; Fig.8c: HMGB1 levels after hepatic I/R. Values are expressed as mean ± SEM. n=6–8, P=0.23; Fig. 8d: Liver I/R injury measured as serum ALT levels in WT and CD14 knockout mice treated with recombinant HMGB1 (55 ug/mouse) just prior to reperfusion. Values are expressed as mean ± SEM. n=8 - 9 per group, * P<0.05, control I/R compared to wild type mice treated with rHMGB1; P=0.795, control I/R mice compared to CD14 knockout mice treated with rHMGB1.

Similar articles

Cited by

References

    1. Clemens MG, Bauer M, Pannen BH, Bauer I, Zhang JX. Remodeling of hepatic microvascular responsiveness after ischemia/reperfusion. Shock. 1997;8 (2):80–85. - PubMed
    1. Wu HS, Zhang JX, Wang L, Tian Y, Wang H, Rotstein O. Toll-like receptor 4 involvement in hepatic ischemia/reperfusion injury in mice. Hepatobiliary Pancreat Dis Int. 2004;3 (2):250–253. - PubMed
    1. Zhai Y, Shen XD, O’Connell R, Gao F, Lassman C, Busuttil RW, Cheng G, Kupiec-Weglinski JW. Cutting edge: TLR4 activation mediates liver ischemia/reperfusion inflammatory response via IFN regulatory factor 3-dependent MyD88-independent pathway. J Immunol. 2004;173 (12):7115–7119. - PubMed
    1. Tsung A, Sahai R, Tanaka H, Nakao A, Fink MP, Lotze MT, Yang H, Li J, Tracey KJ, Geller DA, Billiar TR. The nuclear factor HMGB1 mediates hepatic injury after murine liver ischemia-reperfusion. J Exp Med. 2005;201 (7):1135–1143. - PMC - PubMed
    1. Shen XD, Ke B, Zhai Y, Gao F, Tsuchihashi S, Lassman CR, Busuttil RW, Kupiec-Weglinski JW. Absence of toll-like receptor 4 (TLR4) signaling in the donor organ reduces ischemia and reperfusion injury in a murine liver transplantation model. Liver Transpl. 2007;13 (10):1435–1443. - PubMed

Publication types