

Glucose metabolism after renal transplantation
- PMID: 23656979
- PMCID: PMC3747896
- DOI: 10.2337/dc12-2441
Glucose metabolism after renal transplantation
Abstract
Objective: We determined prevalence, risk factors, phenotype, and pathophysiological mechanism of new-onset diabetes after transplantation (NODAT) to generate strategies for optimal pharmacological management of hyperglycemia in NODAT patients.
Research design and methods: Retrospective cohort study comparing demographics, laboratory data, and oral glucose tolerance test (OGTT)-derived metabolic parameters from kidney transplant recipients versus subjects not receiving transplants.
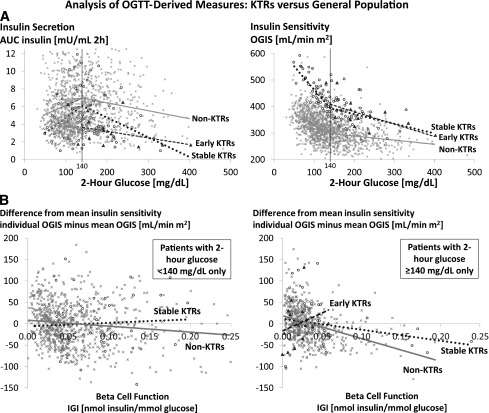
Results: Among 1,064 stable kidney transplant recipients (≥ 6 months posttransplantation), 113 (11%) had a history of NODAT and 132 (12%) had pretransplant diabetes. In the remaining patients, randomly assigned OGTTs showed a high prevalence of abnormal glucose metabolism (11% diabetes; 32% impaired fasting glucose, impaired glucose tolerance, or both), predominantly in older patients who received tacrolimus as the primary immunosuppressant. Compared with 1,357 nontransplant subjects, stable kidney transplant recipients had lower basal glucose, higher glycated hemoglobin, lower insulin secretion, and greater insulin sensitivity in each of the three subgroups, defined by OGTT 2-h glucose (<140, 140-199, ≥ 200 mg/dL). These findings were reinforced in linear spline interpolation models of insulin secretion and sensitivity (all P < 0.001) and in another regression model in which the estimated oral glucose insulin sensitivity index was substantially higher (by 79-112 mL/min m(2)) for transplant versus nontransplant subjects despite adjustments for age, sex, and BMI (all P < 0.001).
Conclusions: Glucose metabolism differs substantially between kidney transplant recipients and nontransplant controls. Because impaired insulin secretion appears to be the predominant pathophysiological feature after renal transplantation, early therapeutic interventions that preserve, maintain, or improve β-cell function are potentially beneficial in this population.
Figures
References
-
- Organ Procurement and Transplantation Network (OPTN) and Scientific Registry of Transplant Recipients. (SRTR) 2010 Annual Data Report, 2011. Available from http://www.srtr.org/annual_reports/2010/pdf/2010_SRTR_ADR.pdf Accessed 26 March 2012
-
- U.S. Renal Data System. USRDS 2012 Annual Data Report: Atlas of Chronic Kidney Disease and End-Stage Renal Disease in the United States, 2012. Available from http://www.usrds.org/adr.aspx Accessed 18 January 2013
-
- Hjelmesaeth J, Hartmann A, Leivestad T, et al. The impact of early-diagnosed new-onset post-transplantation diabetes mellitus on survival and major cardiac events. Kidney Int 2006;69:588–595 - PubMed
-
- Hjelmesaeth J, Hagen M, Hartmann A, Midtvedt K, Egeland T, Jenssen T. The impact of impaired insulin release and insulin resistance on glucose intolerance after renal transplantation. Clin Transplant 2002;16:389–396 - PubMed
MeSH terms
Substances
Grants and funding
LinkOut - more resources
Full Text Sources
Other Literature Sources
Medical
