

Fat distribution and glucose intolerance among Greenland Inuit
- PMID: 23656981
- PMCID: PMC3781528
- DOI: 10.2337/dc12-2703
Fat distribution and glucose intolerance among Greenland Inuit
Abstract
Objective: A high amount of subcutaneous fat is suggested to explain the observation of lower obesity-associated metabolic risk among Inuit than among Europeans. We examined the association between measures of obesity (visceral adipose tissue [VAT], subcutaneous adipose tissue [SAT], BMI, waist circumference [WC], and percentage of body fat) and the indices of glucose metabolism (fasting and 2-h glucose levels, insulin resistance per homeostasis model assessment [HOMA-IR], and the insulin sensitivity index [ISI0,120]) among Greenland Inuit.
Research design and methods: A total of 3,108 adult Inuit participated in a population-based study. The examination included a 75-g oral glucose tolerance test and anthropometric measurements. VAT and SAT were measured by ultrasound according to a validated protocol. Information on sociodemographic characteristics and health behaviors was obtained by interview.
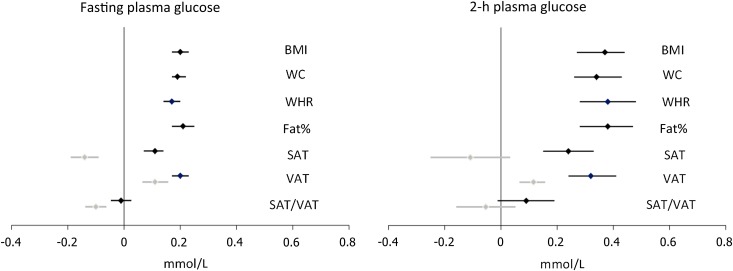
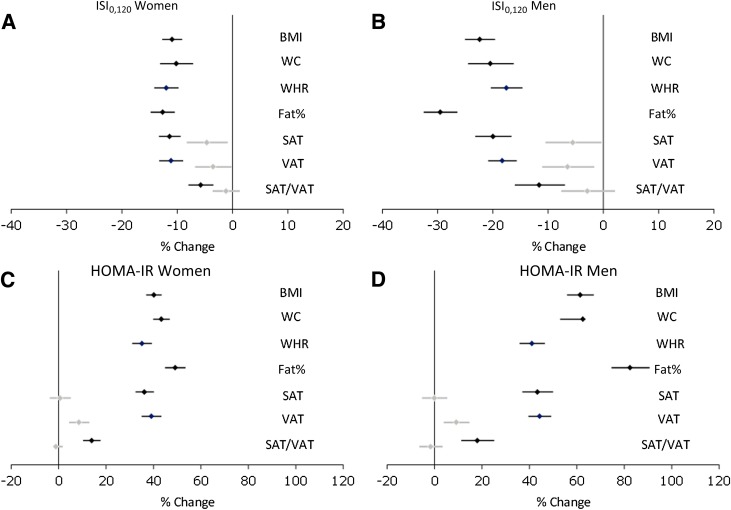
Results: Mean SATs were 1.8 and 3.5 cm in men and women, respectively. Mean VATs were 7.0 and 6.3 cm in men and women, respectively. The total prevalence of type 2 diabetes was 9%. Percentage of body fat generally was most strongly associated with all outcomes. Both SAT and VAT were significantly associated with glucose intolerance, fasting and 2-h plasma glucose levels, HOMA-IR, and ISI0,120. VAT was more strongly associated with all outcomes than was SAT. After further adjustment for BMI or WC, VAT was associated with glucose intolerance and insulin resistance, whereas there was a trend toward a negative or no association with SAT.
Conclusions: High mean values of SAT may to a large extent explain the high WC in Inuit populations, and this is suggested to contribute to the lower observed metabolic risk for a given level of obesity.
Figures
References
-
- Jørgensen ME, Young TK. Cardiovascular diseases, diabetes and obesity. In Health Transitions in Arctic Populations. Young TK, Bjerregaard P, Eds. Toronto, University of Toronto Press, 2008, p. 291–307
-
- Bjerregaard P, Young T. The Circumpolar Inuit. Health of a Population in Transition. Copenhagen, Munksgaard, 1998
-
- Jørgensen ME, Bjerregaard P, Kjaergaard JJ, Borch-Johnsen K. High prevalence of markers of coronary heart disease among Greenland Inuit. Atherosclerosis 2008;196:772–778 - PubMed
-
- Jørgensen ME, Borch-Johnsen K, Witte DR, Bjerregaard P. Diabetes in Greenland and its relationship with urbanization. Diabet Med 2012;29:755–760 - PubMed
Publication types
MeSH terms
LinkOut - more resources
Full Text Sources
Other Literature Sources
Research Materials
