. 2013 Aug;110(3):768-83.
doi: 10.1152/jn.00109.2012. Epub 2013 May 8.

Primary motor cortical discharge during force field adaptation reflects muscle-like dynamics

Affiliations

Primary motor cortical discharge during force field adaptation reflects muscle-like dynamics

Anil Cherian et al. J Neurophysiol. 2013 Aug.

Abstract

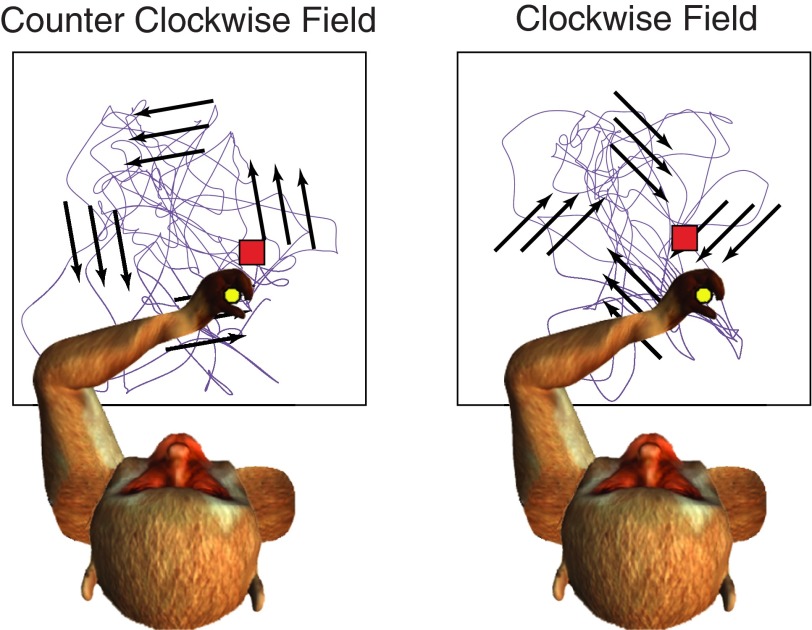
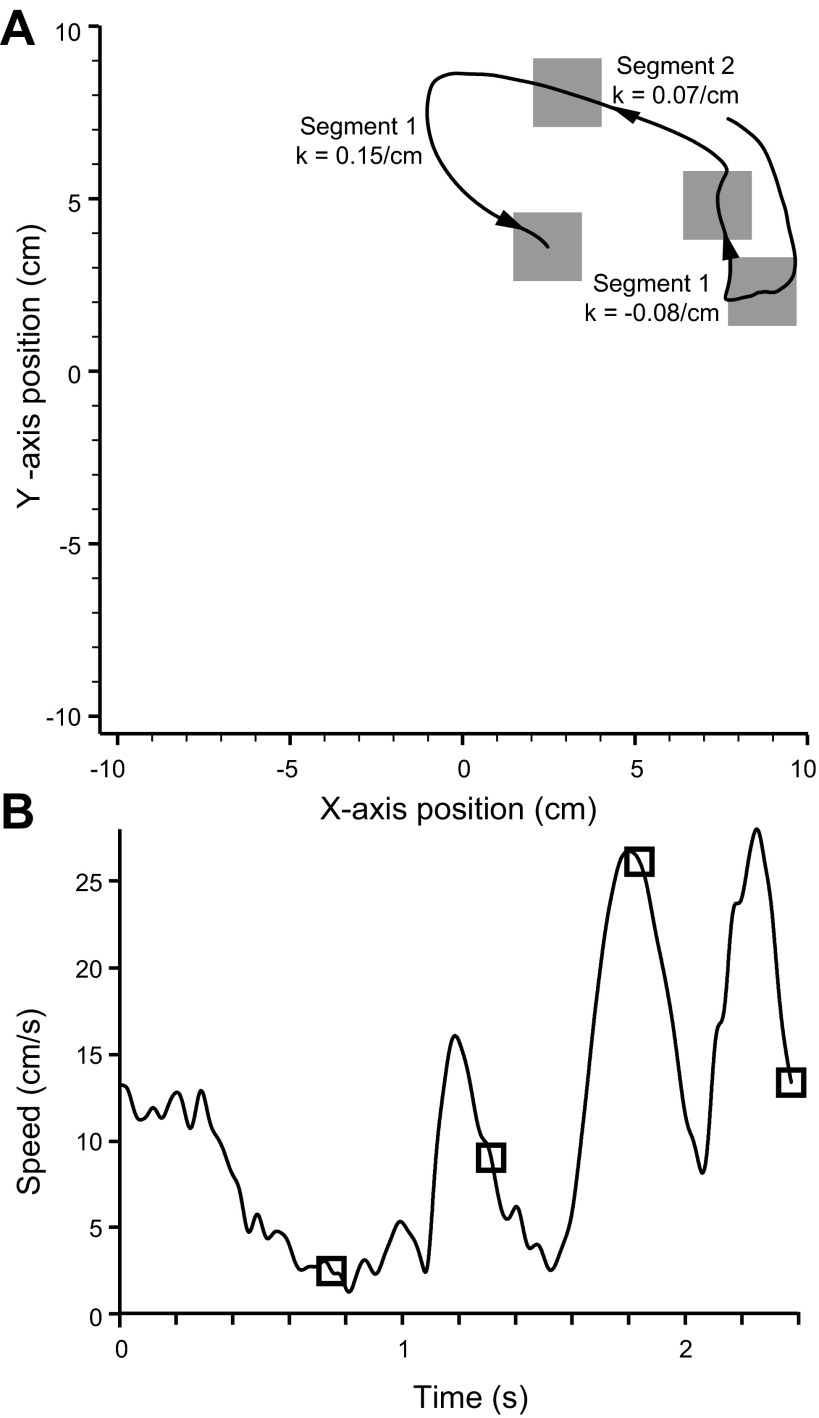
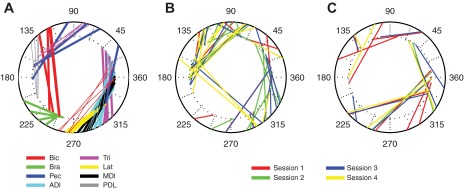
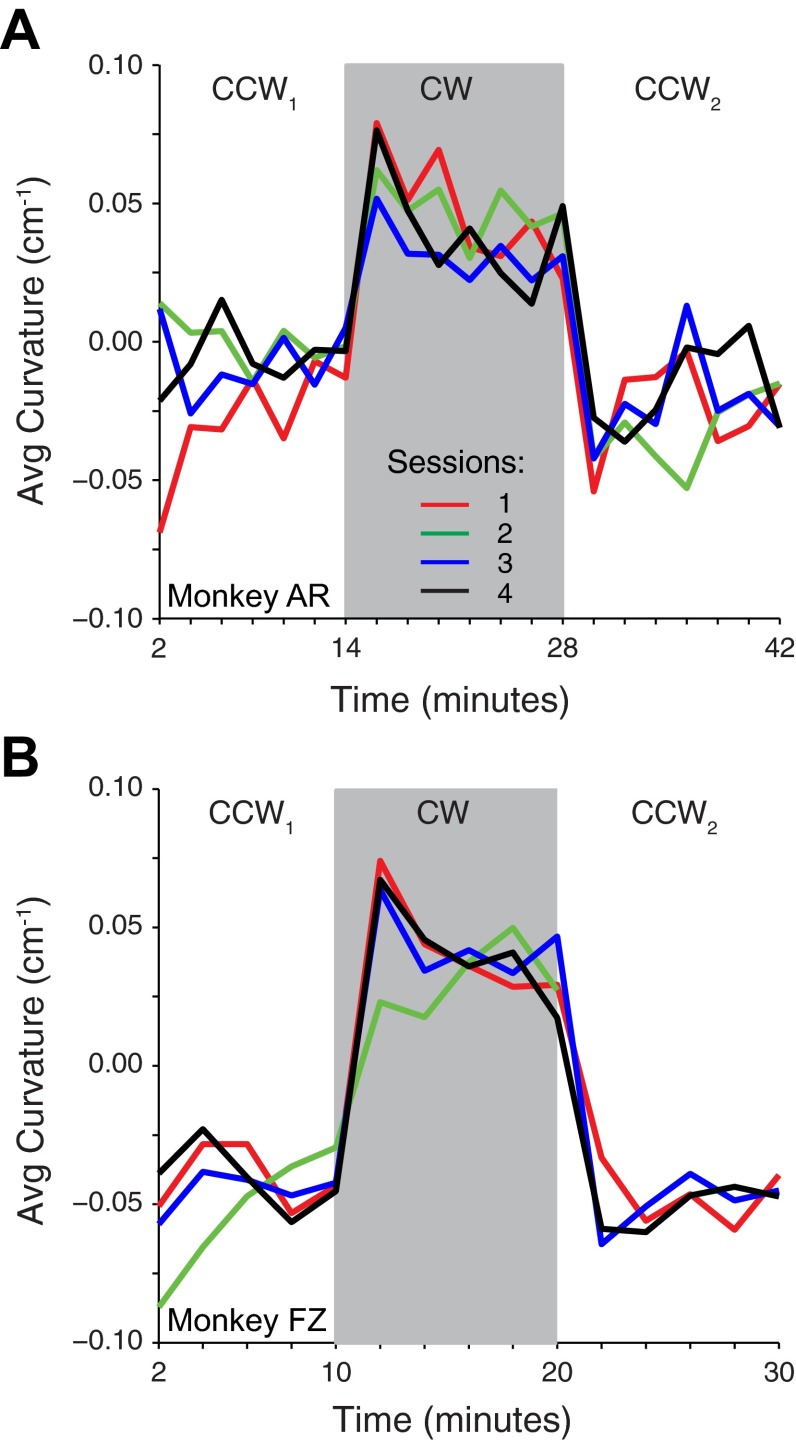
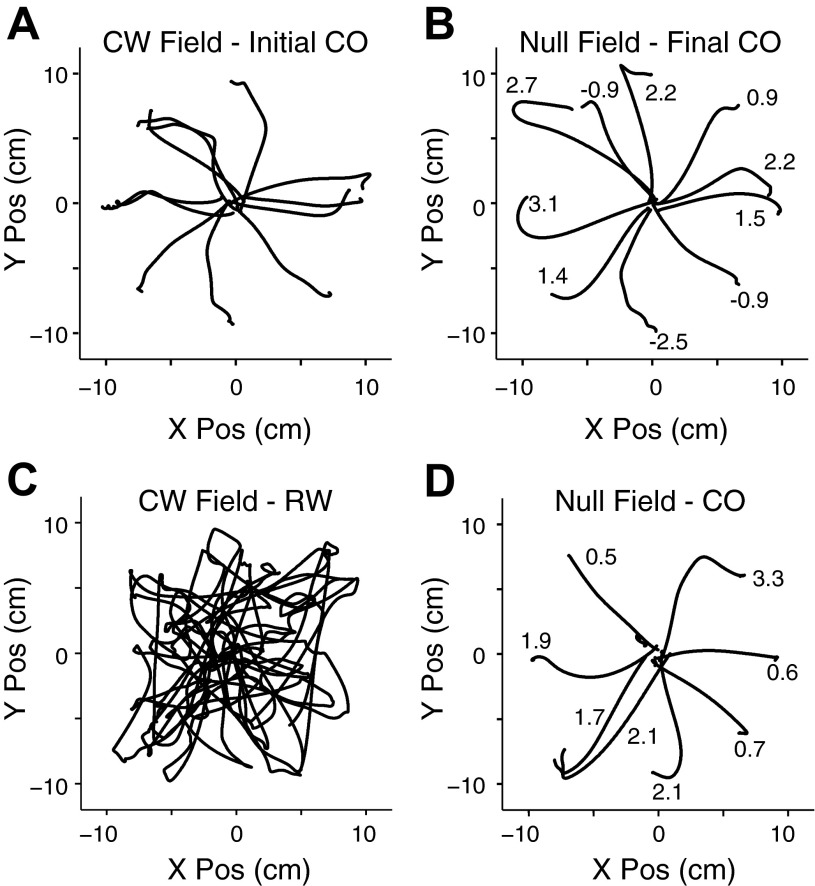
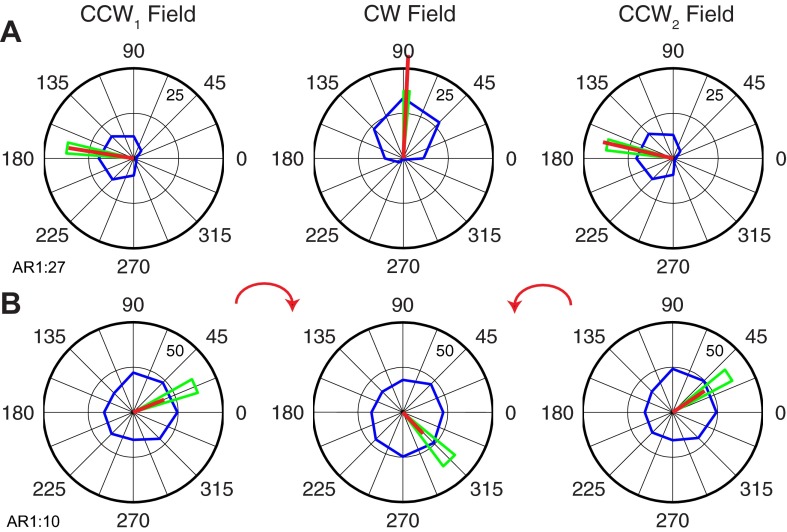
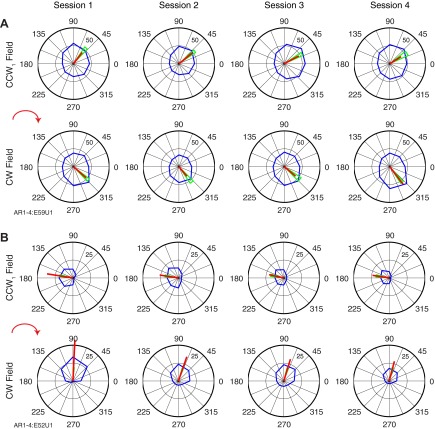
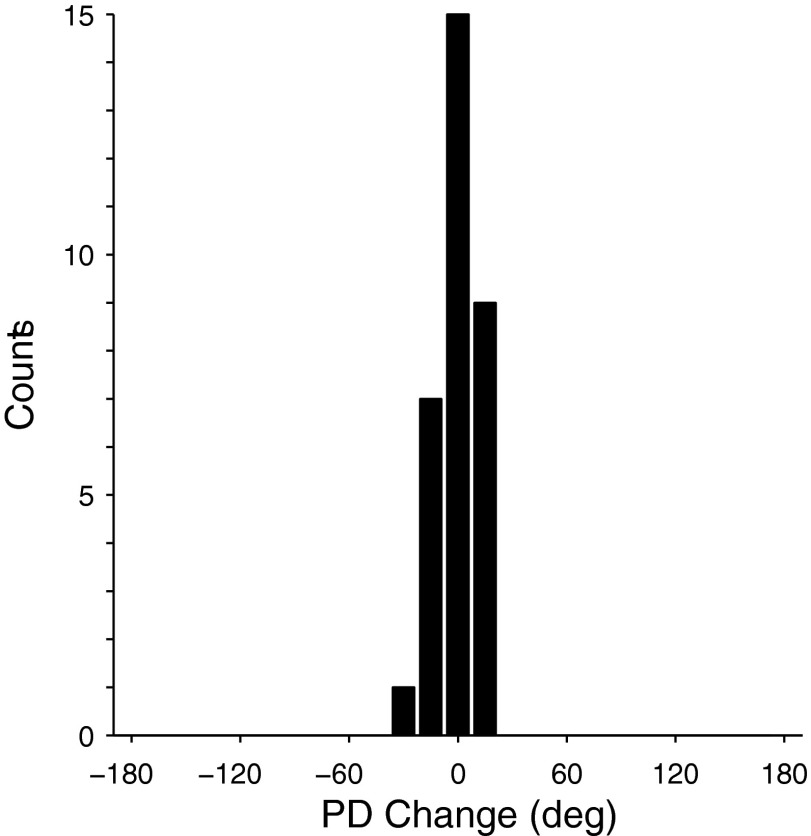
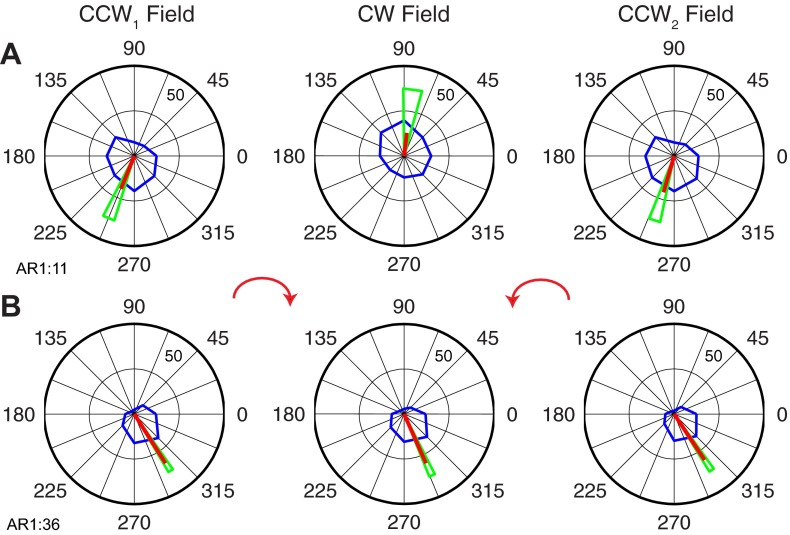
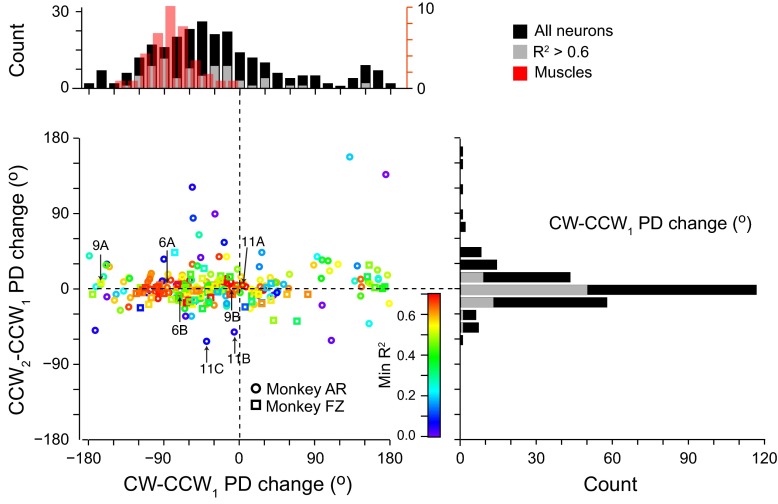
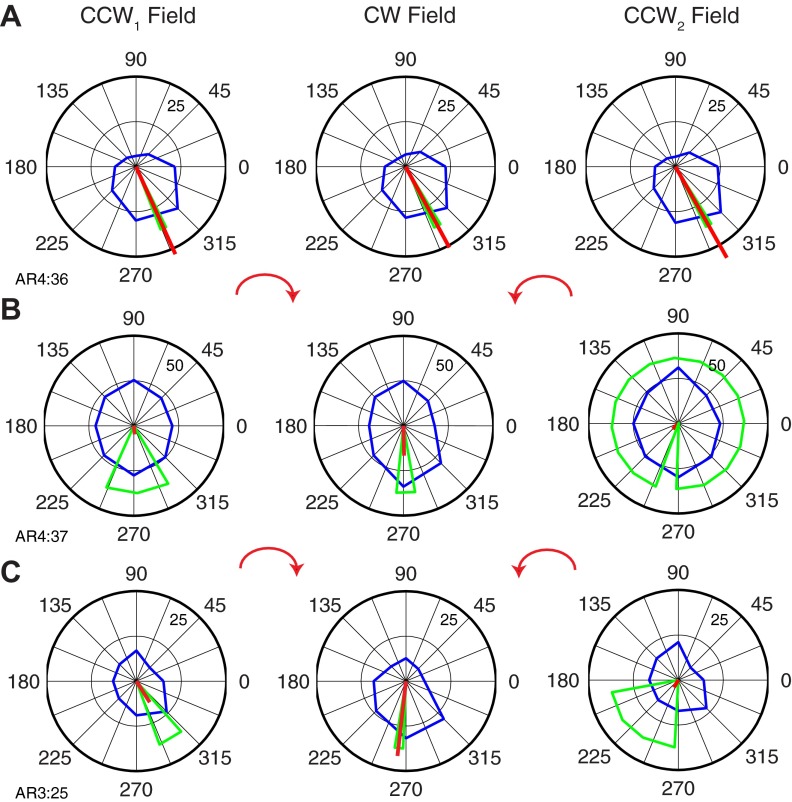
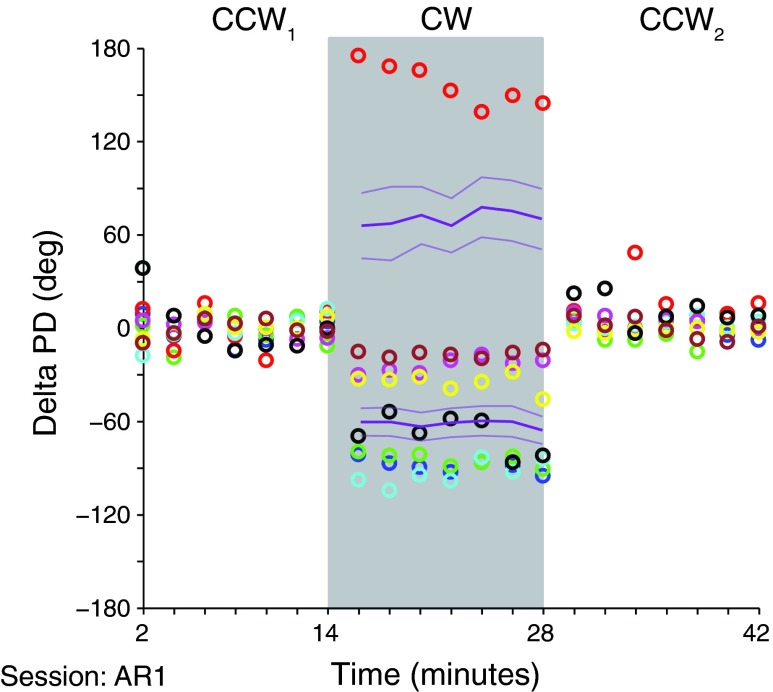
We often make reaching movements having similar trajectories within very different mechanical environments, for example, with and without an added load in the hand. Under these varying conditions, our kinematic intentions must be transformed into muscle commands that move the limbs. Primary motor cortex (M1) has been implicated in the neural mechanism that mediates this adaptation to new movement dynamics, but our recent experiments suggest otherwise. We have recorded from electrode arrays that were chronically implanted in M1 as monkeys made reaching movements under two different dynamic conditions: the movements were opposed by either a clockwise or counterclockwise velocity-dependent force field acting at the hand. Under these conditions, the preferred direction (PD) of neural discharge for nearly all neurons rotated in the direction of the applied field, as did those of proximal limb electromyograms (EMGs), although the median neural rotation was significantly smaller than that of muscles. For a given neuron, the rotation angle was very consistent, even across multiple sessions. Within the limits of measurement uncertainty, both the neural and EMG changes occurred nearly instantaneously, reaching a steady state despite ongoing behavioral adaptation. Our results suggest that M1 is not directly involved in the adaptive changes that occurred within an experimental session. Rather, most M1 neurons are directly related to the dynamics of muscle activation that themselves reflect the external load. It appears as though gain modulation, the differential recruitment of M1 neurons by higher motor areas, can account for the load and behavioral adaptation-related changes in M1 discharge.

Keywords: curl fields; inverse dynamics model; monkey; reaching movements.


Figures

Fig. 1.
Fig. 1.
Schematic representation of the fields experiment. In counterclockwise (CCW) and clockwise (CW) velocity-dependent force fields, the purple curve represents a typical 20-s hand path. Arrows represent the orientation of the fields, 80° for the CCW field and −45° for CW field. Monkeys moved the manipulandum handle in a horizontal plane to control movement of the cursor (yellow circle) on a vertical monitor. Red square denotes the target location.
Fig. 2.
Fig. 2.
Example trajectory of a single trial in the random-target task. A: position plot of a single 4-target sequence within the full 20-cm2 workspace. Arrows indicate direction of movement, and squares denote the target locations. Curvature (k) of each movement segment between targets is indicated. B: speed profile through the course of the trial. Open squares denote the time at which the monkey entered a given target.
Fig. 3.
Fig. 3.
Distribution of the preferred directions in the initial CCW field (CCW1; inner ring) and the CW field (outer ring). A: muscle preferred directions (PDs) for all sessions for monkey AR (thick lines) and monkey FZ (thin lines). Line color indicates the muscle: Bic, biceps; Bra, brachioradialis; Pec, the clavicular head of pectoralis; ADl, MDl, and PDl, anterior, medial, and posterior heads of deltoid; Tri, lateral head of triceps; Lat, latissimus dorsi. B and C: neuronal PDs for monkey AR and monkey FZ, respectively. Only neurons with sinusoidal tuning fits of R2 > 0.60 for all 3 field conditions were included. Line color represents the 4 different sessions.
Fig. 4.
Fig. 4.
Average curvature of 2-min segments throughout 4 experimental sessions for both monkeys. A: data for monkey AR. Note that during the session with the anomalous curvature indicated in red, unlike other sessions, the monkey had worked in the CW field before exposure to the CCW1 field. B: data for monkey FZ. Data for return to the CCW field (CCW2) are not plotted for session 2 (green line), which was ended after only 6 min as a result of the monkey's poor behavior. This may also explain the anomalous curvatures earlier in the session.
Fig. 5.
Fig. 5.
Comparison of aftereffects induced by center-out and random-target tasks. A: 1 min of movements in the center-out task in the presence of a CW field (initial CO). Negative numbers indicate CW deviations; positive numbers indicate CCW deviations. B: initial minute of movements in the center-out task immediately following 10 min of movements in the CW field of the previous center-out task (null field - final CO). C: 1 min of movements in the random-target task in the presence of a CW field (RW). D: initial minute of movements in the center-out task immediately following 10 min of movements in the CW field of the random-target task (null field - CO). Note hooked movements, very similar to those in B, indicating adaptation to the preceding CW field. The peak deviation of each trajectory is listed for each movement.
Fig. 6.
Fig. 6.
Examples of force field-related tuning changes for 2 typical neurons (A and B) in primary motor cortex. The average activity in each 45° bin is represented by the points along the blue line. Magnitude of discharge (pps) corresponding to the outer ring is indicated by the smaller number within the ring near 45°. The red line is the vector sum of the blue points, and the green triangles represent 95% confidence bounds.
Fig. 7.
Fig. 7.
Stability of tuning changes across 4 consecutive experimental days for 2 neurons (A and B). In both A and B, top row represents the tuning in the CCW1 field and bottom row represents the tuning in the CW field. The average activity in each 45° bin is represented by the blue line, whereas the red line is the vector sum of the blue averages. Green triangles represent 95% confidence bounds.
Fig. 8.
Fig. 8.
Histogram of the average PD change for 32 cells followed across 4 sequential experimental days. PD changes were computed for each neuron during the CCW1 for each session. These changes across sessions were then averaged for each neuron.
Fig. 9.
Fig. 9.
Extreme tuning changes of 2 neurons in primary motor cortex. A: neuron with larger than average rotation between the CCW1 and CW fields. B: neuron with smaller than average rotation between the CCW1 and CW fields.
Fig. 10.
Fig. 10.
PD changes across fields. Scatter plot and histograms show changes in PD across the population of neurons in the 2nd and 3rd blocks relative to that of the 1st block. Color scale indicates the R2 of a sinusoidal fit to the bootstrapped samples for each neuron, with the symbol type indicating the monkey. Numbered arrows indicate the location of example neurons from Figs. 6, 9, and 11. Gray bars indicate those neurons for which the minimum R2 value across all field conditions was >0.60. Red bars in top left histogram show the corresponding shifts in muscle tuning curves.
Fig. 11.
Fig. 11.
Examples of force field-related tuning changes for 3 putative memory neurons. A: the single neuron with a tuning curve that was well fitted by a sinusoid and classified as a memory cell. B and C: outlier examples that appeared to have memory characteristics as a result of nonsinusoidal tuning curves and poor PD confidence.
Fig. 12.
Fig. 12.
Repeated tuning estimates for 9 sample neurons from monkey FZ using 2-min segments of data. Solid lines represent averages; dotted lines represent confidence bounds for neurons following separation into those with initially positive and negative rotations between the CCW1 and CW fields, respectively. Of these sample neurons, only one had a change in PD that drifted toward zero during the CW field, during the time when the change in trajectory curvature was also reduced. However, across the neuronal population, there were no systematic drifts that could account for the curvature change.

Similar articles

Cited by

References

    1. Ajemian R, Bullock D, Grossberg S. A model of movement coordinates in the motor cortex: posture-dependent changes in the gain and direction of single cell tuning curves. Cereb Cortex 11: 1124–1135, 2001 - PubMed
    1. Alexander GE, Crutcher MD. Preparation for movement: neural representations of intended direction in three motor areas of the monkey. J Neurophysiol 64: 133–150, 1990 - PubMed
    1. Arce F, Novick I, Mandelblat-Cerf Y, Vaadia E. Neuronal correlates of memory formation in motor cortex after adaptation to force field. J Neurosci 30: 9189–9198, 2010 - PMC - PubMed
    1. Bhushan N, Shadmehr R. Computational nature of human adaptive control during learning of reaching movements in force fields. Biol Cybern 81: 39–60, 1999 - PubMed
    1. Brashers-Krug T, Shadmehr R, Bizzi E. Consolidation in human motor memory. Nature 382: 252–255, 1996 - PubMed

Publication types

LinkOut - more resources