

Review
doi: 10.1038/nrg3454.
Epub 2013 May 9.
Exploring the three-dimensional organization of genomes: interpreting chromatin interaction data
Affiliations
- PMID: 23657480
- PMCID: PMC3874835
- DOI: 10.1038/nrg3454
Item in Clipboard
Review
Exploring the three-dimensional organization of genomes: interpreting chromatin interaction data
Nat Rev Genet.
2013 Jun.
Abstract
How DNA is organized in three dimensions inside the cell nucleus and how this affects the ways in which cells access, read and interpret genetic information are among the longest standing questions in cell biology. Using newly developed molecular, genomic and computational approaches based on the chromosome conformation capture technology (such as 3C, 4C, 5C and Hi-C), the spatial organization of genomes is being explored at unprecedented resolution. Interpreting the increasingly large chromatin interaction data sets is now posing novel challenges. Here we describe several types of statistical and computational approaches that have recently been developed to analyse chromatin interaction data.
Figures
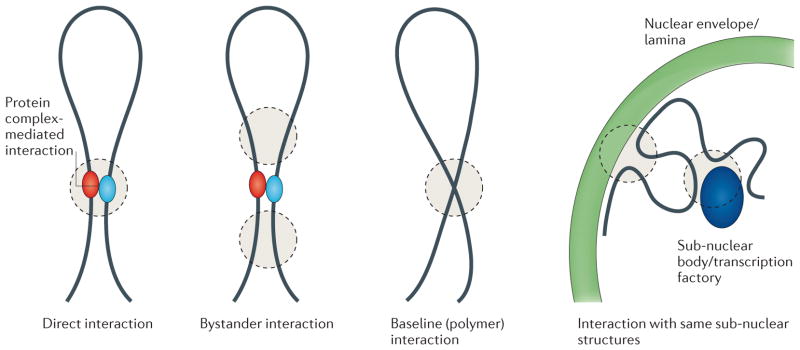
3C-based technologies capture loci that are in close spatial proximity. Various biologically and structurally distinct examples are shown in which loci are in close spatial proximity. Analysis and interpretation of 3C data sets needs to take these different scenarios in consideration.
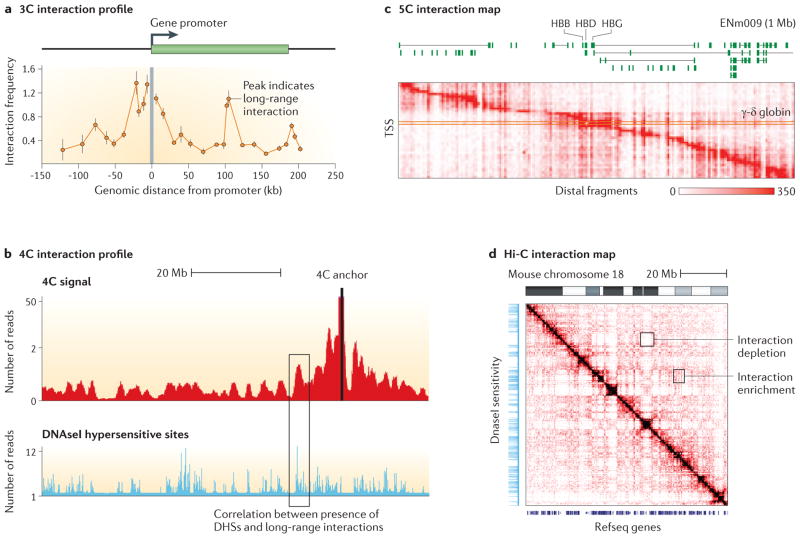
A. 3C data for the CFTR gene in Caco2 cells , B. 4C data (simulated from data from Zhang et al. ). C. An example of a 5C interaction map for the ENm009 region in K562 cells . Each row represents an interaction profile of a transcription start site (TSS) across the 1 Mb region on human chromosome 11 that contains the beta-globin locus. D. Hi-C from Zhang et al. . 3C and 4C data are linear profiles along chromosomes and can be directly compared to other genomic tracks such as DNAseI sensitivity. 5C and Hi-C data are often represented as two-dimensional heatmaps. Other genomic features, such as positions of genes or the location of DNAseI hypersensitive sites, can be displayed along the axes for visual analysis of chromosome structural features. DNAse I data from the laboratory of Dr. Stamaoryannopoulos .
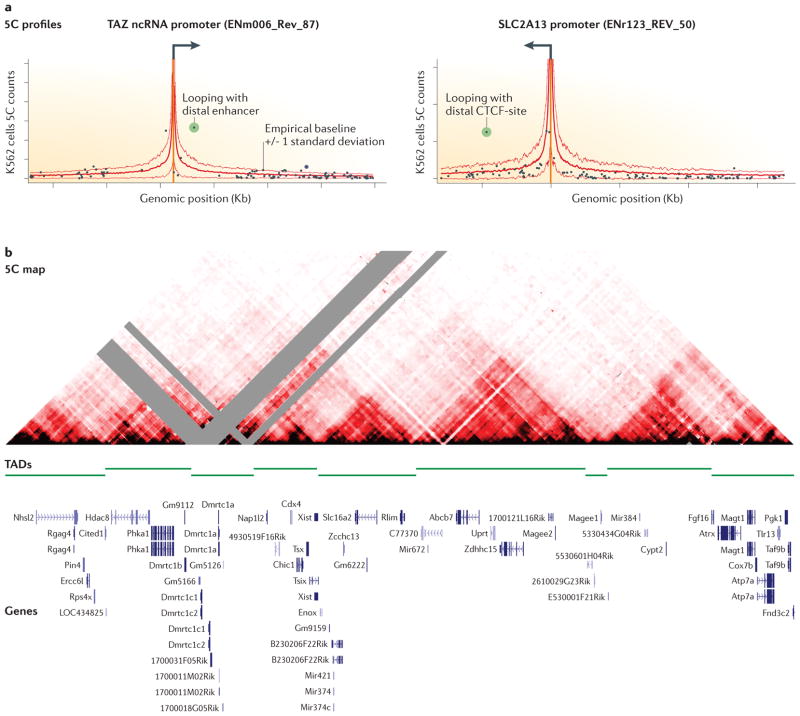
A. Examples of long-range interaction profiles in the human genome as determined by 5C (data from ). The orange vertical bar indicates the position of the gene promoters, the solid red line indicates the empirically estimated level of baseline interactions (thin red lines indicate baseline plus/minus one standard deviation). The presence of a looping interaction is inferred when a pair of loci interact statistically more frequently than expected based on the baseline frequency. The green data points represent significant looping interactions. B. A dense 5C interaction map of a 4.5 Mb region on the mouse X chromosome containing the X-chromosome inactivation center (data from ). In red is the interaction frequency between pairs of loci, grey represents missing data due to low mappability. The interaction map is cut in half at the diagonal to facilitate alignment with genomic features. Visual inspection reveals the presence of triangles, which correspond to regions (topologically associating domains, TADs) in which loci interact frequently with each other. Loci located in different TADs do not interaction frequently. TAD boundaries have been determined by computationally determining the asymmetry between up- and down stream interactions around them .
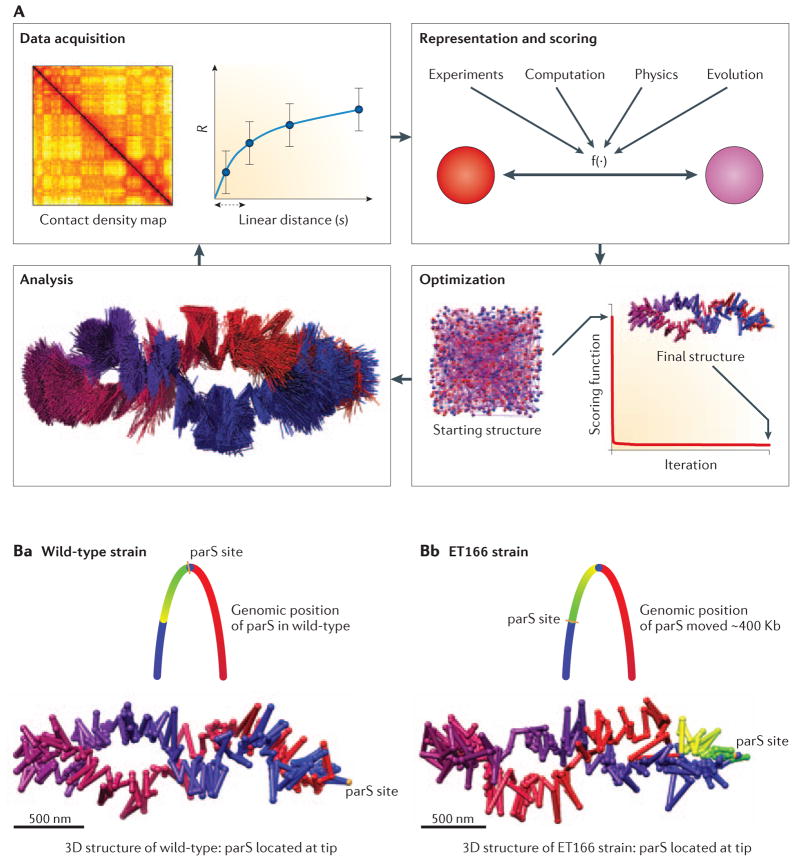
A. Iterative and integrative process for model building. The iterative process consists of data acquisition, model representation and scoring, model optimization, and model analysis. B. 3D model of the wild-type Caulobacter genome highlighting the position of the parS site located at the tip of the elliptical 3D structure of the genome. C. 3D model of the ET166 strain where the parS site has been moved ~400Kb of its original locus (indicated in the schematic diagram of the genome). In the 3D structure of genome of the ET166 strain the parS site are found at the tip of the structure again, which required a genome-wide rotation. The 3D models of Caulobacter are described in . Models in panels A, B and C are reproduced from , with permission.
A Whole-genome map of relative contact probabilities obtained by Hi-C (normalized by ICE ). Insets show two most prominent features: intra-chromosomal decline of the contact probability; and a compartment pattern of interactions observed inter- and intra-chromosomally. B Contact probability P(s) as a function of genomic separation s. The mean contact probability for each separation is shown by the blue line, with the distribution shown by 75%-quantiles in light blue. Pink line show P(s)~s−1 scaling. Two characteristics regimes corresponding to TADs (<0.7Mb) and the fractal globule (between 0.7 and 7Mb) are labeled. C (Top) Polymer model of the fractal globule of 10Mb (one monomer representing 2 nucleosomes) with 1Mb region shown in blue, illustrating its compactness within the globule. The same region in the equilibrium globule (bottom) is delocalized.
References
-
- Dekker J, Rippe K, Dekker M, Kleckner N. Capturing Chromosome Conformation. Science. 2002;295:1306–1311. - PubMed
Publication types
MeSH terms
Substances
Grants and funding
LinkOut - more resources
Full Text Sources
Other Literature Sources
