. 2013 Jul;24(13):2146-55.
doi: 10.1091/mbc.E13-03-0130. Epub 2013 May 8.

Chemoattractant stimulation of TORC2 is regulated by receptor/G protein-targeted inhibitory mechanisms that function upstream and independently of an essential GEF/Ras activation pathway in Dictyostelium

Affiliations

Chemoattractant stimulation of TORC2 is regulated by receptor/G protein-targeted inhibitory mechanisms that function upstream and independently of an essential GEF/Ras activation pathway in Dictyostelium

Xin-Hua Liao et al. Mol Biol Cell. 2013 Jul.

Abstract

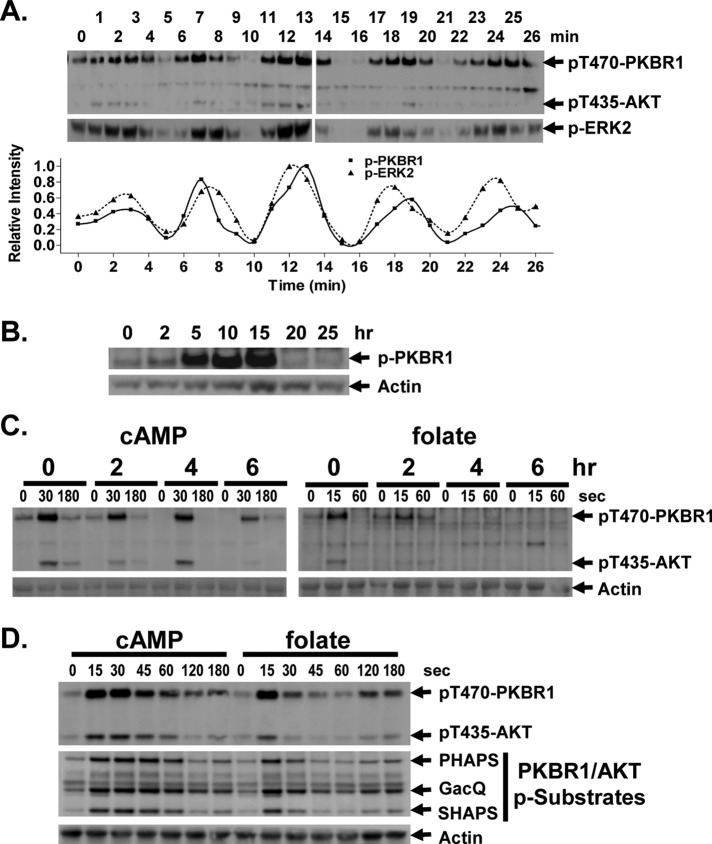
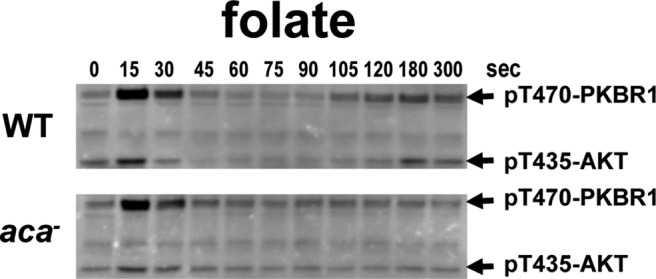
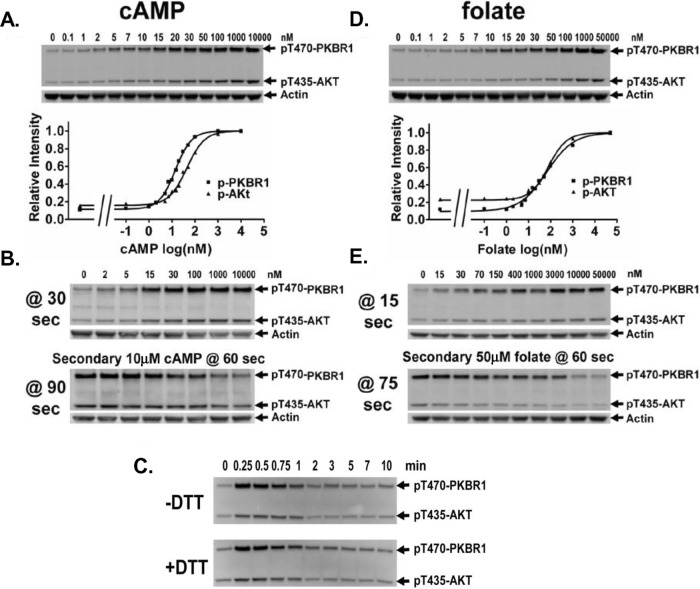
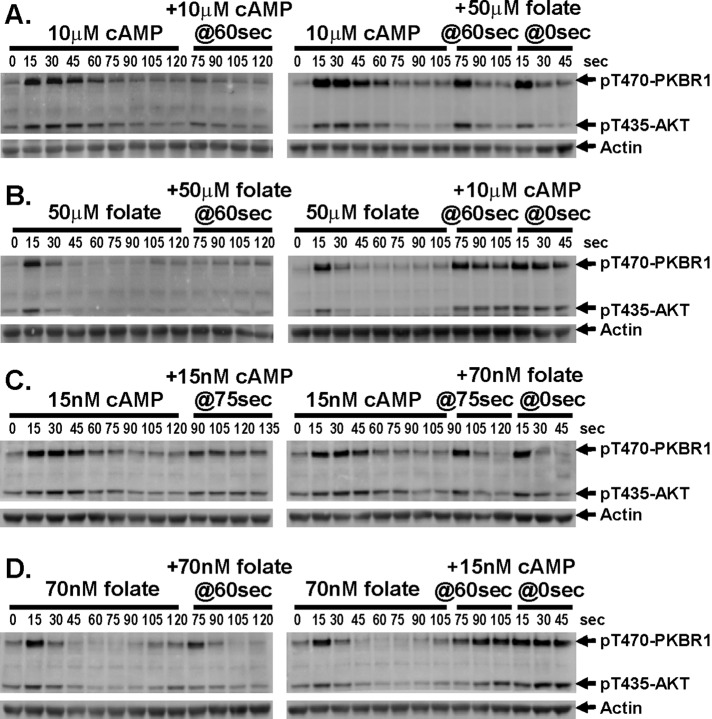
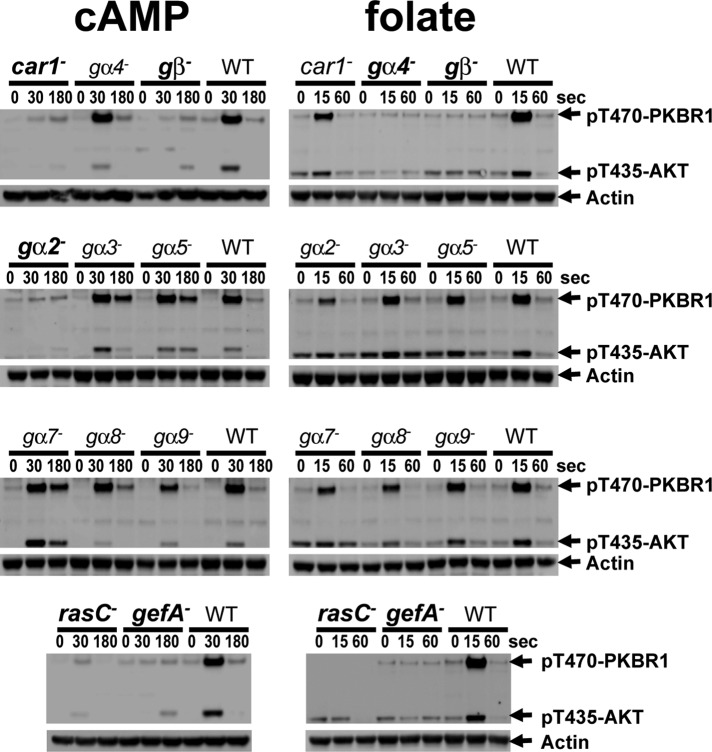
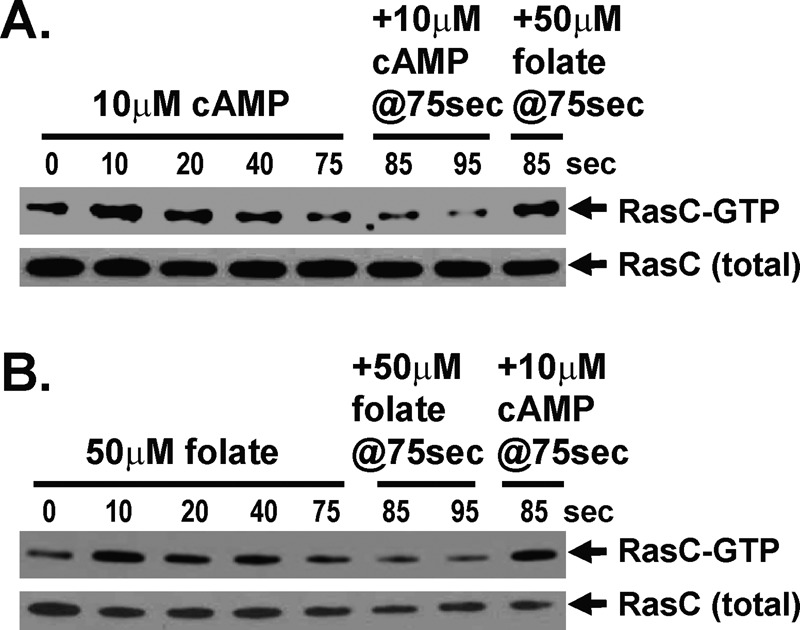
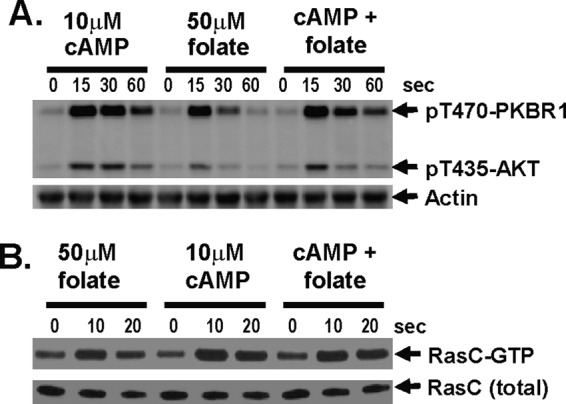
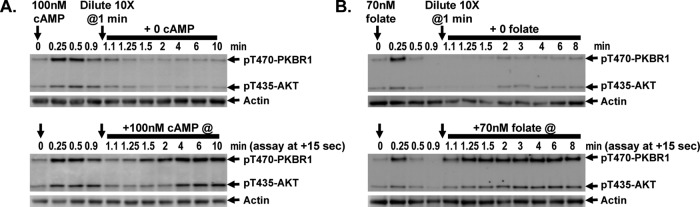
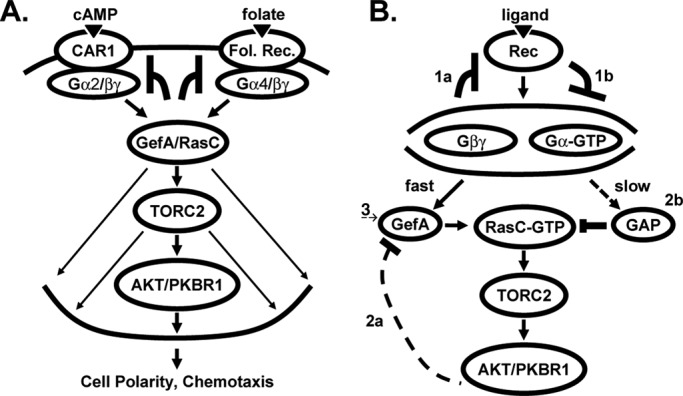
Global stimulation of Dictyostelium with different chemoattractants elicits multiple transient signaling responses, including synthesis of cAMP and cGMP, actin polymerization, activation of kinases ERK2, TORC2, and phosphatidylinositide 3-kinase, and Ras-GTP accumulation. Mechanisms that down-regulate these responses are poorly understood. Here we examine transient activation of TORC2 in response to chemically distinct chemoattractants, cAMP and folate, and suggest that TORC2 is regulated by adaptive, desensitizing responses to stimulatory ligands that are independent of downstream, feedback, or feedforward circuits. Cells with acquired insensitivity to either folate or cAMP remain fully responsive to TORC2 activation if stimulated with the other ligand. Thus TORC2 responses to cAMP or folate are not cross-inhibitory. Using a series of signaling mutants, we show that folate and cAMP activate TORC2 through an identical GEF/Ras pathway but separate receptors and G protein couplings. Because the common GEF/Ras pathway also remains fully responsive to one chemoattractant after desensitization to the other, GEF/Ras must act downstream and independent of adaptation to persistent ligand stimulation. When initial chemoattractant concentrations are immediately diluted, cells rapidly regain full responsiveness. We suggest that ligand adaptation functions in upstream inhibitory pathways that involve chemoattractant-specific receptor/G protein complexes and regulate multiple response pathways.


Figures

FIGURE 1:
FIGURE 1:
Chemoattractant-mediated TORC2 phosphorylation of AKT and PKBR1. (A) Spontaneous oscillations of AKT, PKBR1, and ERK2 phosphorylation in Dictyostelium. Cells were pulsed with a 75 nM final concentration of cAMP every 6 min for 6 h. Cells were washed, resuspended in fresh buffer, and incubated without exogenous cAMP to allow spontaneous oscillations. Aliquots were collected at 1-min intervals and AKT, PKBR1, and ERK2 phosphorylations assayed by immunoblot. For p-ERK2 we used an antibody specific to the phospho-form of ERK2. For TORC2, we used an antibody that recognizes the TORC2-phosphorylated C-terminal sequence identical in both AKT and PKBR1 (FEGFpTYVA [pT435 for AKT and pT470 for PKBR1]). Relative phosphorylation changes were quantified. (B) Phosphorylation of PKBR1 during development. PKBR1 phosphorylation and actin levels were assayed by immunoblot during development at the times indicated. (C) Response of AKT and PKBR1 phosphorylation to cAMP and folate at different developmental stages. Cells were collected at times of differentiation in shaking culture, as indicated, washed of endogenous ligands, treated with caffeine to inhibit adenylyl cyclase, and washed. Cells were then stimulated with 10 μM cAMP or 50 μM folate. TORC2 phosphorylation of AKT and PKBR1 was assayed by immunoblot at the times indicated. (D) Cells at 0 h of development are equivalently responsive to folate and cAMP. Cells were stimulated with 10 μM cAMP or 50 μM folate. TORC2 phosphorylation of AKT and PKBR1 was assayed by immunoblot at the times indicated. For quantification, see Supplemental Figure S1. PHAPS, GacQ, and SHAPS indicate substrates phosphorylated by AKT/PKBR1 and assayed by immunoblot.
FIGURE 2:
FIGURE 2:
Secondary activation of TORC2 phosphorylation of AKT and PKBR1 after folate stimulation is caused by increases in cAMP. WT and aca-null cells were stimulated with 50 μM folate, and TORC2 phosphorylation of AKT and PKBR1 was assayed by immunoblot at the times indicated. For quantification, see Supplemental Figure S2.
FIGURE 3:
FIGURE 3:
Adaptation of TORC2 activation to cAMP and folate. (A) cAMP dose–response activation of AKT and PKBR1. Cells were treated with various concentrations of cAMP and samples collected after 30 s. TORC2 phosphorylation of AKT and PKBR1 was assayed by immunoblot at the doses indicated and relative phosphorylation levels quantified. The EC50 for TORC2 phosphorylation of PKBR1 is 15 nM cAMP and is 45 nM cAMP for phosphorylation of AKT. For quantification, see Supplemental Figure S3A. (B) Response to a secondary saturating cAMP stimulus is inversely related to initial cAMP dose. Cells were treated with various concentrations of cAMP and samples collected after 30 s, followed by a second 10 μM cAMP stimulus at 60 s, with samples collected 30 s later, at 90 s. TORC2 phosphorylation of AKT and PKBR1 was assayed by immunoblot. For quantification, see Supplemental Figure S3A. (C) Adaptation of AKT and PKBR1 phosphorylation is not the result of cAMP degradation. Cells treated with or without DTT were stimulated with 10 μM cAMP, and TORC2 phosphorylation of AKT and PKBR1 was assayed by immunoblot at the times indicated. (D) Folate dose–response activation of AKT and PKBR1. Cells were treated with various concentrations of folate and samples collected after 15 s. TORC2 phosphorylation of AKT and PKBR1 was assayed by immunoblot at the doses indicated and relative phosphorylation levels quantified. The EC50 for TORC2 phosphorylation of PKBR1 is 65 nM folate and is 80 nM folate for phosphorylation of AKT. For quantification, see Supplemental Figure S3B. (E) Response to a secondary saturating folate stimulus is inversely related to the initial folate dose. Cells were treated with various concentrations of folate, with samples collected after 15 s, followed by a second 50 μM folate stimulus at 60 s, with samples collected 15 s later, at 75 s. TORC2 phosphorylation of AKT and PKBR1 was assayed by immunoblot. For quantification, see Supplemental Figure S3B.
FIGURE 4:
FIGURE 4:
TORC2 phosphorylation of AKT and PKBR1 does not cross-adapt to different chemoattractants. (A) Cells stimulated with saturating doses of cAMP remain responsive to folate. Cells were stimulated with 10 μM cAMP and then stimulated with either 10 μM cAMP or 50 μM folate at 60 s. As a control, cells were stimulated with 50 μM folate at 0 s. TORC2 phosphorylation of AKT and PKBR1 was assayed by immunoblot at the times indicated. For quantification, see Supplemental Figure S4A. (B) Cells stimulated with saturating doses of folate remain responsive to cAMP. Cells were stimulated with 50 μM folate and then stimulated with either 50 μM folate or 10 μM cAMP at 60 s. As a control, cells were stimulated with 10 μM cAMP at 0 s. TORC2 phosphorylation of AKT and PKBR1 was assayed by immunoblot at the times indicated. For quantification, see Supplemental Figure S4B. (C) Cells stimulated with subsaturating doses of cAMP remain responsive to subsaturating doses of folate. Cells were stimulated with 15 nM cAMP and then stimulated with either 15 nM cAMP or 70 nM folate at 75 s. As a control, cells were stimulated with 70 nM folate at 0 s. TORC2 phosphorylation of AKT and PKBR1 was assayed by immunoblot at the times indicated. For quantification, see Supplemental Figure S4C. (D) Cells stimulated with subsaturating doses of folate remain responsive to subsaturating doses cAMP. Cells were stimulated with 70 nM folate and then stimulated with either 70 nM folate or 15 nM cAMP at 60 s. As a control, cells were stimulated with 15 nM cAMP at 0 s. TORC2 phosphorylation of AKT and PKBR1 was assayed by immunoblot at the times indicated. For quantification, see Supplemental Figure S4D.
FIGURE 5:
FIGURE 5:
cAMP and folate use different receptors and G protein couplings but the same GEF/Ras pathway to mediate AKT and PKBR1 phosphorylation. Strains deficient for different signaling components were stimulated with 50 μM folate in starvation buffer or with 10 μM cAMP after differentiation for 6 h in shaking culture with cAMP pulses. TORC2 phosphorylation of AKT and PKBR1 was assayed by immunoblot at the times indicated. Genotypes in bold indicate cells that are unresponsive to active TORC2 by either cAMP or folate.
FIGURE 6:
FIGURE 6:
RasC activation does not cross-adapt to different chemoattractants. (A) Cells stimulated with saturating doses of cAMP remain responsive to folate. FLAG-RasC–expressing cells were stimulated with 10 μM cAMP and then stimulated with either 10 μM cAMP or 50 μM folate at 75 s. RasC-GTP levels were determined by interaction-specific affinity and normalized to total RasC by α-FLAG immunoblot assay at the times indicated. For quantification, see Supplemental Figure S5A. (B) Cells stimulated with saturating doses of folate remain responsive to cAMP. FLAG-RasC–expressing cells were stimulated with 50 μM folate and then stimulated with either 50 μM folate or 10 μM cAMP at 75 s. RasC-GTP levels were determined by interaction-specific affinity and normalized to total RasC by α-FLAG immunoblot assay at the times indicated. For quantification, see Supplemental Figure S5B.
FIGURE 7:
FIGURE 7:
TORC2 and RasC responses to folate and cAMP are nonadditive. (A) AKT and PKBR1 phosphorylations are nonadditive in response to a mixture of saturated cAMP and folate. Cells were stimulated either with 10 μM cAMP plus 50 μM folate or 10 μM cAMP plus 50 μM folate. TORC2 phosphorylation of AKT and PKBR1 was assayed by immunoblot at the times indicated. For quantification, see Supplemental Figure S6A. (B) RasC activation is nonadditive in response to a mixture of saturated cAMP and folate. FLAG-RasC–expressing cells were stimulated either with 50 μM folate plus 10 μM cAMP, or 50 μM folate plus 10 μM cAMP. RasC-GTP levels were determined by interaction-specific affinity and normalized to total RasC by α-FLAG immunoblot assay at the times indicated. For quantification, see Supplemental Figure S6B.
FIGURE 8:
FIGURE 8:
Very rapid deadaptation of TORC2 to cAMP and folate. (A) Cells become rapidly (<2 min) reresponsive to cAMP. Cells were stimulated with 100 nM cAMP, and TORC2 phosphorylation of AKT and PKBR1 was assayed by immunoblot at the times indicated. At 1 min, cells were diluted 10× into buffer to reduce cAMP to ∼10 nM. Cells were either maintained without additional cAMP or stimulated one time with 100 nM cAMP at each of the times indicated and samples removed after an additional 15 s, and TORC2 phosphorylation of AKT and PKBR1 was assayed by immunoblot. For quantification, see Supplemental Figure S7A. (B) Cells become rapidly (<1 min) reresponsive to folate. Cells were stimulated with 70 nM folate, and TORC2 phosphorylation of AKT and PKBR1 was assayed by immunoblot at the times indicated. At 1 min, cells were diluted 10× into buffer to reduce folate to ∼7 nM. Cells were either maintained without additional folate or stimulated one time with 70 nM folate at each of the times indicated and samples removed after an additional 15 s, and TORC2 phosphorylation of AKT and PKBR1 was assayed by immunoblot. For quantification, see Supplemental Figure S7B.
FIGURE 9:
FIGURE 9:
RasC/TORC2 regulation by chemokine signaling. (A) cAMP binds receptor CAR1 and induces dissociation of its coupled heterotrimeric G protein complex Gα2/βγ. Folate binds its receptor and dissociates its coupled heterotrimeric G protein complex Gα4/βγ. Both cAMP and folate use the same GefA-RasC axis to mediate AKT and PKBR1 phosphorylation by TORC2. Because cAMP and folate do not exhibit cross-inhibition, we suggest that adaptation must occur upstream and independently of GefA/RasC, potentially via the cAMP and folate receptors and their respective G protein complexes. (B) Receptor stimulation leads to G protein activation and dissociation. Many downstream pathways in Dictyostelium require signaling via Gβγ, although involvement of Gα-GTP is not excluded. RasC-GTP is required to activate TORC2. Subsequently, TORC2 activity may be suppressed through 1) adaptive responses that are specific to individual receptor/G protein complexes or 2) inhibitory down-regulation of RasC-GTP levels. Adaptation: 1a) Negative feedback regulation after G protein activation; 1b) delayed feedforward activation of an inhibitory signal that can sequester or inactivate specific G protein subunits. RasC down-regulation: 2a) Negative feedback regulation of the GefA activator (Charest et al., 2010); 2b) slow, feedforward activation of an inhibitory rasGAP (Zhang et al., 2008; Takeda et al., 2012). 3) Because folate and cAMP are not cross-adaptive (A), we propose that any inhibitory effects that are mediated via GefA (2a) or rasGAP (2b) must be transient, allowing reversal of GefA/rasGAP (or PPase) activity to an initial basal state (Figure 8 and Supplemental Figure S7). The adaptive receptor/G protein circuits (1) are thus the primary pathways that maintain ligand-specific desensitization of the RasC/TORC2 pathway but coordinate with downstream signaling (2, 3).

Similar articles

Cited by

References

    1. Brzostowski JA, Kimmel AR. Nonadaptive regulation of ERK2 in Dictyostelium: implications for mechanisms of cAMP relay. Mol Biol Cell. 2006;17:4220–4227. - PMC - PubMed
    1. Brzostowski JA, Parent CA, Kimmel AR. A G alpha-dependent pathway that antagonizes multiple chemoattractant responses that regulate directional cell movement. Genes Dev. 2004;18:805–815. - PMC - PubMed
    1. Cai H, Das S, Kamimura Y, Long Y, Parent CA, Devreotes PN. Ras-mediated activation of the TORC2-PKB pathway is critical for chemo­taxis. J Cell Biol. 2010;190:233–245. - PMC - PubMed
    1. Cai H, Devreotes PN. Moving in the right direction: how eukaryotic cells migrate along chemical gradients. Semin Cell Dev Biol. 2011;22:834–841. - PMC - PubMed
    1. Chakrabarti S, Regec A, Gintzler AR. Chronic morphine acts via a protein kinase C(gamma)-G(beta)-adenylyl cyclase complex to augment phosphorylation of G(beta) and G(betagamma) stimulatory adenylyl cyclase signaling. Brain Res Mol Brain Res. 2005;138:94–103. - PubMed

Publication types

MeSH terms

Substances

LinkOut - more resources