

Bone marrow fat quantification in the presence of trabecular bone: initial comparison between water-fat imaging and single-voxel MRS
- PMID: 23657998
- PMCID: PMC3759615
- DOI: 10.1002/mrm.24775
Bone marrow fat quantification in the presence of trabecular bone: initial comparison between water-fat imaging and single-voxel MRS
Abstract
Purpose: The purpose of the present study was to test the relative performance of chemical shift-based water-fat imaging in measuring bone marrow fat fraction in the presence of trabecular bone, having as reference standard the single-voxel magnetic resonance spectroscopy (MRS).
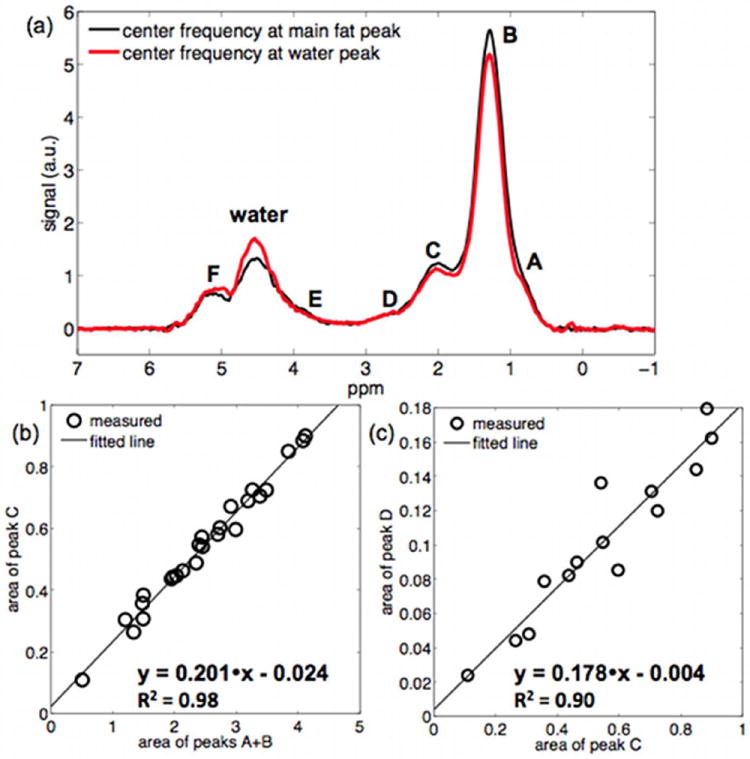
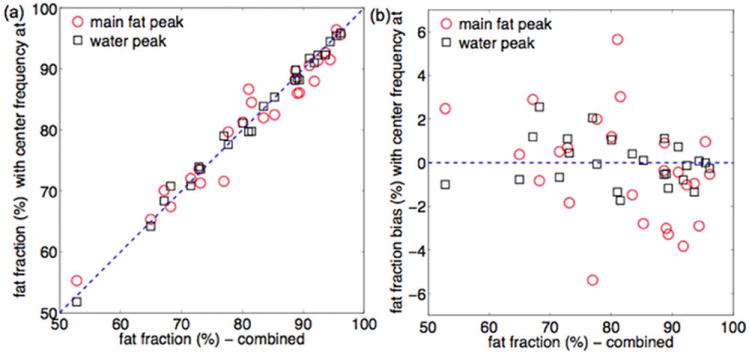
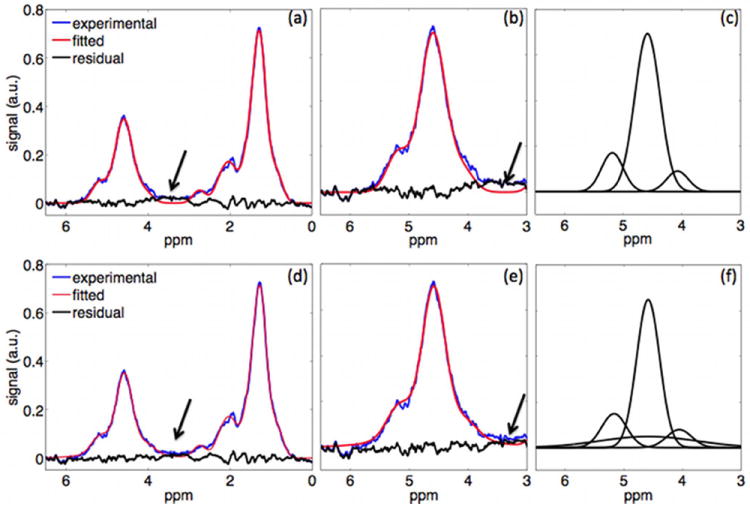
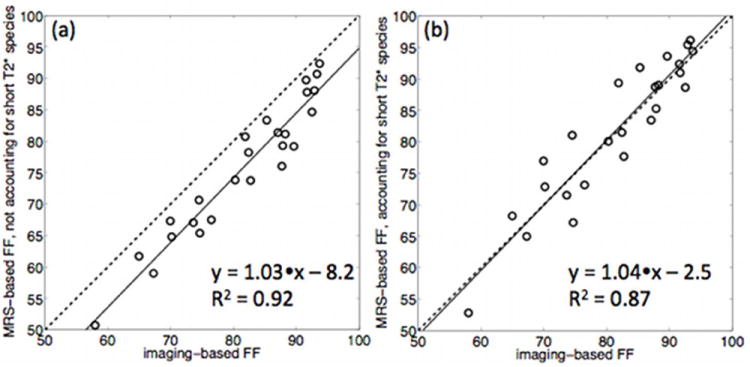
Methods: Six-echo gradient echo imaging and single-voxel MRS measurements were performed on the proximal femur of seven healthy volunteers. The bone marrow fat spectrum was characterized based on the magnitude of measurable fat peaks and an a priori knowledge of the chemical structure of triglycerides, in order to accurately extract the water peak from the overlapping broad fat peaks in MRS. The imaging-based fat fraction results were then compared to the MRS-based results both without and with taking into consideration the presence of short T2* water components in MRS.
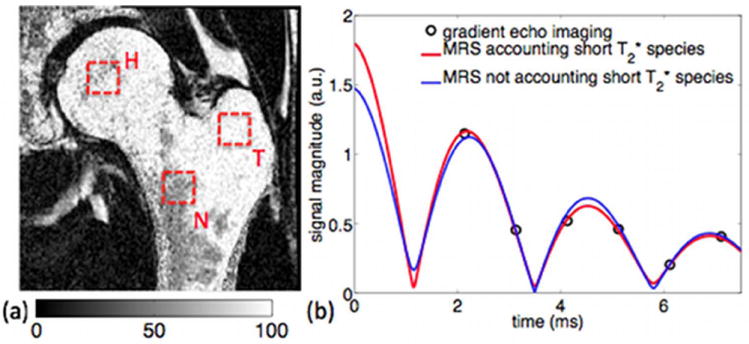
Results: There was a significant underestimation of the fat fraction using the MRS model not accounting for short T2* species with respect to the imaging-based fat fraction. A good equivalency was observed between the fat fraction using the MRS model accounting for short T2* species and the imaging-based fat fraction (R(2) = 0.87).
Conclusion: The consideration of the short T2* water species effect on bone marrow fat quantification is essential when comparing MRS-based and imaging-based fat fraction results.
Copyright © 2013 Wiley Periodicals, Inc.
Figures
References
-
- Baum T, Yap SP, Karampinos DC, Nardo L, Kuo D, Burghardt AJ, Masharani UB, Schwartz AV, Li X, Link TM. Does vertebral bone marrow fat content correlate with abdominal adipose tissue, lumbar spine bone mineral density, and blood biomarkers in women with type 2 diabetes mellitus? J Magn Reson Imaging. 2012;35(1):117–124. - PMC - PubMed
-
- Griffith JF, Yeung DKW, Antonio GE, Lee FKH, Hong AWL, Wong SYS, Lau EMC, Leung PC. Vertebral bone mineral density, marrow perfusion, and fat content in healthy men and men with osteoporosis: dynamic contrast-enhanced MR imaging and MR spectroscopy. Radiology. 2005;236(3):945–951. - PubMed
-
- Griffith JF, Yeung DKW, Antonio GE, Wong SYS, Kwok TCY, Woo J, Leung PC. Vertebral marrow fat content and diffusion and perfusion indexes in women with varying bone density: MR evaluation. Radiology. 2006;241(3):831–838. - PubMed
-
- Pichardo JC, Milner RJ, Bolch WE. MRI measurement of bone marrow cellularity for radiation dosimetry. J Nucl Med. 2011;52(9):1482–1489. - PubMed
Publication types
MeSH terms
Grants and funding
LinkOut - more resources
Full Text Sources
Other Literature Sources
Medical
