. 2013 May 8;33(19):8442-53.
doi: 10.1523/JNEUROSCI.5786-12.2013.

Thalamic control of neocortical area formation in mice

Affiliations

Thalamic control of neocortical area formation in mice

Tou Yia Vue et al. J Neurosci. .

Abstract

The mammalian neocortex undergoes dramatic transformation during development, from a seemingly homogenous sheet of neuroepithelial cells into a complex structure that is tangentially divided into discrete areas. This process is thought to be controlled by a combination of intrinsic patterning mechanisms within the cortex and afferent axonal projections from the thalamus. However, roles of thalamic afferents in the formation of areas are still poorly understood. In this study, we show that genetically increasing or decreasing the size of the lateral geniculate nucleus of the mouse thalamus resulted in a corresponding change in the size of the primary visual area. Furthermore, elimination of most thalamocortical projections from the outset of their development resulted in altered areal gene expression patterns, particularly in the primary visual and somatosensory areas, where they lost sharp boundaries with adjacent areas. Together, these results demonstrate the critical roles of thalamic afferents in the establishment of neocortical areas.


Figures

Figure 1.
Figure 1.
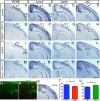
Size and cell number change in the dLG nucleus of the thalamus in mice with elevated or reduced thalamic Shh signaling. AD, RORα mRNA expression in the neonatal thalamus of control (A, C), Olig3Cre/+; R26stopSmoM2/+ (B), and Olig3Cre/+;ShhN/C (D) pups showing the alteration of the dLG nucleus. E–H, Calb2 mRNA expression in the neonatal thalamus of control (E, G), Olig3Cre/+; R26stopSmoM2/+ (F), and Olig3Cre/+;ShhN/C (H) pups showing the reciprocal changes of LP nucleus to those of dLG. I, K, Comparison of counts of DAPI-positive cells in dLG delineated by RORα expression. J, L, Comparison of dLG volume. Mean ±SEM is shown. Statistical significance, ***p < 0.0005 in Student's t test; n = 4 for each genotype. Po, Posterior nucleus. Scale bar, 200 μm.
Figure 2.
Figure 2.
Phenotypes of Olig3Cre/+; R26stopSmoM2/+ and Olig3Cre/+;ShhN/C mice. AH, Normal overall patterns of pathfinding of thalamocortical axons in embryos with altered Shh signaling in the thalamus. Netrin-G1 immunohistochemistry (Nakashiba et al., 2002) on frontal sections of Olig3Cre/+;R26stopSmoM2/+ embryos and their controls (A–D) or Olig3Cre/+;ShhN/C embryos and their controls (E–H). At E12.5, TCAs have just reached the diencephalon-telencephalon border in all genotypes (A,C,E,G), although there is consistently stronger signal at the front end of TCAs in Olig3Cre/+;R26stopSmoM2/+ embryos (C, arrow) and weaker signal in Olig3Cre/+;ShhN/C embryos (G, arrow) than in controls. At E15.5, TCAs have already reached the medial-most regions of the neocortex in all genotypes (B,D,F,H, arrow). Number of replica≧3. Scale bar, A,C,E,G, 100 μm; B,D,F,H 200 μm. IO, Characterization of the cortex development in Olig3Cre/+;R26stopSmoM2/+ and Olig3Cre/+;ShhN/C cortex. I–K, Thalamus-restricted recombination caused by the Olig3Cre allele. P7 coronal sections of Olig3Cre/+;R26stopZSGreen/+ mice showing the localized expression of the ZSGreen reporter gene in the thalamus. I, The most rostral level, and K, the most caudal level. Thalamus (Th) shows robust nuclear ZSGreen expression while other forebrain regions show almost no sign of Cre−mediated recombination. Due to the strong fluorescence of ZSGreen, TCAs are also labeled in the internal capsule (J, arrowhead) and also in their terminals, particularly in the barrel field of primary somatosensory area (J, arrow). However, no nuclear signal is seen in the cortex, showing the lack of recombination. Scale bar, 500 μm. L–O, Overall morphology of the cerebral cortex is not altered in mice with elevated or reduced Shh signaling in the thalamus. Dorsal view of the brain of P8 Olig3Cre/+;R26stopSmoM2/+ pups and their controls (L, N) and Olig3Cre/+;ShhN/C pups and their controls (M, O). Cerebral cortex seems to be unaltered in overall morphology and size. Scale bars, 5 mm. P–Y, Regional gene expression patterns in the cortical plate of E17.5 embryos are not significantly affected with altered Shh signaling in the thalamus. In situ hybridization on sagittal sections of Olig3Cre/+;ShhN/C embryos and their controls. Rostral is to the left. RORβ (P, U) and Cdh8 (Q, V) are expressed in high-rostral to low-caudal gradients in the cortical plate (arrow indicates the regions with high level of expression). Id2 (R, W), EphA7 (S, X), and Lmo4 (T, Y) all show high expression in the rostral (arrow) and caudal (arrowhead) parts of the cortex and their expression level drops in the middle part. These general patterns of differential expression are unaffected in Olig3Cre/+;ShhN/C embryos. Number of replica ≧3. Scale bars, 1 mm.
Figure 3.
Figure 3.
Shift of geniculocortical terminations and RORβ expression in Olig3Cre/+; R26stopSmoM2/+ and Olig3Cre/+;ShhN/C cortex at P8. Comparison of serotonin immunostaining and RORβ in situ hybridization on adjacent coronal sections through the rostral visual cortex and more caudal visual cortex between control, Olig3Cre/+;R26stopSmoM2/+, or Olig3Cre/+;ShhN/C mice at P7. A–D, Control sections showing the width, or medial-lateral boundaries, of V1 as labeled by serotonin staining or RORβ expression at a rostral level (A, B, arrowheads) or more caudal level (C, D, arrowheads). The dLG nucleus is also labeled by serotonin staining (A, arrow). E–H, Coronal sections of an Olig3Cre/+;R26stopSmoM2/+ brain showing that not only is serotonin staining in layers 4 and 6 of V1 more intense than control, but the width of V1 as labeled by both serotonin and RORβ is expanded (EH, arrowheads). The size of dLG is also expanded (E, arrows). I–L, Coronal sections of an Olig3Cre/+;ShhN/C brain showing that serotonin staining and RORβ in situ hybridization did not detect any expression in the rostral visual cortex (I, J) but only at the caudal visual cortex, indicating a caudal shift of the rostral boundary of V1 in these mice. Note that the level of serotonin staining is also decreased, the width of V1 is reduced, and boundaries of V1 are shifted more laterally compared with controls (K, L, arrowheads). The dLG is also significantly smaller in size (I, arrow). Number of replica, 7 for EH, 4 for IL. Scale bar, 1 mm.
Figure 4.
Figure 4.
Detailed marker analysis shows shifts of V1 boundaries in Olig3Cre/+;ShhN/C cortex and Olig3Cre/+;ShhN/C cortex at P8. A–H, In situ hybridization on coronal sections of Olig3Cre/+;ShhN/C caudal cortex and their littermate controls at P8. Medial is to the left. Expression of RORβ (A in controls, E in Olig3Cre/+;ShhN/C), Lmo4 (B in controls, F in Olig3Cre/+;ShhN/C), Cdh8 (C in controls, G in Olig3Cre/+;ShhN/C), and Id2 (D in controls, H in Olig3Cre/+;ShhN/C) is shown. AD and EH are serially adjacent sets of sections taken from the same brain. Medial black arrow in AC coincides well with each other and represents the medial border of V1. Lateral black arrow in A-C represent the lateral border of V1 and its position is based on the lateral border of weak Cdh8 expression in layer 4 (C). Arrows in D are based on the positions of V1 borders obtained from the adjacent section shown in C. Black arrows in EH were obtained in the same way as for AD. Red arrows in EH correspond to the medial border of V1 in corresponding control sections shown immediately above and indicate the shift of boundaries in Olig3Cre/+;ShhN/C mice. This is confirmed by quantification shown in U. Number of replica, 6. Scale bar, 1 mm. IP, In situ hybridization on coronal sections of Olig3Cre/+;R26stopSmoM2/+ caudal cortex and their littermate controls at P8. Medial is to the left. Expression of RORβ (I in controls, M in Olig3Cre/+;R26stopSmoM2/+), Lmo4 (J in controls, N in Olig3Cre/+;R26stopSmoM2/+), Cdh8 (K in controls, O in Olig3Cre/+;R26stopSmoM2/+), and Id2 (L in controls, P in Olig3Cre/+;R26stopSmoM2/+) is shown. IL and MP are serially adjacent sets of sections taken from the same brain. Black arrows show V1 boundaries obtained by the same methods used in AH, whereas red arrows indicate the shift of boundaries in Olig3Cre/+;R26stopSmoM2/+ mice. This is confirmed by quantification shown in T. Number of replica, 4. Scale bar, 1 mm. Q, R, Double immunostaining of RORβ (green) and Lmo4 (red) at the V1/V2 border of P8 cortex. Medial is to the left. Q shows the single color for RORβ staining and R shows double staining on the same section. Note that the medial border of RORβ expression and lateral border of Lmo4 expression match (arrow). Scale bar, 100 μm. S–U, Shifts of medial boundary of V1 in Olig3Cre/+;ShhN/C and Olig3Cre/+;R26stopSmoM2/+ mice on coronal sections at P8. S, Distance between the midline and medial border of V1 as determined by the expression of Lmo4. Midline was defined as the medial end of the retrosplenial area (RS) indicated by the end of high Lmo4 expression domain in upper layers. This domain includes higher-order visual area (V2) and retrosplenial area (RS). Length of the segmented line (yellow) was measured. Sub, Subiculum. T, Comparison of the length of Lmo4 expression domain between Olig3Cre/+;R26stopSmoM2/+ and control mice (mean ±SEM). The medial border of V1 in SmoM2 cortex shows a medial shift. U, Comparison between Olig3Cre/+;ShhN/C and control mice (mean ±SEM). The medial border of V1 in the mutant cortex shows a lateral shift. Statistical significance, **p < 0.005 in Student's t test; n = 6 for each genotype.
Figure 5.
Figure 5.
Measurements of V1 boundaries in Olig3Cre/+;R26stopSmoM2/+ and Olig3Cre/+;ShhN/C cortex at P7/P8. AF, Comparison of the size and shape of V1 using serotonin immunostaining and RORβ in situ hybridization on adjacent tangential sections of the flattened neocortex between control, Olig3Cre/+;R26stopSmoM2/+, and Olig3Cre/+;ShhN/C mice at P7. Serotonin staining labels TCA terminals from sensory thalamic nuclei including the dLG nucleus, whereas RORβ expression labels cells in V1. Axes of the flattened cortex are shown in G. A, D, Adjacent control brain sections showing that both serotonin staining and RORβ expression label the same triangle-shaped V1, as well as S1 and A1. Note that there is a clearly defined gap between V1 and S1 (between bars, A, D). B, E, Adjacent Olig3Cre/+;R26stopSmoM2/+ brain sections showing that the shape of V1, as labeled by both serotonin staining or RORβ expression, is more rounded, especially at the rostral tip compared with controls. The size of V1 is enlarged, which is reflected in part by a significant decrease in the gap between V1 and S1. C, F, Adjacent Olig3Cre/+;ShhN/C brain sections showing that the triangular shape of V1 is preserved but its size is significantly reduced and is also shifted caudally. Note that the gap between V1 and S1 is now approximately twice the size of control. Scale bar, 1 mm. G, H, Quantification of changes in the area and length of V1, as revealed by serotonin staining (left column, H) or RORβ expression (right column, H), in Olig3Cre/+;R26stopSmoM2/+ and Olig3Cre/+;ShhN/C brains compared with their respective controls (mean ±SEM). G, Schematic illustration showing the area ratio (area of V1 divided by the area of the entire cortex) and length ratio (length of V1 divided by length of the entire cortex). H, Graphs showing the area ratio and length ratio of V1 for Olig3Cre/+;R26stopSmoM2/+ mice against their littermate controls, or Olig3Cre/+;ShhN/C mice against their controls. Number of hemispheres used for analyses are indicated within bar graph of each genotype. Statistical significance, *p < 0.05; **p < 0.005; ***p < 0.0001. OB, Olfactory bulb. IN, Changes in the gap between V1 and S1 in Olig3Cre/+;ShhN/C and Olig3Cre/+;R26stopSmoM2/+ mice at P8. I–L, In situ hybridization of Cdh8 on P8 sagittal sections of Olig3Cre/+;R26stopSmoM2/+ and controls (I, K) and Olig3Cre/+;ShhN/C and controls (J, L). Rostral is to the left. Rostral border of V1 and caudal border of S1 are defined by the gap region in which strong Cdh8 expression is seen in layer 4, and are shown by arrows. M, N, The gap between V1 and S1 was measured in sagittal sections at six different medial-lateral levels from 5 to 6 hemispheres. The gap length is significantly narrowed in Olig3Cre/+;R26stopSmoM2/+ mice at 5 of 6 medial-lateral levels (M). The gap length is significantly widened in Olig3Cre/+;ShhN/C cortex at the most lateral level (N). Mean ± SEM is shown in O and P. Statistical significance, *p < 0.05 in Student's t test; n = 4 for each genotype. Scale bars, 500 μm.
Figure 6.
Figure 6.
The thalamus, but not the ventral telencephalon and the brainstem Raphe nuclei, is disorganized in Gbx2 cko mice. AF, In situ hybridization on frontal sections of E14.5 Olig3Cre/+;Gbx2C/C embryos and their controls. Medial is to the left. Exon 2 of the Gbx2 genes is specifically deleted in the thalamus (compare B, E) but not in the ventral telencephalon (A, D). RORα expression in the thalamus is dramatically reduced in the cko embryos (compare C, F). Scale bar, 200 μm. G–K, Olig3Cremediated recombination does not affect serotonergic neurons in the brainstem of Gbx2 cko mice. G, Sagittal section of E12.5 Olig3Cre/+;R26stopYFP/+ embryo showing the cells that have undergone recombination with the Olig3Cre allele. Recombined cells that express YFP are negative for serotonin (5HT). The arrow indicates serotonergic neurons. H, I, Serotonin immunostaining on frontal sections of Gbx2 cko and its littermate control embryos at E12.5. Serotonin-expressing Raphe neurons in the brainstem appear to be intact in Gbx2 cko mice. J, K, Immunostaining of serotonin (red) and Netrin-G1 (green) on sagittal sections of Gbx2 cko and its littermate control embryos at E16.5. Rostral is to the right. Projections of serotonergic fibers from Raphe neurons into the cortex (arrows) appear to be comparable between Gbx2 cko and controls, whereas Netrin-G1-labeled TCAs (arrowhead) are markedly diminished in Gbx2 cko embryos. Note that at this stage serotonin and Netrin-G1 label largely nonoverlapping axonal populations in control brains. Scale bars: A, 100 μm; BE, 200 μm.
Figure 7.
Figure 7.
Defects in TCA projections to the cortex and normal embryonic gene expression in the cortex in Gbx2 cko mice. AJ, Immunohistochemistry for Netrin-G1, which marks TCAs. Gbx2 cko and control embryos are compared at E12.5 (A, B for controls; C, D for cko), E14.5 (E, F for controls, G, H for cko) and E16.5 (I for control, J for cko). Medial is to the left. KL, Retrograde labeling of thalamic neurons by the axon tracers NeuroVue. Pieces of two tracers were placed in V1 and S1 of P8 cortex (K for control, L for cko). Arrow and double arrow in L indicate the severely reduced labeling from S1 and V1, retrospectively. Scale bars: A–J, 200 μm; K, L, 500 μm. MT, Normal gene expression in E17.5 Gbx2 cko cortex. In situ hybridization on sagittal sections of E17.5 Olig3Cre/+;Gbx2N/C embryos and their controls. Rostral is to the left. RORβ (M, Q) and Cdh8 (N, R) are expressed in high-rostral to low-caudal gradients in the cortical plate (arrow indicates the regions with high level of expression). Id2 (O, S) and Lmo4 (P, T) both show high expression in the rostral (arrow) and caudal (arrowhead) parts of the cortex and their expression level drops in the middle part. These general patterns of differential expression are not altered in Olig3Cre/+;Gbx2N/C embryos. Scale bars, 1 mm. U, V, Persistent defects of thalamus and TCA projections in Gbx2 cko mice at P21. Cresyl violet staining of coronal sections through the forebrain. Medial is to the left. In the Gbx2 cko brain, the thalamus is disorganized and reduced in size. TCA projections (tca) still appear to be absent (V, arrowhead), whereas corticofugal axons (cp; cerebral peduncle) seem to be intact. Scale bars, 1 mm.
Figure 8.
Figure 8.
Altered gene expression patterns and lack of distinct areal boundaries in Gbx2 cko cortex at P8. In situ hybridization on coronal sections of Olig3Cre/+;Gbx2C/C pups and their littermate controls. Medial is to the left. The left-most column represents the rostral level that includes both the motor and S1 (forelimb) areas, and the right-most column includes sections at the level of V1 and A1. Expression of RORβ (A–E in controls, F–J in cko), Lmo4 (KO in controls, PT in cko) and Cdh8 (UY in controls, Zd in cko) was compared between the cko and control brains. For each genotype, images in the same column (A, K, U; B, L, V; C, M, W; D, N, X; E, O, Y; F, P, Z; G, Q, a; H, R, b; I, S, c; J, T, d) are serially adjacent sections taken from the same brain and thus are directly comparable. Black arrows show normal area boundaries, whereas red arrows show the lack of distinct gene expression boundaries found in Gbx2 cko brains. Scale bars, 1 mm.
Figure 9.
Figure 9.
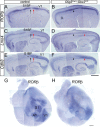
Sagittal and tangential sections of P8 Gbx2 cko cortex. AF, Lack of discrete areal gene expression boundaries on sagittal sections of P8 Gbx2 cko cortex. In situ hybridization of RORβ (A, B), Lmo4 (C, D), Cdh8 (E, F) on P8 sagittal sections of Olig3Cre/+;Gbx2C/C and controls. Rostral is to the left. A, C, and E and B, D, and F are serially adjacent sets of sections taken from the same brain. Rostral border of V1 and caudal border of S1 in control cortex are shown by red and black arrows, respectively. The Cdh8-low “hollow” in layer 4 indicated the location of V1 and S1 (shown by asterisk in E). In Gbx2 cko mice, areal gene expression border is less clear. RORβ expression in layer 4 is much less robust in S1BF of Gbx2 cko cortex (B, black arrowhead), whereas Lmo4 is ectopically expressed in layer 4 of both V1 (D, red arrowhead) and S1BF (D, black arrowhead). Cdh8-low hollows are less obvious in Gbx2 cko cortex (F, arrowheads). Scale bar, 500 μm. G, H, Lack of discrete borders of RORβ expression in layer 4 of Gbx2 cko cortex at P8. In situ hybridization of RORβ on tangential sections through layer 4. Scale bar, 1 mm.
Figure 10.
Figure 10.
Schematic summary of the study. A, Normal thalamocortical system. Specific TCA inputs from individual thalamic nuclei induce area-specific gene expression patterns in their target regions of the neocortex. Visual (dLG to V1) and somatosensory (VP to S1) are shown as examples. These specific inputs act on the immature cortex that is patterned by intrinsic mechanisms (represented in gradients of gray color). B, In severe deficiency of TCA inputs in thalamus-specific Gbx2 mutant mice, patterns of gene expression in the putative V1 and S1 resembled those in the nearby nonprimary sensory areas, resulting in the lack of distinct boundaries. C, D, When the size of the dLG nucleus was increased (C) or decreased (D) as a result of manipulating Shh signaling in thalamic progenitor cells, geniculocortical projections were expanded or shrunken, and the V1 size was also altered accordingly. As a result, the gap between S1 and V1 was narrowed or widened.

Comment in

References

    1. Bluske KK, Vue TY, Kawakami Y, Taketo MM, Yoshikawa K, Johnson JE, Nakagawa Y. beta-catenin signaling specifies progenitor cell identity in parallel with shh signaling in the developing mammalian thalamus. Development. 2012;139:2692–2702. doi: 10.1242/dev.072314. - DOI - PMC - PubMed
    1. Borello U, Pierani A. Patterning the cerebral cortex: traveling with morphogens. Curr Opin Genet Dev. 2010;20:408–415. doi: 10.1016/j.gde.2010.05.003. - DOI - PubMed
    1. Bulfone A, Puelles L, Porteus MH, Frohman MA, Martin GR, Rubenstein JL. Spatially restricted expression of Dlx-1, Dlx-2 (Tes-1), Gbx-2, and Wnt-3 in the embryonic day 12.5 mouse forebrain defines potential transverse and longitudinal segmental boundaries. J Neurosci. 1993;13:3155–3172. - PMC - PubMed
    1. Chen L, Guo Q, Li JY. Transcription factor Gbx2 acts cell-nonautonomously to regulate the formation of lineage-restriction boundaries of the thalamus. Development. 2009;136:1317–1326. doi: 10.1242/dev.030510. - DOI - PMC - PubMed
    1. Dehay C, Horsburgh G, Berland M, Killackey H, Kennedy H. Maturation and connectivity of the visual cortex in monkey is altered by prenatal removal of retinal input. Nature. 1989;337:265–267. doi: 10.1038/337265a0. - DOI - PubMed

Publication types

MeSH terms