. 2013 Jul;87(14):7921-32.
doi: 10.1128/JVI.01172-13. Epub 2013 May 8.

Polarized cell migration during cell-to-cell transmission of herpes simplex virus in human skin keratinocytes

Affiliations

Polarized cell migration during cell-to-cell transmission of herpes simplex virus in human skin keratinocytes

Fernando Abaitua et al. J Virol. 2013 Jul.

Abstract

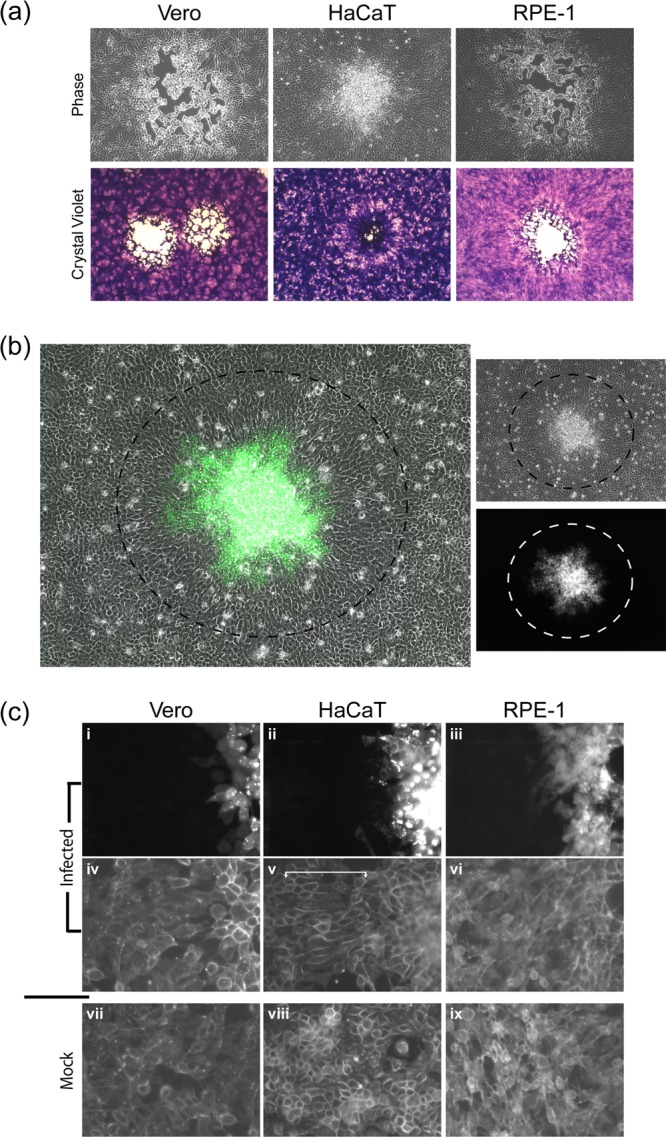
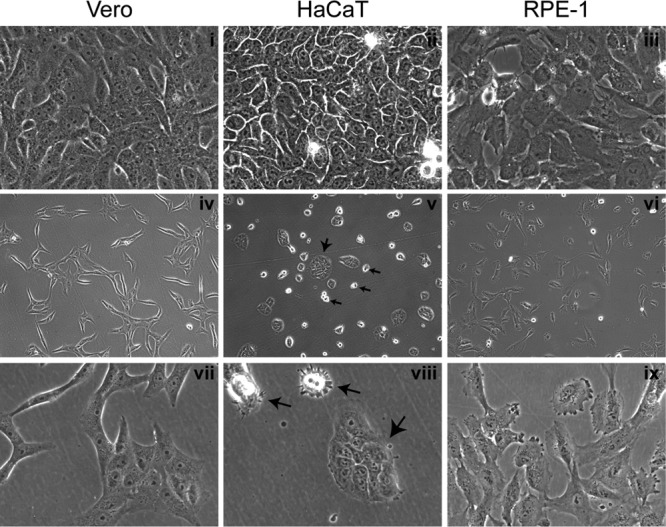
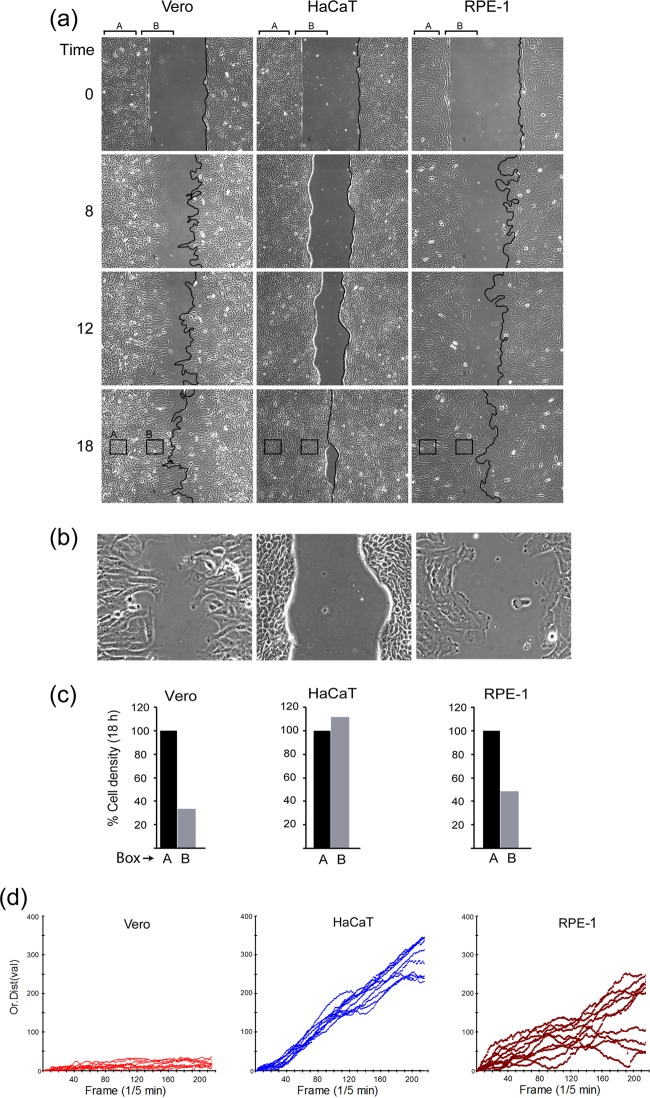
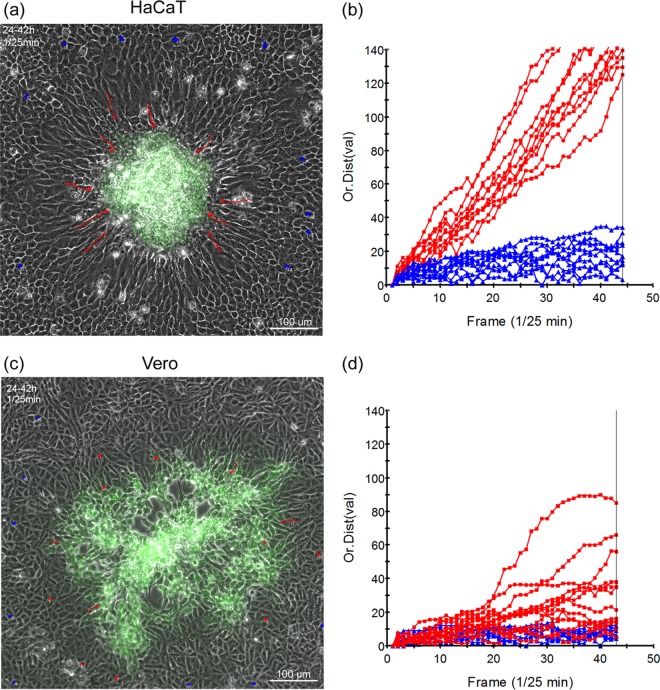
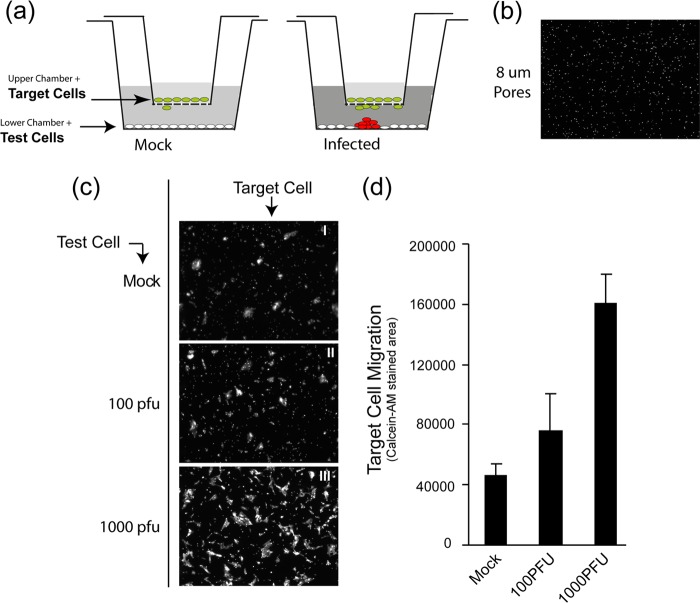
In addition to transmission involving extracellular free particles, a generally accepted model of virus propagation is one wherein virus replicates in one cell, producing infectious particles that transmit to the next cell via cell junctions or induced polarized contacts. This mechanism of spread is especially important in the presence of neutralizing antibody, and the concept underpins analysis of virus spread, plaque size, viral and host functions, and general mechanisms of virus propagation. Here, we demonstrate a novel process involved in cell-to-cell transmission of herpes simplex virus (HSV) in human skin cells that has not previously been appreciated. Using time-lapse microscopy of fluorescent viruses, we show that HSV infection induces the polarized migration of skin cells into the site of infection. In the presence of neutralizing antibody, uninfected skin cells migrate to the initial site of infection and spread over infected cells to become infected in a spatially confined cluster containing hundreds of cells. The cells in this cluster do not undergo cytocidal cell lysis but harbor abundant enveloped particles within cells and cell-free virus within interstitial regions below the cluster surface. Cells at the base and outside the cluster were generally negative for virus immediate-early expression. We further show, using spatially separated monolayer assays, that at least one component of this induced migration is the paracrine stimulation of a cytotactic response from infected cells to uninfected cells. The existence of this process changes our concept of virus transmission and the potential functions, virus, and host factors involved.


Figures

Fig 1
Fig 1
HSV spread comparison in different cell lines. Monolayers of Vero, HaCaT, and RPE cells were infected with ∼100 PFU of HSV-1[17]/well in the presence of HS. (a) Bright-field images (×10 objective lens) of plaques at 72 h postinfection by live microscopy (upper panels) prior to fixation and staining with crystal violet (lower panel). (b) Typical plaque formed in HaCaT cells by HSV-1[17].ICP0-YFP, showing a merged image of phase and YFP (48 h postinfection, ×10 objective lens). The dashed black circle indicates the area of YFP+ cells showing an elongated and oriented morphology compared to the surrounding cells (outside the circle). The images on the right show each channel independently, with the corresponding circles indicating the area of morphologically altered, YFP+ cells. (c) HSV-1[17].ICP0-YFP plaques in each of the cell types indicated (48 h postinfection, ×40 objective lens) showing plaque perimeters (panels i to vi) compared to mock monolayers (panels vii to ix). Live monolayers were stained with general plasma membrane stain CellMask (panels iv to ix) compared to the ICP0-YFP signal for virus infection (panels i to iii). The area of morphologically elongated GFP+ cells is indicated with a white bracket in the CellMask image (panel v).
Fig 2
Fig 2
Morphological features of cell plating and growth. Monolayers of Vero, HaCaT, and RPE cells were plated at different densities. Typical images of live confluent monolayers (panels i to iii) or subconfluent (panels iv to ix) monolayers are shown. Images were recorded using a ×40 lens (panels i to iii and vii to ix) or ×10 objective lens (panels iv to vi). For the HaCaT cell panels, large arrows indicate small islands of adherent and flattened cells, whereas small arrows indicate individual rounded cells that have not flattened completely. For Vero and RPE cells, the individual cells flattened readily and then divided into islands, whereas for HaCaT cells, the individual cells remained rounded and poorly spread until present with neighboring cells to form islands.
Fig 3
Fig 3
Motility characteristics of the cell lines. Vero, HaCaT, or RPE cell monolayers were plated in a two-chamber system with a removable gasket. As described in Materials and Methods, the subsequent gap filling assay was analyzed by time-lapse microscopy after removal of the gasket. (a) Individual snapshots at different times (0 to 18 h) after start of the assay showing gap filling by each of the cell lines. The frontline boundary of moving cells is outlined (black) on one boundary. Regions termed A within the denser internal area and B at the cell boundary are indicated by brackets. Boxes within the 18-h time point indicate typical AOI used to calculate cell density as described in the text. (b) Zoomed image (12-h time point) of the boundaries showing the distinct morphology of the migrating cells at the front. (c) Three independent AOI (black squares) within the defined regions A (original plated area) and B (just behind boundary) were quantified. The average cell density of an AOI in region A was standardized as 100% and then compared to that in the average AOI from just at the boundary. (d) Quantification of migration for 10 independent cells within area A for each cell line. Each cell was identified at the start of the time lapse, tracked (one point/5 min) for 18 h, and positioned from the origin plotted against time. The scales are identical for all cells.
Fig 4
Fig 4
Polarized migration of HaCaT during plaque progression. Monolayers of HaCaT cells (a and b) or Vero cells (c and d) in 35-mm dishes were infected with ∼100 PFU of HSV-1[17].ICP0-YFP/dish in the presence of neutralizing antibody (1% HS) and incubated in an environmentally controlled microscope stage. Developing plaques were identified between 16 and 24 h and then recorded for both phase and YFP fluorescence for ∼18 h (1 frame every 5 min). The still images (a and c) show the last frame, merged for phase and YFP, of each time-lapse series. The time-lapse series upon which the quantitation was based (1 frame/25 min) are shown in accompanying movies (Fig. S4 and S5 in the supplemental material [https://www.dropbox.com/sh/mhj8p3qhswl4nyt/zk2VmGFjun]). The altered zone of cells surrounding the clustered plaque in HaCaT cells was readily observed. Random cells from outside this zone (blue tracks) and inside (red tracks) were individually tracked during the time lapse, and the distance from origin was plotted as a function of time (b and d).
Fig 5
Fig 5
Infected HaCaT cell clustering. Monolayers of Vero, HaCaT, and RPE cells in 35-mm dishes were infected with 100 PFU of HSV-1[17]/well, stained at 24 h postinfection with CellMask, and then fixed with paraformaldehyde. Phase images (lower panels) are included to illustrate the morphological changes used to identify the viral plaques. Entire plaques were then imaged by z-sectioning (a total of ∼116 μm, with intervals of 7 μm/section) from the lower part of the plaque at the substratum to the most elevated point. The upper panels show the staining in a conventional x,y perspective, with green lines indicating the orthogonal axis applied for the z-sectioning. The resulting stacks (middle panel) shows the vertical perspective through the center of the plaque for each cell type.
Fig 6
Fig 6
Ultrastructural characterization of HSV plaques in HaCaT cells. Monolayers of HaCaT cells in 35-mm dishes were infected with 100 PFU of HSV-1[17]/well and processed at 24 h postinfection for TEM as described in Materials and Methods. (a) Low-power binocular image of the vertical face of the embedded resin block. This image gives a three-dimensional view along the horizontal surface of the plastic support. Arrows indicate the plaques of clustered piled-up cells, with the size of the arrow indicating the distance from the block front. (b) The block was then sectioned into semithin survey sections (500 to 1,000 nm) and stained with crystal violet. Images were collected on a Zeiss Axiovert 200M using a ×40 objective lens, and the panels were assembled using Adobe Photoshop. (c) Sequential ultrathin sections (50 to 70 nm) of the same sample were then obtained and collected onto slot grids, stained, and examined by TEM. Because the sections analyzed are immediately adjacent to the section stained with crystal violet, corresponding areas could be matched. The TEM images of the sections in panel c, sections 1 to 4, therefore correspond to the boxes in panel b, sections 1 to 4. Upper panels (lower magnification) and lower panels (higher magnification on inset area) show different features of infection within the plaque as discussed in the text. In the lower panels, the features include extracellular virions (black arrows with white outline), nucleocapsids (short black arrows), and cell tight junctions (white arrows). In the upper part of panels 3 and 4, cells with no distinct features of infection (e.g., no early chromatin marginalization) are indicated by long black arrows. Box 5 in panel b shows flat uninfected cells that correspond to the elongated cells (TEM data not shown).
Fig 7
Fig 7
Paracrine-induced migration of skin cells by HSV infection. (a) Schematic diagram of culture system used to analyze HaCaT cell migration. The upper chamber (the insert) contains target cells plated onto a support with defined 8-μm pores. The support is impervious to light transmission. The lower chamber (a conventional 35-mm dish) contains a monolayer of test cells that would be mock infected or infected with 100 or 1,000 PFU of HSV-1[17].ICP0-YFP/dish. The cluster of red cells represents a developing plaque. The shading of the media indicates potential secretion of components that might induce cellular migration through the pores onto the bottom side of the membrane, where they can be detected by live-cell fluorescence staining (Calcein AM). (b) Image of the insert base support system showing Calcein AM signal through the pores of the membrane of the upper chamber. This represents the background signal. (c) Lower-chamber cells were mock infected or HSV infected as indicated and incubated with the upper-chamber cells for 72 h; representative low-power images were then taken of the bottom side of the upper-chamber membrane after staining with Calcein AM. The results show images of the target cells (I to III) for each of the test conditions (indicated on the left-hand side). (d) Average total Calcein AM staining (pixel density) of target cells after thresholding to remove the defined background signal (image in panel b). Values were obtained from three random low-power fields for each condition in each of the duplicated samples. The experiment was repeated three times with similar results.
Fig 8
Fig 8
Model of plaque progression and cell-to-cell transmission in HaCaT cells. The panels a to c represent the temporal development of the plaque. After initial infection, gray cell (circled 1), virus spreads intercellularly (circled 2). Additional signaling events, including a paracrine mechanism (circled 3), induce cell migration (circled 4) to the developing focus of infection. It is possible that intercellular communication (circled 5) contributes to migration, in addition to the paracrine mechanism. Uninfected cells migrate into and over uninfected cells, and cell-to-cell transmission occurs in reorganized clusters (circled 6 and 7) and, at least initially, continue to amplify (circled 6) the paracrine signal. The duration of migration (circled 8) and of the paracrine stimulus (circled 9) may be temporally regulated. This and further aspects of this process are discussed more fully in the text.

References

    1. Flint SJ, Enquist LW, Krug RM, Racaniello VR, Skalka AM. 2009. Principles of virology. ASM Press, Washington, DC
    1. Mothes W, Sherer NM, Jin J, Zhong P. 2010. Virus cell-to-cell transmission. J. Virol. 84:8360–8368 - PMC - PubMed
    1. Sattentau Q. 2008. Avoiding the void: cell-to-cell spread of human viruses. Nat. Rev. Microbiol. 6:815–826 - PubMed
    1. Black FL, Melnick JL. 1955. Microepidemiology of poliomyelitis and herpes-B infections: spread of the viruses within tissue cultures. J. Immunol. 74:236–242 - PubMed
    1. Christian RT, Ludovici PP, Jeter WS. 1971. Cell-to-cell transmission of herpes simplex virus in primary human amnion cells. Proc. Soc. Exp. Biol. Med. 138:1109–1115 - PubMed

Publication types

Substances