. 2013 Feb;49(2):904-914.
doi: 10.1002/wrcr.20078. Epub 2013 Feb 19.

Groundwater depletion in the Middle East from GRACE with implications for transboundary water management in the Tigris-Euphrates-Western Iran region

Affiliations
Free PMC article

Groundwater depletion in the Middle East from GRACE with implications for transboundary water management in the Tigris-Euphrates-Western Iran region

Katalyn A Voss et al. Water Resour Res. 2013 Feb.
Free PMC article

Abstract

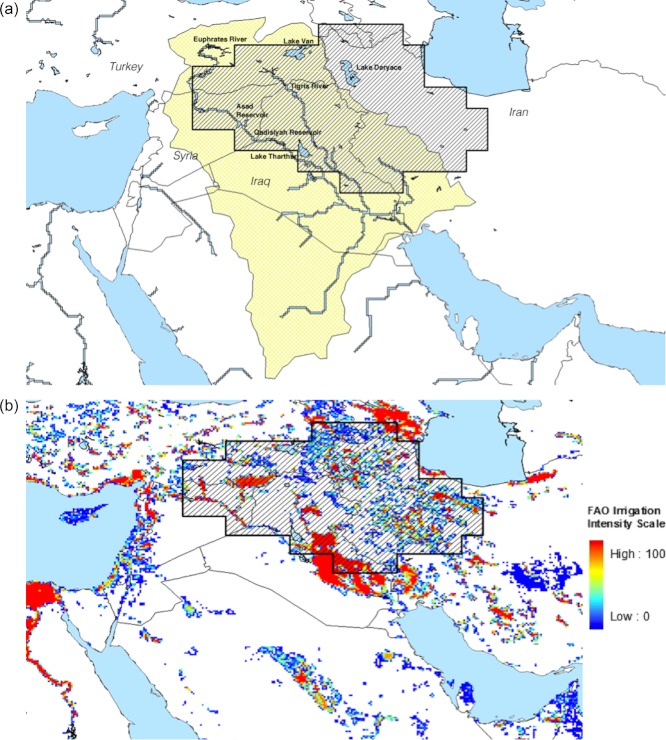
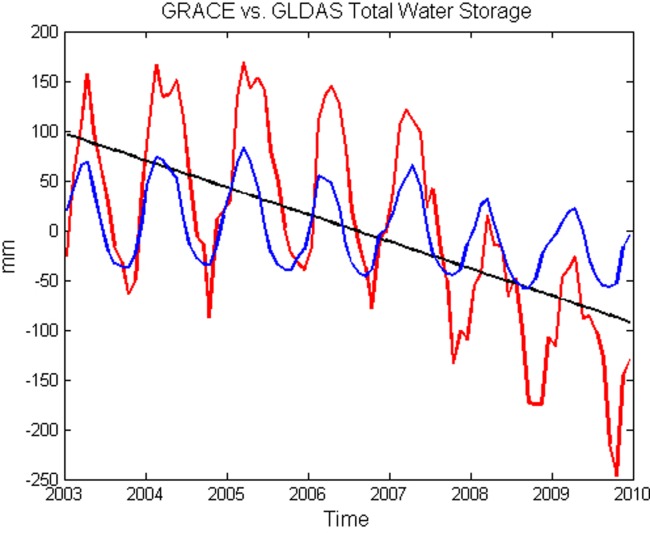
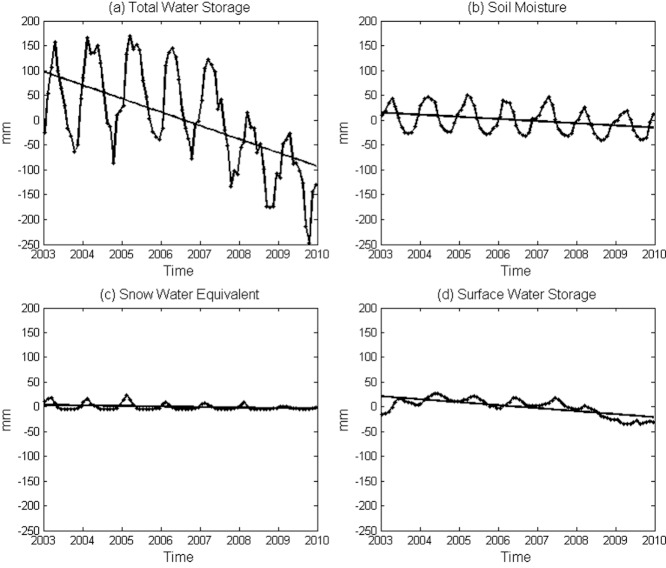
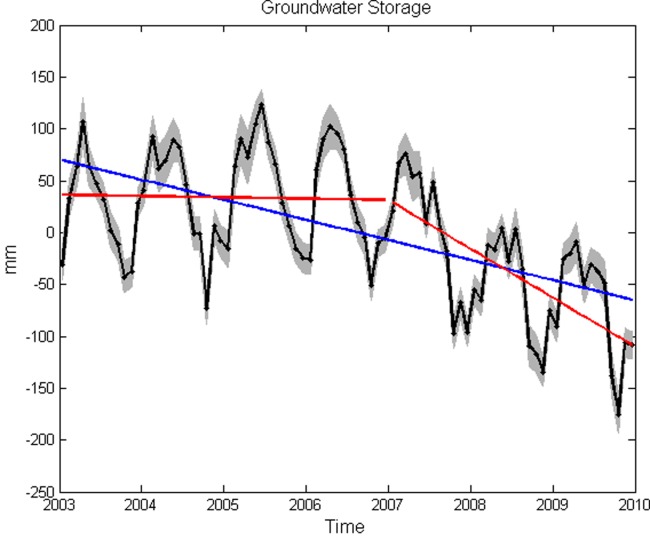
In this study, we use observations from the Gravity Recovery and Climate Experiment (GRACE) satellite mission to evaluate freshwater storage trends in the north-central Middle East, including portions of the Tigris and Euphrates River Basins and western Iran, from January 2003 to December 2009. GRACE data show an alarming rate of decrease in total water storage of approximately -27.2±0.6 mm yr-1 equivalent water height, equal to a volume of 143.6 km3 during the course of the study period. Additional remote-sensing information and output from land surface models were used to identify that groundwater losses are the major source of this trend. The approach used in this study provides an example of "best current capabilities" in regions like the Middle East, where data access can be severely limited. Results indicate that the region lost 17.3±2.1 mm yr-1 equivalent water height of groundwater during the study period, or 91.3±10.9 km3 in volume. Furthermore, results raise important issues regarding water use in transboundary river basins and aquifers, including the necessity of international water use treaties and resolving discrepancies in international water law, while amplifying the need for increased monitoring for core components of the water budget.


Figures

Figure 1
Figure 1
(a) Representation of selected study area. Thick black line with hashed fill represents the TEWI region for which GRACE data were extracted and supporting data sets compiled. All mass balance calculations were confined to this bounded region. Thin black lines represent political boundaries. Surface water bodies (light blue) were taken from the Global Lakes and Wetlands Database [Lehner and Döll, 2004]. Rivers are delineated in blue, and the respective watershed boundaries in crosshatched yellow [Graham et al., 1999]. (b) Small grid squares display percent of land under irrigation [Siebert et al., 2007]. Blue to red gradient represents intensity on a 0% to 100% scale, respectively.
Figure 2
Figure 2
Total water storage anomaly (combined precipitation, evapotranspiration, and streamflow time series) produced by GLDAS when compared with GRACE total water storage anomaly for the TEWI region in Figure 1, from January 2003 to December 2009. The blue line is GLDAS total water storage, the red line is GRACE total water storage, and the black line is the GRACE total water storage trend (−27.2±0.6 mm yr−1). The associated error for GLDAS total water storage is the mean monthly standard deviation from the three land surface models used (Vic, Noah, and CLM2), whereas the GRACE total water storage monthly error is 11.3 mm for every month, which is the sum error from scaling and leakage.
Figure 3
Figure 3
(a) Monthly total water storage anomalies and trend from GRACE for the study region from January 2003 to December 2009. The GRACE TWS trend is −27.2±0.6 mm yr−1. (b) Monthly soil moisture storage changes and trend from GLDAS. Soil moisture trend is −3.1±1.9 mm yr−1. (c) Monthly altimetry-based estimates of surface water storage changes and trend. Surface water storage trend is −5.9±0.4 mm yr−1. (d) Monthly snow water equivalent storage changes and trend from GLDAS. Snow water equivalent storage trend is −0.9±0.5 mm yr−1.
Figure 4
Figure 4
Monthly groundwater storage variations (as anomalies) and trend for the study region, from January 2003 to December 2009. Gray shaded area represents error, which is the monthly one-sigma error from the combined GRACE TWS, GLDAS-derived SM and SWE, and SW altimetry errors. Groundwater storage variations are shown by the black line. The blue line is the overall trend for the study period, which is −17.3±2.1 mm yr−1. The red lines represent the piecewise trends from January 2003 to December 2006 and January 2007 to December 2009, which are 4.9±3.1 mm yr−1 and −34.0±4.5 mm yr−1, respectively.
Figure 5
Figure 5
Storage variations for the Qadisiyah Reservoir in Iraq. From altimetry data for January 2003 to December 2009 [LEGOS, 2011].

References

    1. Agboma C, Yirdaw S, Snelgrove K. Intercomparison of the total storage deficit index (TDSI) over two Canadian Prairie catchments. J. Hydrol. 2009;374(3/4):351–359. doi: 10.1016/j.jhydrol.2009.06.034. - DOI
    1. Alipour S, Motgah M, Sharifi MA, Walter TR. Second Workshop on Use of Remote Sensing Techniques for Monitoring Volcanoes and Seismogenic Areas, 2008. 2008. InSAR time series investigation of land subsidence due to groundwater overexploitation in Tehran, Iran; pp. 1–5. USEReST, 11–14.
    1. Amery HA, Wolf AT. Water in the Middle East: A Geography of Peace. Austin, Tex: University of Texas Press; 2000.
    1. Andersen O, Seneviratne S, Hinderer J, Viterbo P. GRACE-derived terrestrial water storage depletion associated with the 2003 European heat wave. Geophys. Res. Lett. 2005;32 L18405, doi: 10.1029/2005GL023574. - DOI
    1. Bayazit M, Avci I. Water resources of Turkey: Potential, planning, development and management. Int. J. Water Resour. D. 1997;13(4):443–452.