. 2013 May;9(5):e1003424.
doi: 10.1371/journal.pgen.1003424. Epub 2013 May 2.

Wnt signaling regulates the lineage differentiation potential of mouse embryonic stem cells through Tcf3 down-regulation

Affiliations

Wnt signaling regulates the lineage differentiation potential of mouse embryonic stem cells through Tcf3 down-regulation

Yaser Atlasi et al. PLoS Genet. 2013 May.

Abstract

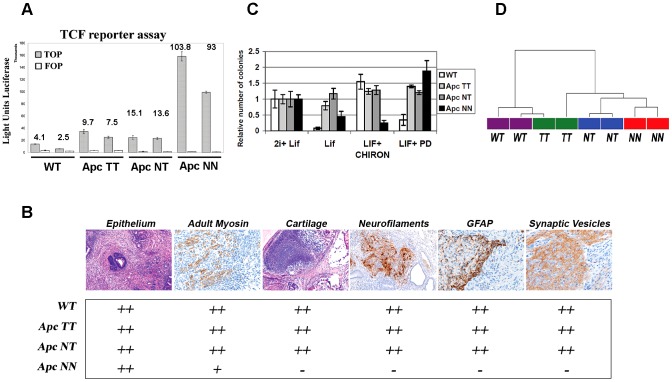
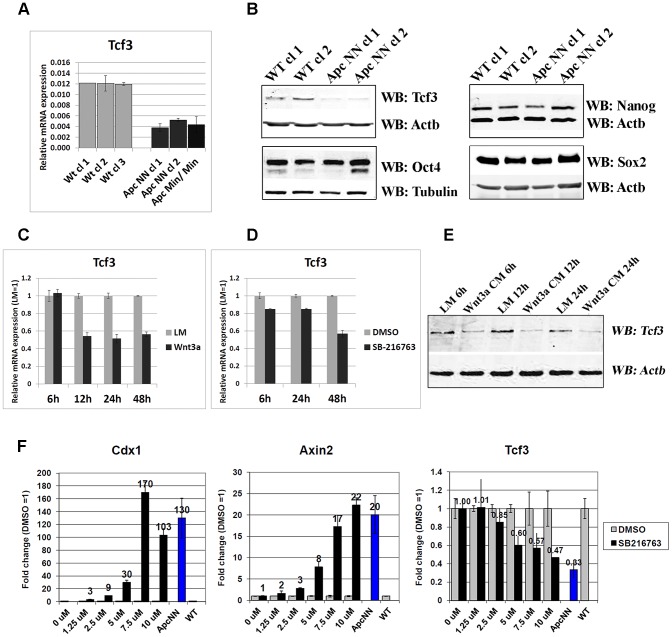
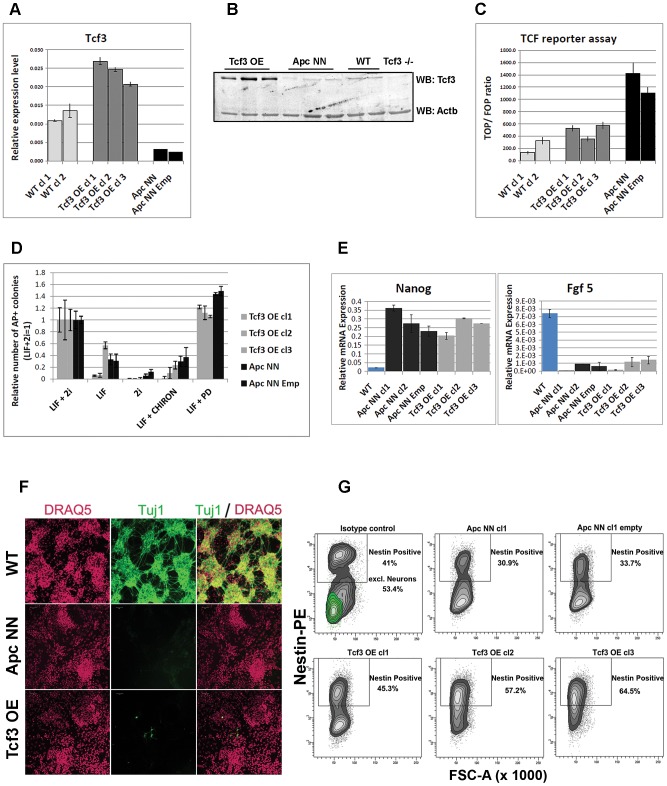
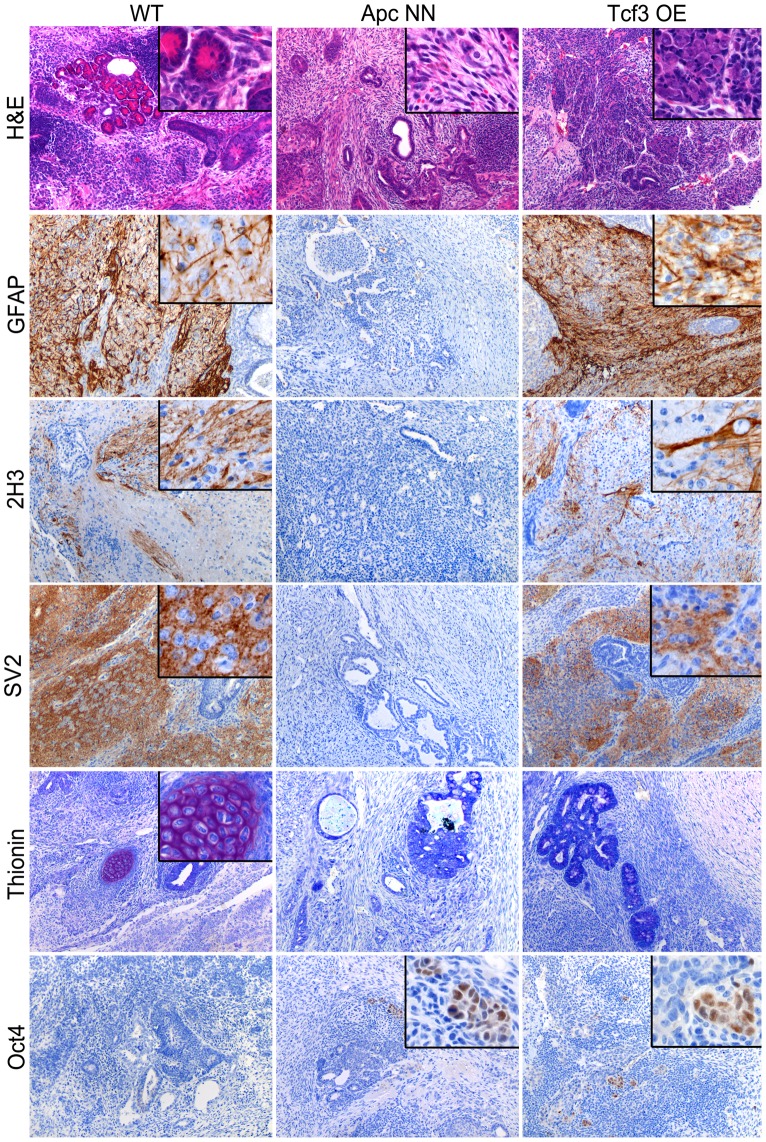
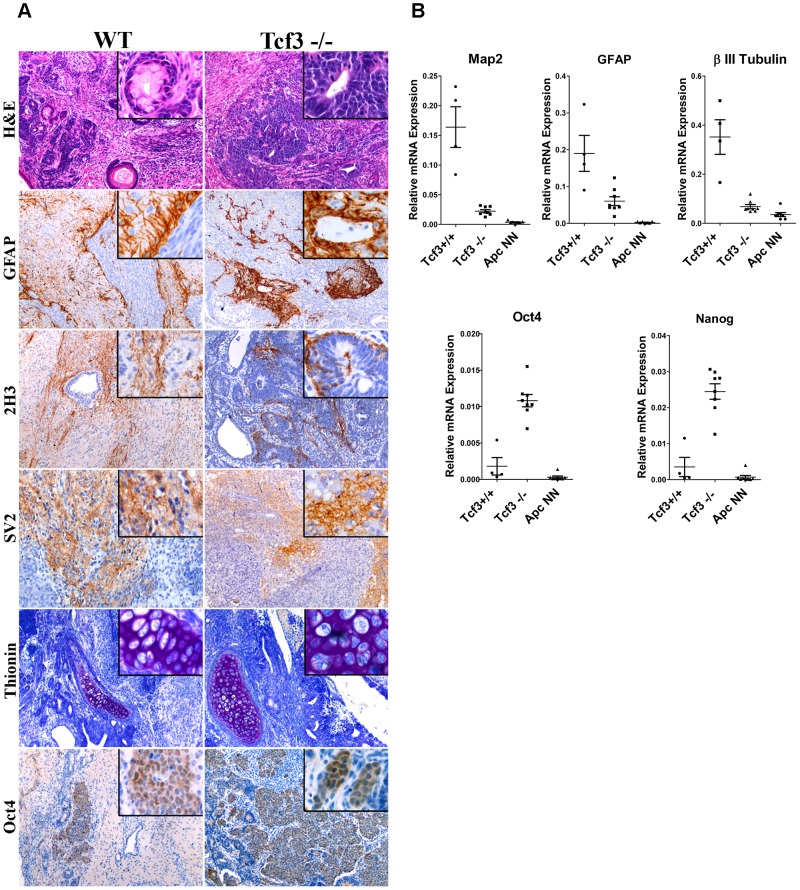
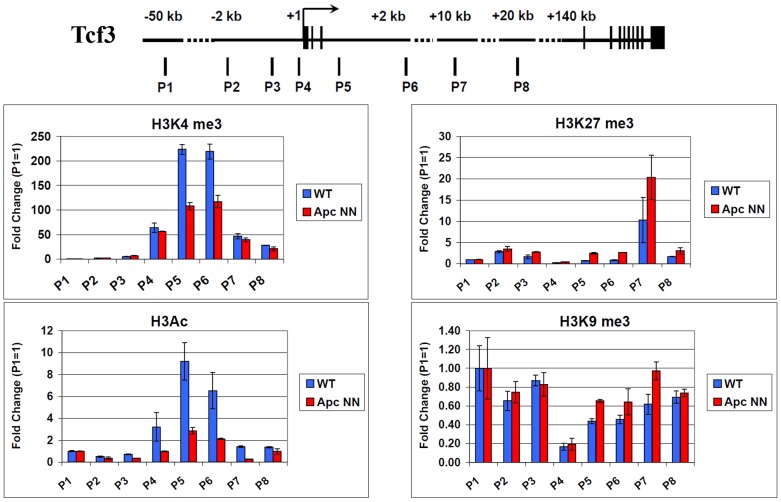
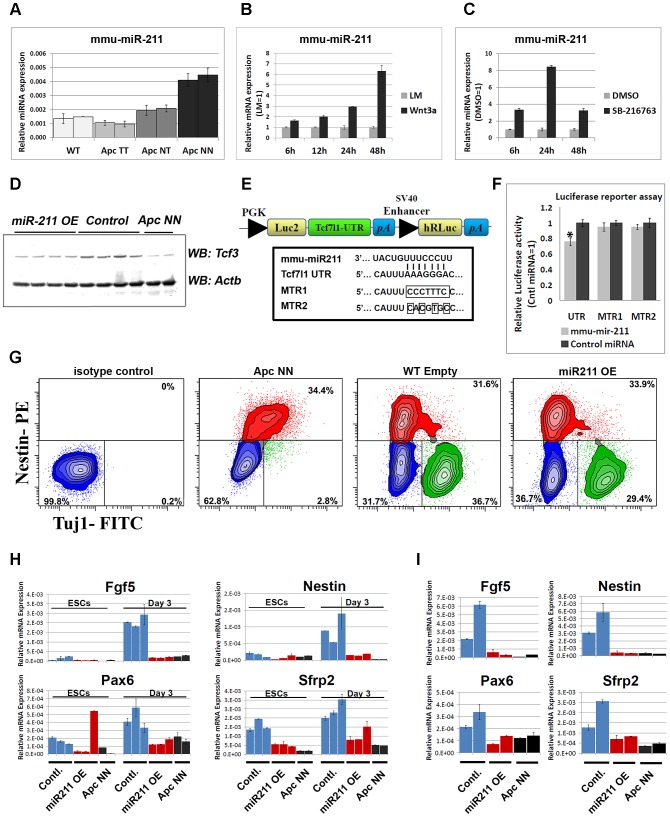
Canonical Wnt signaling plays a rate-limiting role in regulating self-renewal and differentiation in mouse embryonic stem cells (ESCs). We have previously shown that mutation in the Apc (adenomatous polyposis coli) tumor suppressor gene constitutively activates Wnt signaling in ESCs and inhibits their capacity to differentiate towards ecto-, meso-, and endodermal lineages. However, the underlying molecular and cellular mechanisms through which Wnt regulates lineage differentiation in mouse ESCs remain to date largely unknown. To this aim, we have derived and studied the gene expression profiles of several Apc-mutant ESC lines encoding for different levels of Wnt signaling activation. We found that down-regulation of Tcf3, a member of the Tcf/Lef family and a key player in the control of self-renewal and pluripotency, represents a specific and primary response to Wnt activation in ESCs. Accordingly, rescuing Tcf3 expression partially restored the neural defects observed in Apc-mutant ESCs, suggesting that Tcf3 down-regulation is a necessary step towards Wnt-mediated suppression of neural differentiation. We found that Tcf3 down-regulation in the context of constitutively active Wnt signaling does not result from promoter DNA methylation but is likely to be caused by a plethora of mechanisms at both the RNA and protein level as shown by the observed decrease in activating histone marks (H3K4me3 and H3-acetylation) and the upregulation of miR-211, a novel Wnt-regulated microRNA that targets Tcf3 and attenuates early neural differentiation in mouse ESCs. Our data show for the first time that Wnt signaling down-regulates Tcf3 expression, possibly at both the transcriptional and post-transcriptional levels, and thus highlight a novel mechanism through which Wnt signaling inhibits neuro-ectodermal lineage differentiation in mouse embryonic stem cells.


Conflict of interest statement

The authors have declared that no competing interests exist.

Figures

Figure 1
Figure 1. Wnt signaling regulates the differentiation potential of mouse ESCs in a dosage-dependent manner.
A. β-catenin/TCF reporter assay in wild type and Apc-mutant ESCs. Measurements are reported as the average luciferase units performed in triplicate for the TOP (filled bars) and FOP (empty bars) reporter constructs (data reported is mean±SD). Numbers in the histogram represent the calculated TOP/FOP ratios. B. Table summarizing the results obtained by teratoma differentiation assay from different Apc-mutant ESCs and their wild type controls. Tissue sections were stained with hematoxylin and eosin (H&E) or used in immunohistochemical analysis using specific antibodies against the neural markers: GFAP, neurofilaments and synaptic vesicles. Adult myosin was used as a mesodermal marker to stain the striated muscle differentiation. Cartilage differentiation was assessed either by H&E or theonin staining. Two independent clones were used for each genotype and differentiation was scored as: (−) not present, (+) weakly present, and (++) present. C. Histogram showing the percent of colonies formed after plating 500 FACS-sorted cells in N2B27 medium supplemented with different combinations of LIF, Mek inhibitor (PD) and GSK-inhibitor (CHIRON). Bars represent mean ± SD, n = 3. D. Dendrogram derived from unsupervised hierarchical clustering of global gene expression in wild type, ApcTT, ApcNT and ApcNN ES cells. Pearson's correlation coefficient and Ward's method were used after MAS 5.0 normalization of all probe sets.
Figure 2
Figure 2. Wnt signaling downregulates Tcf3 expression in mouse ESCs.
A. qRT-PCR analysis of Tcf3 in wild type, ApcNN and Apc Min/Min ESCs. Actb was used as an internal control; bars represent n = 2 ± SD. B. Western blot analysis of the core pluripotency markers Oct4, Nanog, Sox2 and Tcf3 on protein lysates isolated from two independent ApcNN clones and wild type control ESCs. Actb and Tubulin were used as an internal control. C–D. qRT-PCR analysis of Tcf3 in wild type ESCs treated for different time intervals with Wnt3a conditioned medium (C), or with the GSK-inhibitor SB-216763 (D). L-medium and DMSO were employed as controls, respectively. Actb was used as an internal control; bars represent n = 2 ± SD. E. Time course western blot analysis of Tcf3 expression in wild type ESCs treated with Wnt3a conditioned medium (Wnt3a CM) or control L-medium (LM). Actb was used as an internal control. F. qRT-PCR analysis of Tcf3 and Wnt target genes Axin2 and Cdx1 in wild type ESC treated for 48 h with different concentrations of GSK-inhibitor SB-216763 or DMSO as control. Actb was used as an internal control; bars represent n = 2 ± SD.
Figure 3
Figure 3. Characterization of Tcf3 over expressing ESCs.
A–B. qRT-PCR (A) and western blot (B) analysis of Tcf3 in ApcNN ESCs stably expressing Tcf3. Wild type and Tcf3 −/− ESCs were used for comparison. Actb was used as an internal control. C. Histogram showing reduction of β-catenin/Tcf reporter activity in ApcNN cells stably expressing Tcf3 (Tcf3 OE) compared to parental ApcNN cells and cells expressing the corresponding empty vector. Luciferase signal from TOP or FOP reporter constructs were measured and TOP/FOP ratios are shown in the graph. Bars represent n = 3 ± SD. D. Histogram showing the percent of alkaline phosphatase (AP) positive colonies formed by plating 500 FACS-sorted cells in N2B27 medium after 7 days. N2B27 medium was supplemented with different combinations of LIF, PD and CHIRON. Two independent ApcNN ESC clones (parental clone and transfected with empty vector) and three independent ApcNN ESC clones expressing Tcf3 (Tcf3 OE) were used. Bars represent n = 3 ± SD. E. Histograms showing relative expression of the pluripotency markers Nanog and the early differentiation markers Fgf5 in different ESCs cultured for 48 h in N2B27 medium. F. Confocal analysis of ES cells stained with Tuj-1-Alexa 488 and counterstained with the far-red nuclear stain DRAQ5. Wild type, ApcNN and ApcNN expressing Tcf3 (Tcf3 OE) ESCs were used in −4/+4 neural differentiation assay and analyzed by immunofluorescence after 13 days of culture. G. Flow cytometric analysis showing expression of the neural progenitor marker Nestin in ApcNN ESCs stably expressing Tcf3 (Tcf3 OE) and their control cells (parental ApcNN clone and ApcNN transfected with the corresponding empty vector) or wild type ESCs. Cells were analyzed by the −4/+4 neural differentiation assay and stained with specific antibody against Nestin and Tuj1 after 13 days of culture. Wild type (WT) ESCs are shown as control to indicate the Tuj1 positive population which is absent in other genotypes (0.1% in average in Tcf3 OE clones). Numbers in the graph represent the percent of Nestin-positive cells. For wild type ESCs the Nestin-positive populations before and after excluding the mature neurons are shown. See also Figure S4 for defining different FACS gates.
Figure 4
Figure 4. Rescue of Tcf3 expression in ApcNN ESCs partially restores in vivo neural differentiation.
Teratoma samples were obtained from wild type, ApcNN and ApcNN stably expressing Tcf3 (Tcf3 OE) ESCs. Tissue sections were stained by H&E, thionin (marker of cartilage differentiation), and by IHC with specific antibodies against the neural differentiation markers GFAP, 2H3 (neurofilaments) and SV2 (synaptic vesicles). Oct4 IHC analysis was used to asses the presence of undifferentiated EC-like cells in the teratomas.
Figure 5
Figure 5. Tcf3 downregulation in wild-type ES cells impairs but does not fully inhibit neural differentiation.
A. Immunohistochemistry analysis was used to evaluate the neural differentiation in teratoma samples derived from Tcf3−/− or their wild type control (GS1) ESCs. Immunostaining with specific antibodies revealed retention of the pluripotency marker Oct4 and expression of the neural markers GFAP, neurofilaments (2H3) and synaptic vesicles (SV2) in Tcf3−/− teratomas. Thionin staining was used to evaluate cartilage differentiation. B. RNAs were isolated from different teratoma samples and analyzed by qRT-PCR for differentiation markers. Dot plots show normalized qRT-PCR values for the neural markers Map2, β-III-Tubulin and GFAP and for the pluripotency markers Oct4 and Nanog among the different teratoma samples. Each dot represents one sample.
Figure 6
Figure 6. Regulation of Tcf3 in ApcNN ESCs is associated with histone modifications.
Schematic representation of mouse Tcf3 locus and the different amplicons (P1–P8) analyzed by QPCR in chromatin immunoprecipitation experiment. Chromatin was isolated from ApcNN and wild type ESCs and was immunoprecipitated with specific antibodies against the activating histone marks (H3K4me3 and H3Ac) and the repression histone marks (H3k27me3 and H3K9me3). The input DNA (chromatin before immunoprecipitation) and immunoprecipitated DNA was quantified by QPCR and using specific primers as described in materials and methods. Values from each amplicon were normalized to input chromatin and fold change was calculated relative to the corresponding negative region (P1). Bars represent n = 2±SD.
Figure 7
Figure 7. The Wnt-regulated miR-211 targets Tcf3 in mouse ESCs.
A. qRT-PCR analysis showing a dosage-dependent up-regulation of miR-211 in different Apc-mutant ESCs. SnoRNA-234 was used as an internal control; bars represent n = 2±SD. B–C. Time course analysis of wild type ESCs treated with Wnt3a conditioned medium (B) or with the GSK-inhibitor SB-216763 (C). L-medium and DMSO were used as controls, respectively. RNAs were isolated at different time points and were subjected to qRT-PCR analysis of miR-211 or snoRNA-234 as an internal control. Bars represent n = 2±SD. D. Western blot analysis of Tcf3 expression in protein lysates isolated from independent clones of wild type ESCs stably expressing miR-211 (miR-211 OE) or the corresponding empty vector (control). Two independent ApcNN clones were included for comparison. E. Schematic representation of the Tcf3-3′-UTR luciferase vector derived from the pmirGLO construct (Promega). Sequence alignment between miR-211 and its target site on Tcf3-3′-UTR. Site directed mutagenesis was used to introduce 7-bp or 4-bp mutations in Tcf3-3′-UTR. F. HEK-293 cells were co-transfected with the Tcf3-3′-UTR luciferase vector, and either with miR-211 or a non-targeting miRNA. Luciferase activity was measured 24 h post-transfection and normalized to Renilla luciferase signal. The same experiment was repeated with the mutant luciferase vectors, MTR1 and MTR2. Asterix represent P-value<0.01 and bars represent n = 3±SEM. G. Flow cytometric analysis of Tuj1 and Nestin in miR-211 over expressing ESCs (miR-211 OE) and their controls (Emp) after 13 days of neural differentiation. Two independent clones were used for each genotype and representative example of each genotype is shown. Numbers in the graph represent the percent of cells in neural (green), progenitor (red) or negative (blue) populations. H. Histogram showing the relative expression of early neural markers Fgf5, Nestin, Pax6 and Sfrp2 in embryoid bodies derived from independent wild type ESCs clones stably expressing miR-211 or the corresponding empty vector. RNAs were isolated at different time points and were analyzed by qRT-PCR for different lineage markers. Bars represent n = 2±SD. I. qRT-PCR analysis of Fgf5, Nestin, Pax6 and Sfrp2 in wild type ESCs stably expressing miR-211 or the corresponding empty vector, cultured for 24 h in N2B27 medium. Bars represent n = 2±SD.

Similar articles

Cited by

References

    1. Kielman MF, Rindapaa M, Gaspar C, van Poppel N, Breukel C, et al. (2002) Apc modulates embryonic stem-cell differentiation by controlling the dosage of beta-catenin signaling. Nat Genet 32: 594–605. - PubMed
    1. Ogawa K, Nishinakamura R, Iwamatsu Y, Shimosato D, Niwa H (2006) Synergistic action of Wnt and LIF in maintaining pluripotency of mouse ES cells. Biochem Biophys Res Commun 343: 159–166. - PubMed
    1. Sato N, Meijer L, Skaltsounis L, Greengard P, Brivanlou AH (2004) Maintenance of pluripotency in human and mouse embryonic stem cells through activation of Wnt signaling by a pharmacological GSK-3-specific inhibitor. Nat Med 10: 55–63. - PubMed
    1. Berge DT, Kurek D, Blauwkamp T, Koole W, Maas A, et al. (2011) Embryonic stem cells require Wnt proteins to prevent differentiation to epiblast stem cells. Nat Cell Biol 13: 1070–1075. - PMC - PubMed
    1. Yi F, Pereira L, Hoffman JA, Shy BR, Yuen CM, et al. (2011) Opposing effects of Tcf3 and Tcf1 control Wnt stimulation of embryonic stem cell self-renewal. Nat Cell Biol 13: 762–770. - PMC - PubMed

Publication types

MeSH terms

Substances

LinkOut - more resources