

RipleyGUI: software for analyzing spatial patterns in 3D cell distributions
- PMID: 23658544
- PMCID: PMC3620507
- DOI: 10.3389/fninf.2013.00005
RipleyGUI: software for analyzing spatial patterns in 3D cell distributions
Abstract
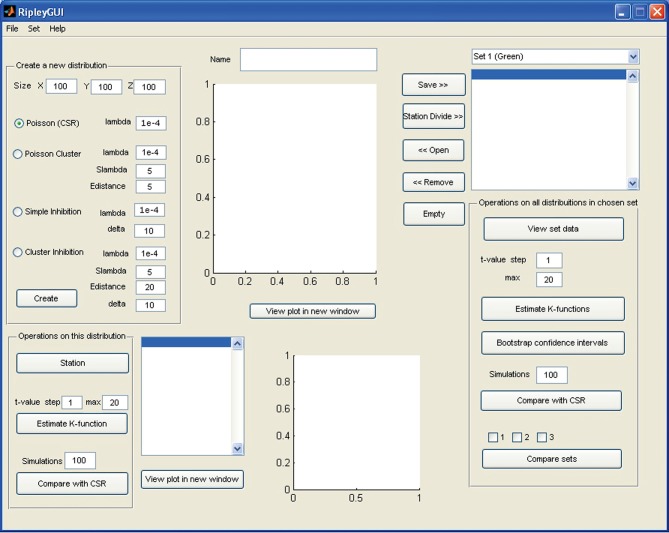
The true revolution in the age of digital neuroanatomy is the ability to extensively quantify anatomical structures and thus investigate structure-function relationships in great detail. To facilitate the quantification of neuronal cell patterns we have developed RipleyGUI, a MATLAB-based software that can be used to detect patterns in the 3D distribution of cells. RipleyGUI uses Ripley's K-function to analyze spatial distributions. In addition the software contains statistical tools to determine quantitative statistical differences, and tools for spatial transformations that are useful for analyzing non-stationary point patterns. The software has a graphical user interface making it easy to use without programming experience, and an extensive user manual explaining the basic concepts underlying the different statistical tools used to analyze spatial point patterns. The described analysis tool can be used for determining the spatial organization of neurons that is important for a detailed study of structure-function relationships. For example, neocortex that can be subdivided into six layers based on cell density and cell types can also be analyzed in terms of organizational principles distinguishing the layers.
Keywords: Ripley's K-function; cell distribution; neuroanatomical method; software; spatial point pattern.
Figures
Similar articles
-
Spatial Point Pattern Analysis of Neurons Using Ripley's K-Function in 3D.Front Neuroinform. 2010 May 21;4:9. doi: 10.3389/fninf.2010.00009. eCollection 2010. Front Neuroinform. 2010. PMID: 20577588 Free PMC article.
-
[Cumulative effects of K-function in the research of point patterns].Ying Yong Sheng Tai Xue Bao. 2022 May;33(5):1275-1282. doi: 10.13287/j.1001-9332.202205.005. Ying Yong Sheng Tai Xue Bao. 2022. PMID: 35730086 Chinese.
-
Three-dimensional distribution of cortical synapses: a replicated point pattern-based analysis.Front Neuroanat. 2014 Aug 26;8:85. doi: 10.3389/fnana.2014.00085. eCollection 2014. Front Neuroanat. 2014. PMID: 25206325 Free PMC article.
-
Generation, description and storage of dendritic morphology data.Philos Trans R Soc Lond B Biol Sci. 2001 Aug 29;356(1412):1131-45. doi: 10.1098/rstb.2001.0905. Philos Trans R Soc Lond B Biol Sci. 2001. PMID: 11545695 Free PMC article. Review.
-
Visual programming for next-generation sequencing data analytics.BioData Min. 2016 Apr 27;9:16. doi: 10.1186/s13040-016-0095-3. eCollection 2016. BioData Min. 2016. PMID: 27127540 Free PMC article. Review.
Cited by
-
Disynaptic cerebrocerebellar pathways originating from multiple functionally distinct cortical areas.Elife. 2020 Aug 14;9:e59148. doi: 10.7554/eLife.59148. Elife. 2020. PMID: 32795386 Free PMC article.
-
Quantitative Imaging of Cholinergic Interneurons Reveals a Distinctive Spatial Organization and a Functional Gradient across the Mouse Striatum.PLoS One. 2016 Jun 17;11(6):e0157682. doi: 10.1371/journal.pone.0157682. eCollection 2016. PLoS One. 2016. PMID: 27314496 Free PMC article.
-
Follicle dynamics and global organization in the intact mouse ovary.Dev Biol. 2015 Jul 1;403(1):69-79. doi: 10.1016/j.ydbio.2015.04.006. Epub 2015 Apr 16. Dev Biol. 2015. PMID: 25889274 Free PMC article.
-
Intercellular bridges coordinate the transition from pluripotency to meiosis in mouse fetal oocytes.Sci Adv. 2021 Apr 7;7(15):eabc6747. doi: 10.1126/sciadv.abc6747. Print 2021 Apr. Sci Adv. 2021. PMID: 33827806 Free PMC article.
-
Statistical analysis of 3D localisation microscopy images for quantification of membrane protein distributions in a platelet clot model.PLoS Comput Biol. 2020 Jun 30;16(6):e1007902. doi: 10.1371/journal.pcbi.1007902. eCollection 2020 Jun. PLoS Comput Biol. 2020. PMID: 32603371 Free PMC article.
References
-
- Armstrong R. A. (2010). Quantitative methods in neuropathology. Folia Neuropathol. 48, 217–230 - PubMed
-
- Baddeley A. J., Moyeed R. A., Howard C. V., Boyde A. (1993). Analysis of a three-dimensional point pattern with replication. Appl. Stat. 42, 641–668
-
- Costa L. D. F., Bonci D. M., Saito C. A., Rocha F. A., Silveira L. C., Ventura D. F. (2007). Voronoi analysis uncovers relationship between mosaics of normally placed and displaced amacrine cells in the thraira retina. Neuroinformatics 5, 59–78 - PubMed
LinkOut - more resources
Full Text Sources
Other Literature Sources