

Filtration parameters influencing circulating tumor cell enrichment from whole blood
- PMID: 23658615
- PMCID: PMC3637225
- DOI: 10.1371/journal.pone.0061774
Filtration parameters influencing circulating tumor cell enrichment from whole blood
Abstract
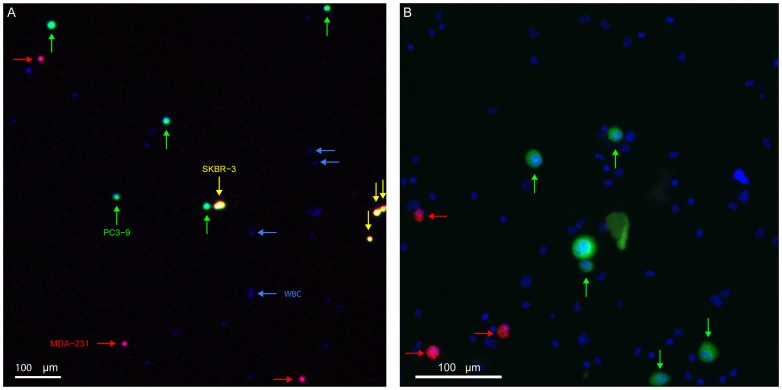
Filtration can achieve circulating tumor cell (CTC) enrichment from blood. Key parameters such as flow-rate, applied pressure, and fixation, vary largely between assays and their influence is not well understood. Here, we used a filtration system, to monitor these parameters and determine their relationships. Whole blood, or its components, with and without spiked tumor cells were filtered through track-etched filters. We characterize cells passing through filter pores by their apparent viscosity; the viscosity of a fluid that would pass with the same flow. We measured a ratio of 5·10(4)∶10(2)∶1 for the apparent viscosities of 15 µm diameter MDA-231 cells, 10 µm white cells and 90 fl red cells passing through a 5 µm pore. Fixation increases the pressure needed to pass cells through 8 µm pores 25-fold and halves the recovery of spiked tumor cells. Filtration should be performed on unfixed samples at a pressure of ∼10 mbar for a 1 cm(2) track-etched filter with 5 µm pores. At this pressure MDA-231 cells move through the filter in 1 hour. If fixation is needed for sample preservation, a gentle fixative should be selected. The difference in apparent viscosity between CTC and blood cells is key in optimizing recovery of CTC.
Conflict of interest statement
Figures


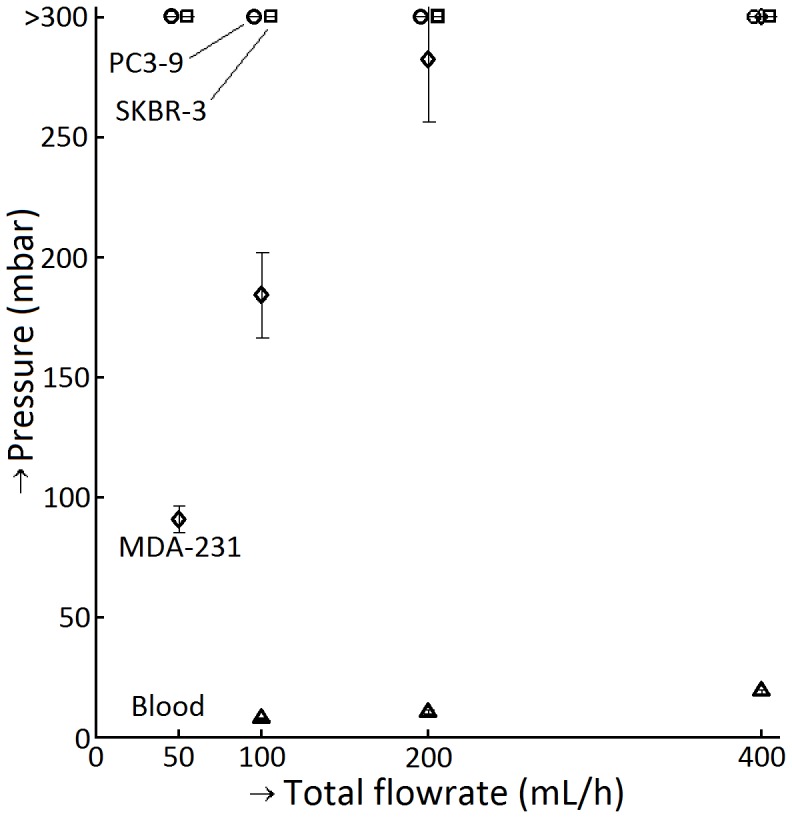

 . All three MDA-231 samples at a flow rate of 400 mL/h clogged.
Similar articles
-
Filter characteristics influencing circulating tumor cell enrichment from whole blood.PLoS One. 2013 Apr 23;8(4):e61770. doi: 10.1371/journal.pone.0061770. Print 2013. PLoS One. 2013. PMID: 23626725 Free PMC article.
-
Enrichment of cancer cells from whole blood using a microfabricated porous filter.Anal Biochem. 2013 Sep 1;440(1):114-6. doi: 10.1016/j.ab.2013.05.016. Epub 2013 Jun 4. Anal Biochem. 2013. PMID: 23747280
-
Combination of Mechanical and Molecular Filtration for Enhanced Enrichment of Circulating Tumor Cells.Anal Chem. 2016 Sep 6;88(17):8510-7. doi: 10.1021/acs.analchem.6b01324. Epub 2016 Aug 9. Anal Chem. 2016. PMID: 27442305
-
Circulating tumor cell technologies.Mol Oncol. 2016 Mar;10(3):374-94. doi: 10.1016/j.molonc.2016.01.007. Epub 2016 Jan 28. Mol Oncol. 2016. PMID: 26897752 Free PMC article. Review.
-
Size-based enrichment technologies for CTC detection and characterization.Recent Results Cancer Res. 2012;195:87-95. doi: 10.1007/978-3-642-28160-0_8. Recent Results Cancer Res. 2012. PMID: 22527497 Review.
Cited by
-
A microfluidic device for label-free isolation of tumor cell clusters from unprocessed blood samples.Biomicrofluidics. 2019 Aug 20;13(4):044111. doi: 10.1063/1.5111888. eCollection 2019 Jul. Biomicrofluidics. 2019. PMID: 31462955 Free PMC article.
-
Self-Seeding Microwells to Isolate and Assess the Viability of Single Circulating Tumor Cells.Int J Mol Sci. 2019 Jan 23;20(3):477. doi: 10.3390/ijms20030477. Int J Mol Sci. 2019. PMID: 30678037 Free PMC article.
-
Filtration Device for On-Site Collection, Storage and Shipment of Cells from Urine and Its Application to DNA-Based Detection of Bladder Cancer.PLoS One. 2015 Jul 7;10(7):e0131889. doi: 10.1371/journal.pone.0131889. eCollection 2015. PLoS One. 2015. PMID: 26151138 Free PMC article.
-
Microfluidic filter device with nylon mesh membranes efficiently dissociates cell aggregates and digested tissue into single cells.Lab Chip. 2018 Sep 11;18(18):2776-2786. doi: 10.1039/c8lc00507a. Lab Chip. 2018. PMID: 30090895 Free PMC article.
-
Detection of circulating tumor cells.Scientifica (Cairo). 2014;2014:819362. doi: 10.1155/2014/819362. Epub 2014 Jul 15. Scientifica (Cairo). 2014. PMID: 25133014 Free PMC article. Review.
References
-
- Cristofanilli M, Budd GT, Ellis MJ, Stopeck A, Matera J, et al. (2004) Circulating tumor cells, disease progression, and survival in metastatic breast cancer. N Engl J Med 351: 781–791. - PubMed
-
- de Bono JS, Scher HI, Montgomery RB, Parker C, Miller MC, et al. (2008) Circulating Tumor Cells Predict Survival Benefit from Treatment in Metastatic Castration-Resistant Prostate Cancer. Clin Cancer Res 14: 6302–6309. - PubMed
-
- Cohen SJ, Punt CJA, Iannotti N, Saidman BH, Sabbath KD, et al. (2008) Relationship of Circulating Tumor Cells to Tumor Response, Progression-Free Survival, and Overall Survival in Patients With Metastatic Colorectal Cancer. J Clin Oncol 26: 3213–3221. - PubMed
-
- Hiltermann TJN, Liesker JJW, van den Berg A, Schouwink JH, Wijnands WJA, et al. (2012) Circulating tumor cells in small cell lung cancer, a predictive and prognostic factor. Ann Oncol 23: 2937–2942. - PubMed
Publication types
MeSH terms
Substances
LinkOut - more resources
Full Text Sources
Other Literature Sources
