Comparative Study
. 2013 May 1;8(5):e61352.
doi: 10.1371/journal.pone.0061352. Print 2013.

Comparative transcriptional profiling of the axolotl limb identifies a tripartite regeneration-specific gene program

Affiliations
Comparative Study

Comparative transcriptional profiling of the axolotl limb identifies a tripartite regeneration-specific gene program

Dunja Knapp et al. PLoS One. .

Abstract

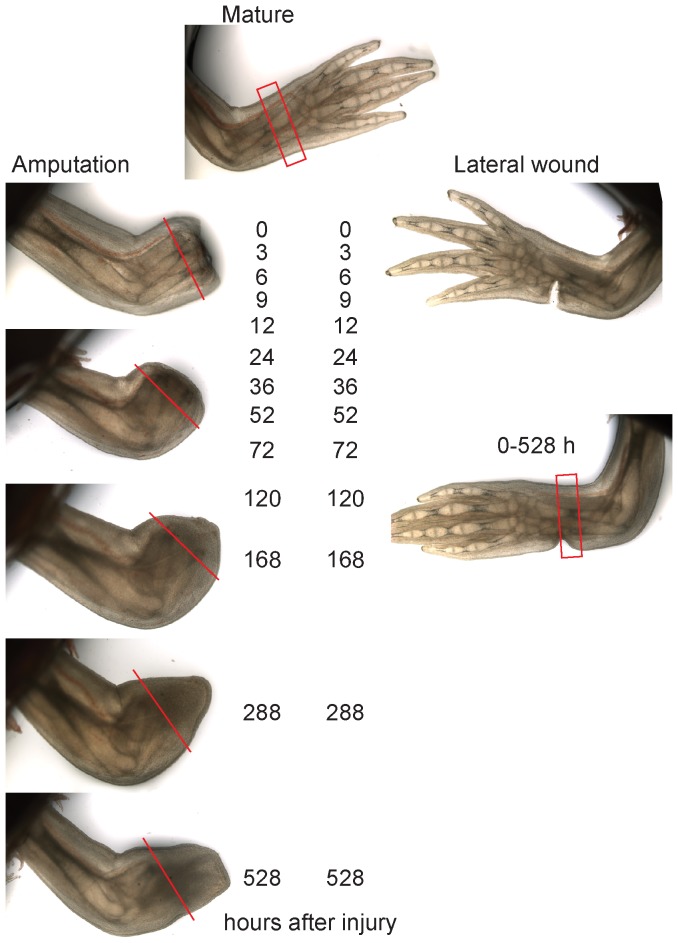
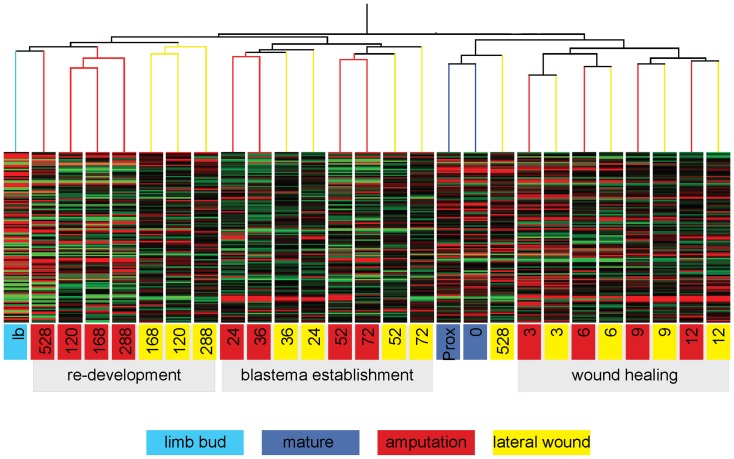
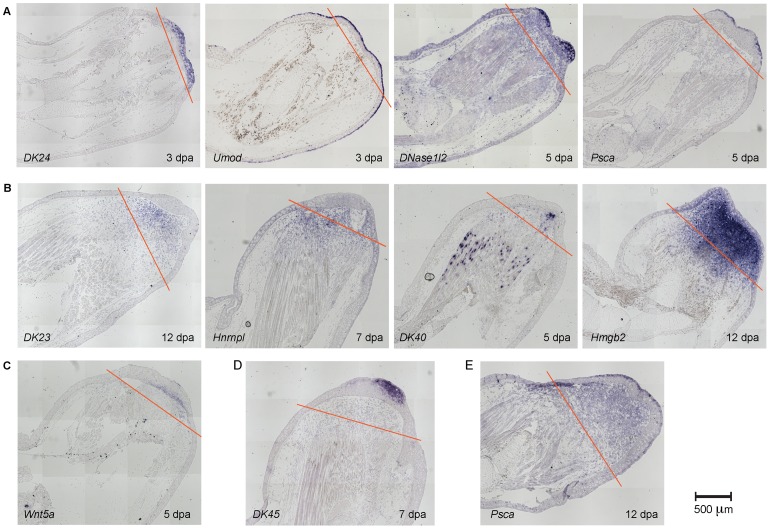
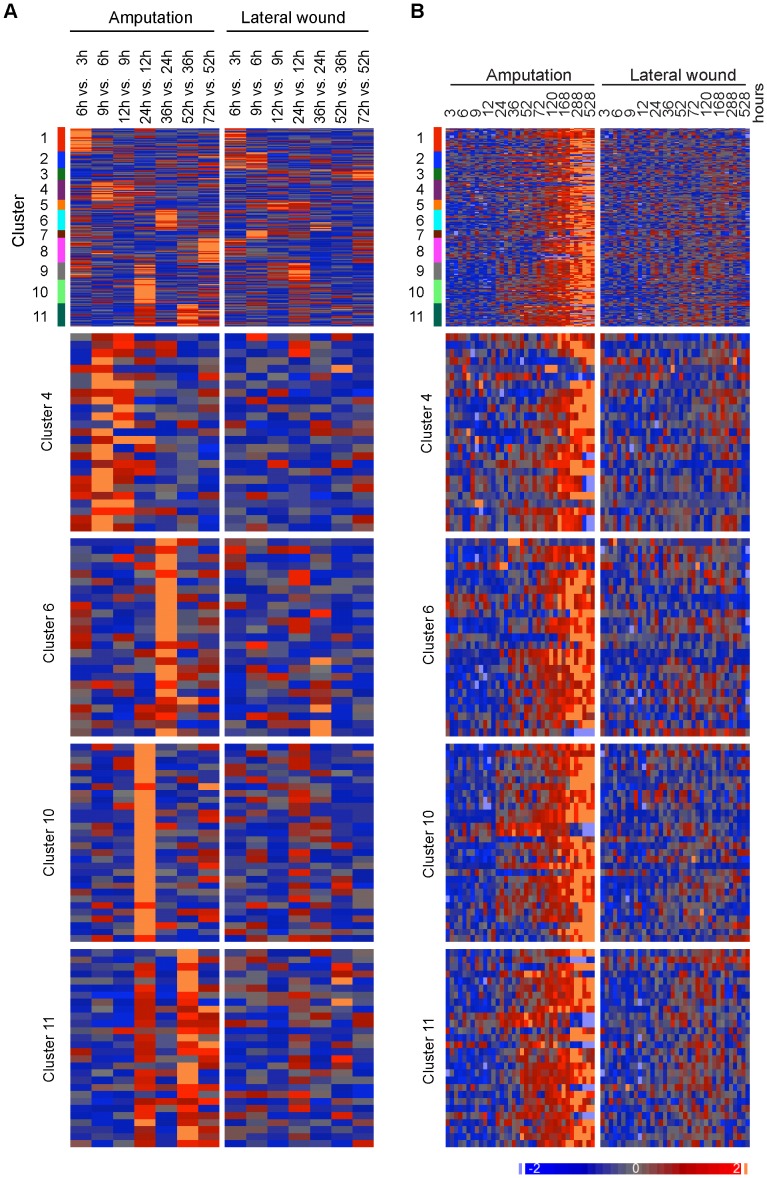
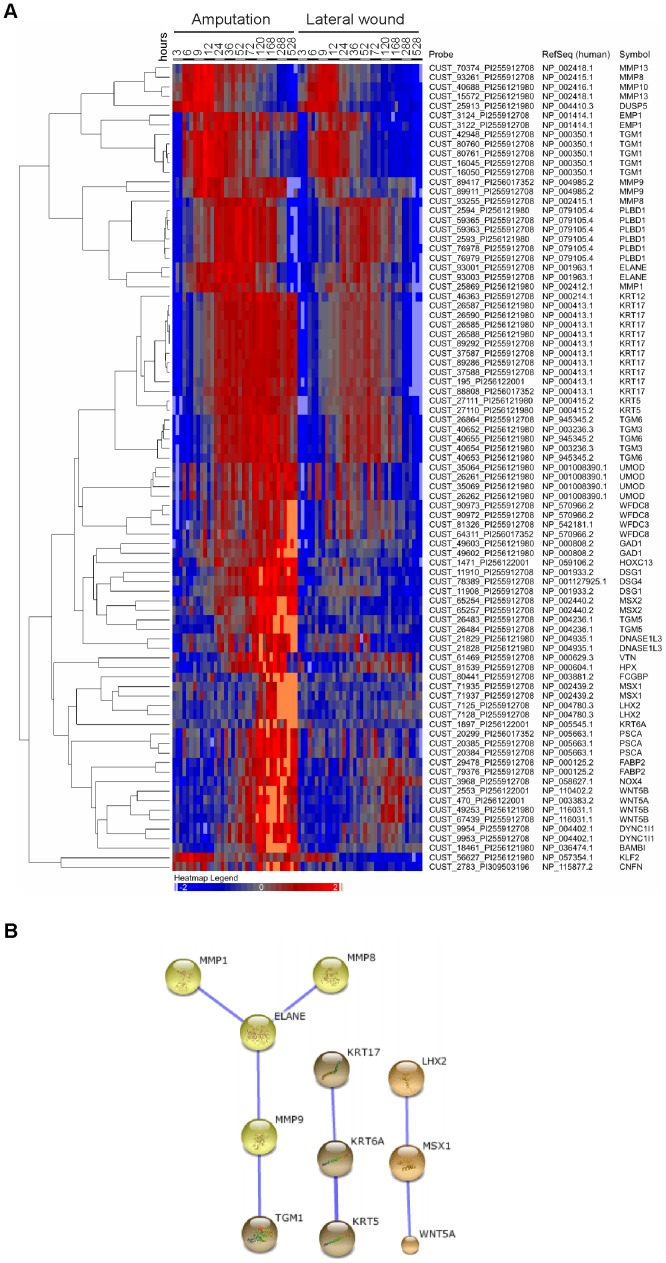
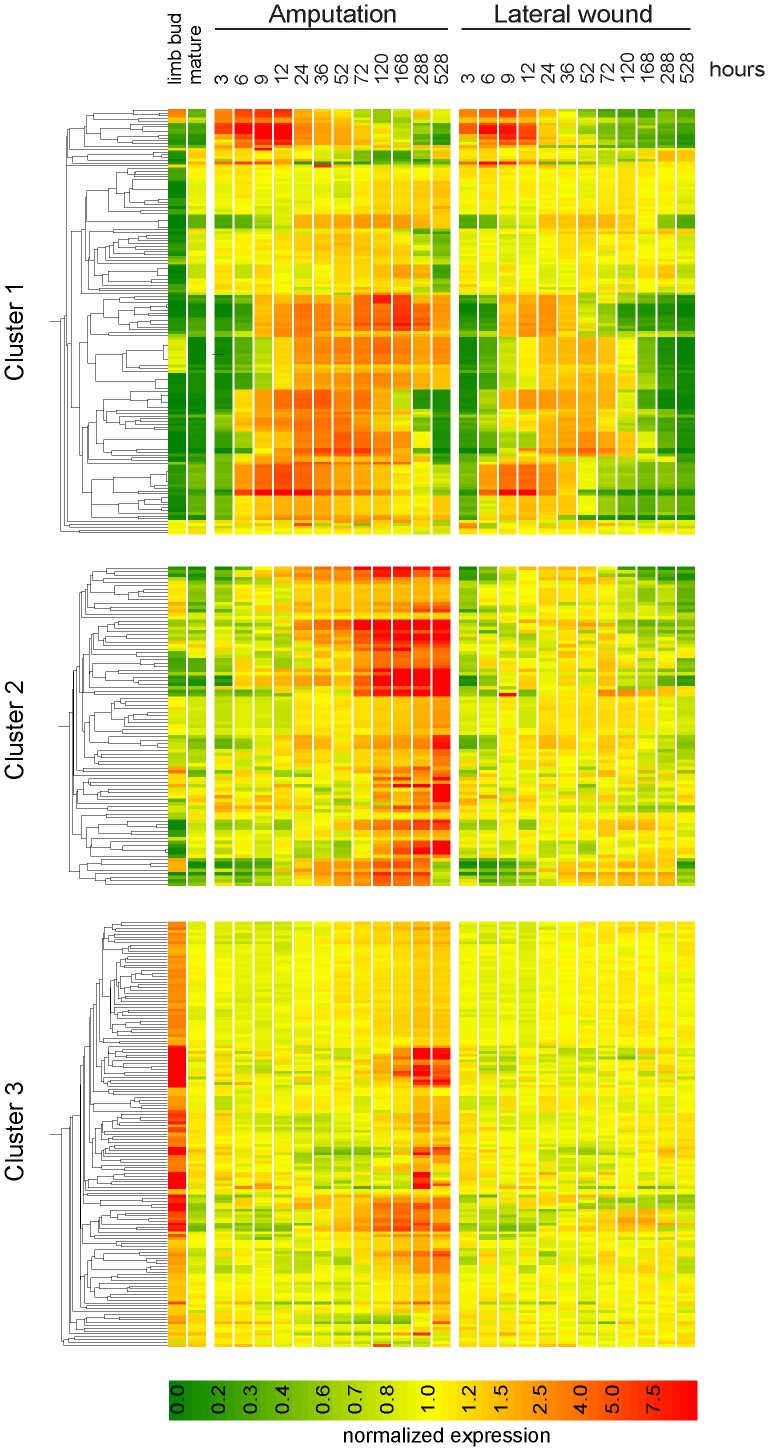
Understanding how the limb blastema is established after the initial wound healing response is an important aspect of regeneration research. Here we performed parallel expression profile time courses of healing lateral wounds versus amputated limbs in axolotl. This comparison between wound healing and regeneration allowed us to identify amputation-specific genes. By clustering the expression profiles of these samples, we could detect three distinguishable phases of gene expression - early wound healing followed by a transition-phase leading to establishment of the limb development program, which correspond to the three phases of limb regeneration that had been defined by morphological criteria. By focusing on the transition-phase, we identified 93 strictly amputation-associated genes many of which are implicated in oxidative-stress response, chromatin modification, epithelial development or limb development. We further classified the genes based on whether they were or were not significantly expressed in the developing limb bud. The specific localization of 53 selected candidates within the blastema was investigated by in situ hybridization. In summary, we identified a set of genes that are expressed specifically during regeneration and are therefore, likely candidates for the regulation of blastema formation.


Conflict of interest statement

Competing Interests: The authors have declared that no competing interests exist.

Figures

Figure 1
Figure 1. Comparative transcriptome profiling of regeneration versus lateral wounding in the axolotl limb.
Live images of amputation and lateral wound limb samples spanning 0–528 hours (22 days) after injury. The red lines in the amputated series depict the plane approximately 2 mm behind the amputation plane. All tissue distal to the line was collected for the microarray sample. In the mature limb and lateral wound series the collected tissue is depicted by red rectangles.
Figure 2
Figure 2. Validation of the gene expression profiling using microarray.
A. Validation of gene expression changes by qPCR The expression profiles of seven representative genes- two with a strong signal from the microarray (Psca and DK45 (RV_Am_asm_3322)), two with medium signal (Wnt5a and Wnt5b) and three with a weak signal (Fgf10, Tgm5 and DK35 (ET_Am_asm_6446)) are shown. Time course of gene expression measured by microarray is shown on left, and qPCR on the right. The replicates of the microarray were normalized as described in the Methods section. qPCR data were normalized to the levels of Rpl4 (Large ribosomal protein 4), which showed uniform expression levels in all microarray samples. In both, microarray and qPCR data, the normalized expression level at 0 hours is set to 1. The gene profiles obtained by microarray and by qPCR are remarkably similar although the dynamic range is 2–3 fold greater when measured by qPCR. All data points represent the mean of three biological replicates. Error bars show standard deviation. B. Validation of the time-course progression Cell cycle regulator expression reflects blastema formation in the regeneration time course. Top, G1/S-genes, Mcm and Pcna show a second peak at 288 hours in regeneration sample but not in the lateral wound sample. Bottom, G2/M-genes, CyclinB, Plk, Cdc20, remain highly expressed in the regeneration time course whereas they decline by 168 hours in the lateral wound time course. Each line depicts the trace of one representative probe for the gene averaged over three replicates with the error bars representing standard deviation. For each probe the median value of all measurements is set to 1. Solid lines: amputation time course, dotted line: lateral wound time course. See also Figure S1.
Figure 3
Figure 3. Hierarchical clustering of regeneration, lateral wound and limb bud samples identifies three main phases of limb regeneration.
Samples were clustered using Pearson's correlation as similarity measure (sample key at bottom; numbers represent hours after injury, Prox =  mature sample from the upper arm at time 0 h, all other samples are from the lower arm). From 0–12 hours, at each time point, corresponding amputation and lateral wound samples cluster closest together. Starting at 24 hours, successive amputation samples are more similar to each other than to the corresponding lateral wound time points, indicating a divergence between regeneration and lateral wound gene programs. From 120 hours onward, the amputated samples are most similar to the developing limb bud, indicating that the limb development program has been re-established.
Figure 4
Figure 4. Two-way ANOVA analysis of parallel amputation and lateral wound time course yields regeneration-specific genes.
Ribbon (left) and heat map (right) visualization of five signal clusters that emerged from 600 probes with amputation-specific regulation in limb. The heatmap shows log2 of standard scores of signal values (signal values normalized to a probe mean of zero and a standard deviation of one). Up-regulation is indicated by reds with increasing intensities, down-regulation by blues with increasing intensities. The genes in cluster 3, 4 and 5 were pursued.
Figure 5
Figure 5. Similarity clustering and STRING analysis of the regeneration-specific genes identified by two-way ANOVA analysis.
A. Heat map of 150 probes (with 93 different human homolog assignments) that are up-regulated in regenerating but not in lateral wound samples shows a diversity of expression kinetics. log2 values of standard scores of normalized signal are shown. Up-regulation is indicated by red, down-regulation by blue color. B. STRING analysis of the gene set showing only high confidence functional connections (confidence score ≥0.7). Five functional networks are identified: response to oxidative and cellular stress (yellow), ribonucleoprotein network (red), chromatin-remodeling (blue), epithelial cluster (green), development cluster (pink). Large balls represent gene families where a structure is available. Six identifiers were not recognized by STRING 9.0 interface and therefore 87 candidates were considered). See also Table S1, and Figure S5.
Figure 6
Figure 6. In situ hybridization on limb sections confirms a diversity of regeneration-specific expression patterns.
A. Genes expressed in different layers of the wound epidermis. B. Genes expressed in the mesenchymal blastema or stump. C. Expression of Wnt5a in the basal epidermis of the amputated stump but not in the lateral injury. D. Expression of DK45 in the limited region of the wound epidermis. E. In addition to wound epidermis, at 12 dpa, Psca is also expressed in the mesenchyme. Red lines depict the amputation plane. dpa =  days post amputation, dplw =  days post lateral wound. For comparison see the staining of lateral wound sections in Figure S3.
Figure 7
Figure 7. Selection of early regeneration-specific genes up-regulated during the blastema establishment-phase (3 and 72 hours after injury).
A, B. Heat map visualization of all eleven p-value clusters that emerged from the 246 probes with up-regulation in limb amputation (top), and of four selected clusters with early up-regulation (4, 6, 10 and 11). A. Heat map of –log10 LSD p-values normalized to a mean of zero and a standard deviation of one. Values are calculated between consecutive time points from 3 to 72 hours after limb amputation and lateral wound. B. Heat map of log2 signal values normalized to a mean of zero and a standard deviation of one, shown for amputated limb and lateral wound between 3 and 528 hours after injury.
Figure 8
Figure 8. Similarity clustering and STRING analysis of the regeneration-enriched genes selected by pairwise comparison between amputation and lateral wound.
A. Heat map of 85 probes (representing 44 genes with a assigned human Refseq homolog) up-regulated in regenerating but not or only weakly in the lateral wound samples shows a diversity of expression kinetics. log2 values of standard scores of normalized signal are shown. Up-regulation is indicated by reds with increasing intensities, down-regulation by blues with increasing intensities. B. STRING analysis of the gene set showing only high confidence functional connections (confidence score ≥0.7). ECM remodeling network including MMPs and elastase is shown in yellow, epithelial organization network in brown and the limb bud network including WNT5A, MSX1, LHX2 in orange color balls. Five identifiers were not recognized by STRING 9.0 interface and therefore 39 candidates were considered). See also Figure S5.
Figure 9
Figure 9. Heat map of 395 probes (all probes selected either by two-way ANOVA or by pairwise comparison) relating gene expression after injury with the expression in the limb bud.
Three clusters were identified by K-means clustering. Gene trees are made on each of the clusters separately by using Pearson's correlation as similarity measure. Genes in clusters 1 (A) and 2 (B) are generally expressed at low levels in the limb bud, while genes in the cluster 3 were highly expressed in the limb bud. For identification of individual probes shown in the heat map see Figure S6.

References

    1. Stocum DL, Cameron JA (2011) Looking proximally and distally: 100 years of limb regeneration and beyond. Dev Dyn 240: 943–968. - PubMed
    1. Carlson BM (2003) Muscle regeneration in amphibians and mammals: passing the torch. Dev Dyn 226: 167–181. - PubMed
    1. Weiss P (1925) Unabhängigkeit der Extremitäten regeneration vom Skelett (bei Triton cristatus). Wilhelm Roux' Arch Entwicklungsmech Org 104: 359–394.
    1. Hutchison C, Pilote M, Roy S (2007) The axolotl limb: a model for bone development, regeneration and fracture healing. Bone 40: 45–56. - PubMed
    1. Satoh A, Cummings GM, Bryant SV, Gardiner DM (2010) Neurotrophic regulation of fibroblast dedifferentiation during limb skeletal regeneration in the axolotl (Ambystoma mexicanum). Dev Biol 337: 444–457. - PubMed

Publication types

Substances