. 2013 May 3;8(5):e62627.
doi: 10.1371/journal.pone.0062627. Print 2013.

Endoplasmic reticulum stress-induced resistance to doxorubicin is reversed by paeonol treatment in human hepatocellular carcinoma cells

Affiliations

Endoplasmic reticulum stress-induced resistance to doxorubicin is reversed by paeonol treatment in human hepatocellular carcinoma cells

Lulu Fan et al. PLoS One. .

Abstract

Background: Endoplasmic reticulum stress (ER stress) is generally activated in solid tumors and results in tumor cell anti-apoptosis and drug resistance. Paeonol (Pae, 2-hydroxy-4-methoxyacetophenone), is a natural product extracted from the root of Paeonia Suffruticosa Andrew. Although Pae displays anti-neoplastic activity and increases the efficacy of chemotherapeutic drugs in various cell lines and in animal models, studies related to the effect of Pae on ER stress-induced resistance to chemotherapeutic agents in hepatocellular carcinoma (HCC) are poorly understood.

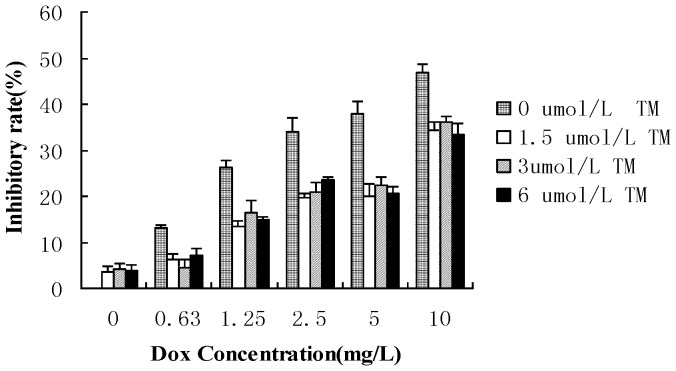
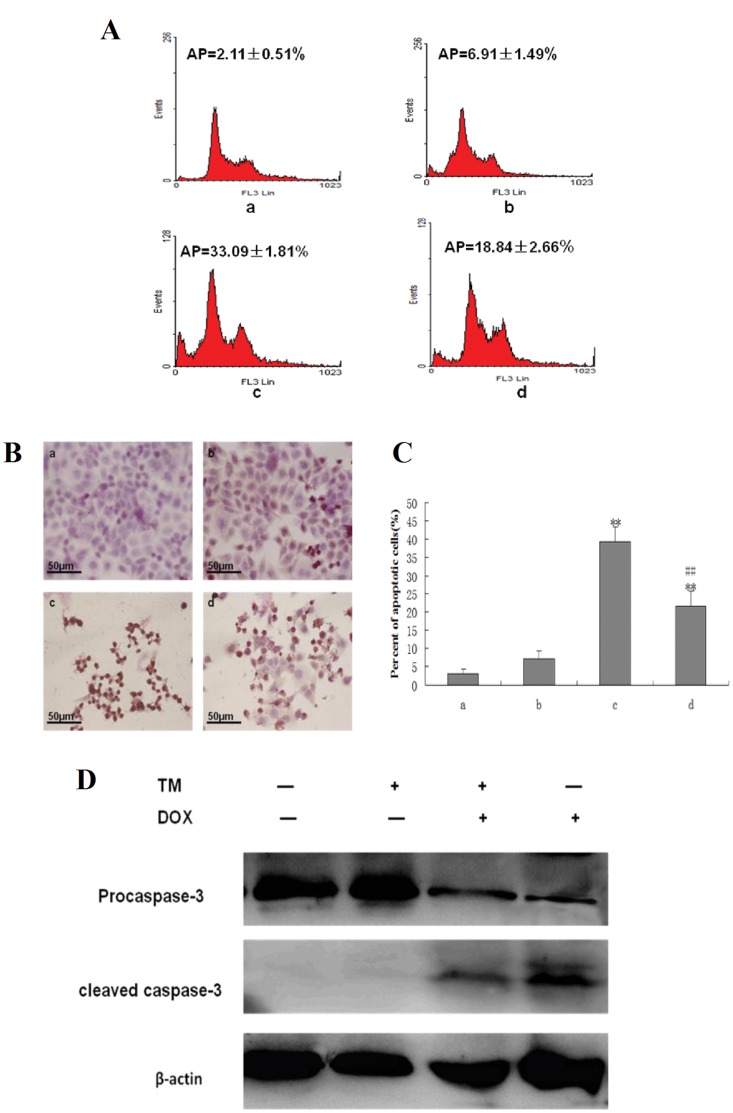
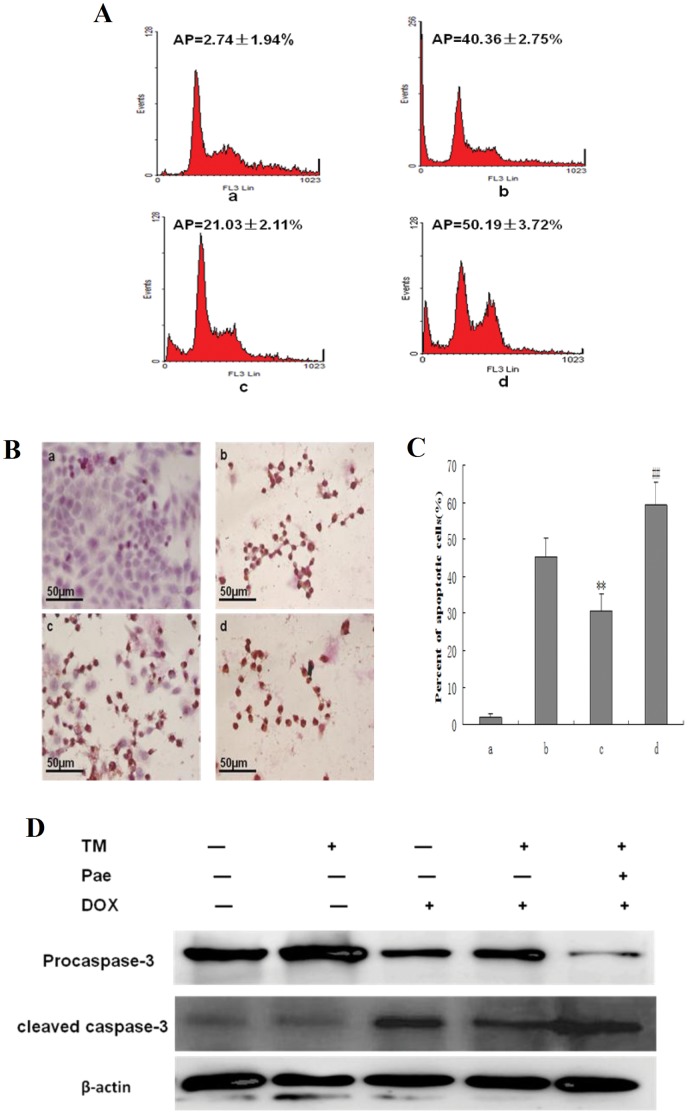
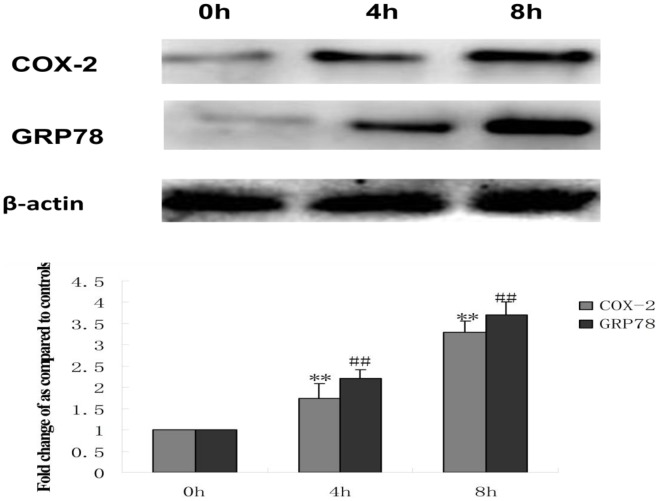
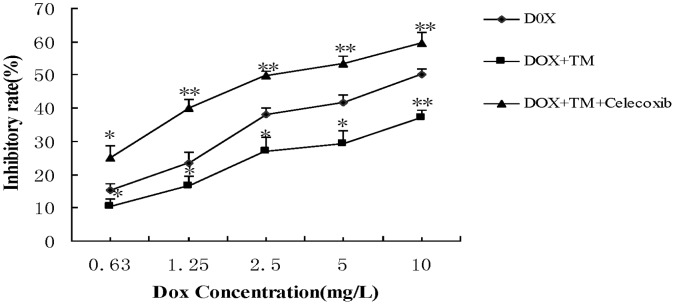
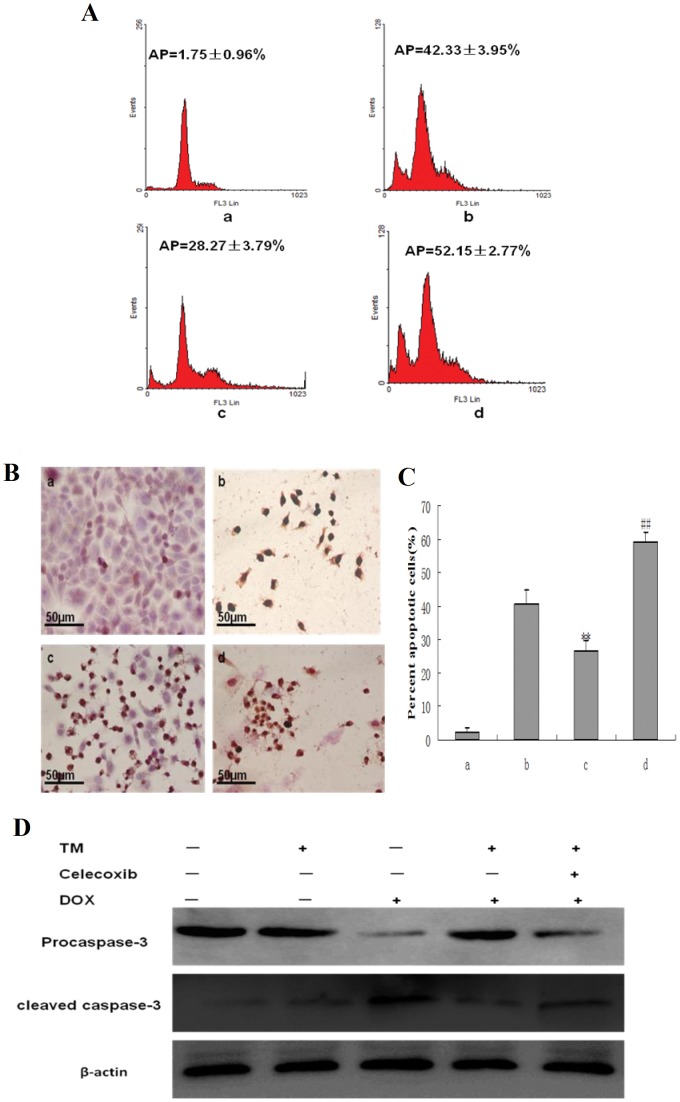
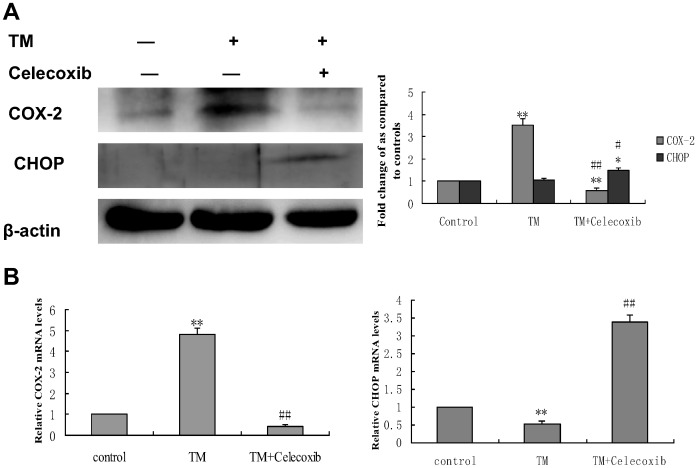
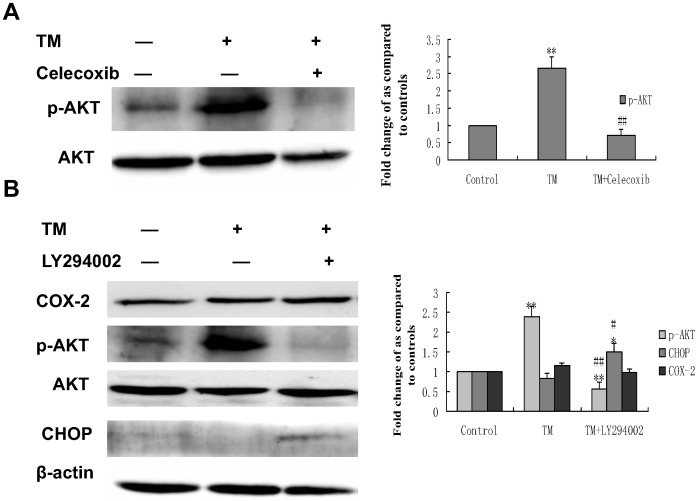
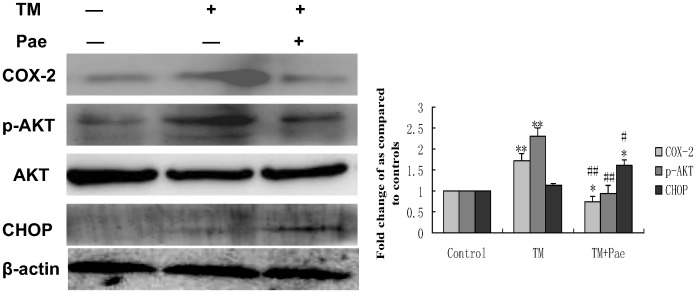
Methodology/principal findings: In this study, we investigated the effect of the endoplasmic reticulum (ER) stress response during resistance of human hepatocellular carcinoma cells to doxorubicin. Treatment with the ER stress-inducer tunicamycin (TM) before the addition of doxorubicin reduced the rate of apoptosis induced by doxorubicin. Interestingly, co-pretreatment with tunicamycin and Pae significantly increased apoptosis induced by doxorubicin. Furthermore, induction of ER stress resulted in increasing expression of COX-2 concomitant with inactivation of Akt and up-regulation of the pro-apoptotic transcription factor CHOP (GADD153) in HepG2 cells. These cellular changes in gene expression and Akt activation may be an important resistance mechanism against doxorubicin in hepatocellular carcinoma cells undergoing ER stress. However, co-pretreatment with tunicamycin and Pae decreased the expression of COX-2 and levels of activation of Akt as well as increasing the levels of CHOP in HCC cells.

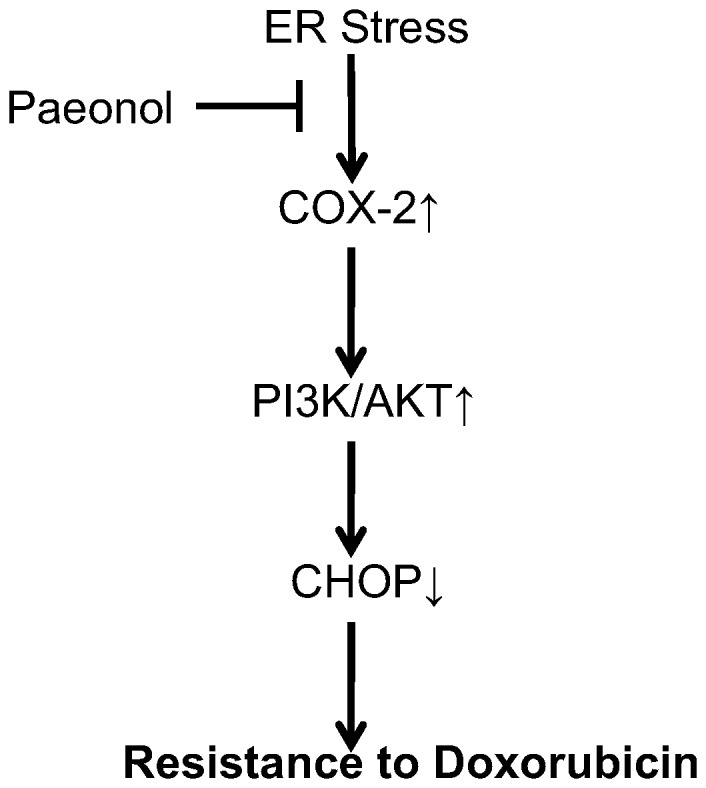
Conclusions/significance: Our results demonstrate that Pae reverses ER stress-induced resistance to doxorubicin in human hepatocellular carcinoma cells by targeting COX-2 mediated inactivation of PI3K/AKT/CHOP.


Conflict of interest statement

Competing Interests: The authors have declared that no competing interests exist.

Figures

Figure 1
Figure 1. Effect of tunicamycin on cell viability induced by doxorubicin in HepG2 cells.
HepG2 cells were pretreated with tunicamycin (0,1.5,3 and 6 µ mol/L) for 8 hr then exposed to different concentrations of doxorubicin (0, 0.63, 1.25, 2.5, 5 and 10 mg/L) for 24 hr. Cell viability of HepG2 cells was determined by the MTT assay. Data are expressed as the mean ± SD of three independent experiments (bars represent S.D.). (*P<0.05, **P<0.01, compared with HepG2 cells treated with doxorubicin alone).
Figure 2
Figure 2. Effect of tunicamycin treatment on cell apoptosis induced by doxorubicin in HepG2 cells.
(A) HepG2 cells were pretreated with 3 µmol/L tunicamycin (TM) for 8 hr and then exposed to doxorubicin (2.5 mg/L) for 24 hr. Sub-G1 analysis in HepG2 cells were determined by FACS, and the data are expressed as the mean ± SD of three independent experiments. a: Untreated HepG2 cells; b: HepG2 cells treated with tunicamycin alone; c: HepG2 cells treated with doxorubicin alone; d: HepG2 cells were pretreated with tunicamycin for 8 hr, and then exposed to doxorubicin for 24 hr. (B) and (C) Cell morphology and percentage of apoptotic cells was examined by TUNEL staining. In this representative image, the cells with brown nuclei are apoptotic cells. a: Untreated HepG2 cells; b: HepG2 cells treated with tunicamycin alone; c: HepG2 cells treated with doxorubicin alone; d: HepG2 cells were pretreated with tunicamycin for 8 hr, and then exposed to doxorubicin for 24 hr. Data are presented as mean ± SD of three independent experiments (bars represent S.D.). (**P<0.01, compared with untreated HepG2 cells; ##P<0.01, compared with doxorubicin alone) (D) Cleaved caspase-3 as an apoptotic marker were measured by western blot using specific anti- caspase-3 antibody. β-actin in the same HepG2 cells extract was used as an internal reference.
Figure 3
Figure 3. Effect of co-pretreatment with Pae and tunicamycin on apoptosis induced by doxorubicin in HepG2 cells.
(A) HepG2 cells were treated with 3 µmol/L tunicamycin for 8 hr, either in the absence or the presence of 31.25 mg/L Pae and then exposed to doxorubicin (2.5 mg/L) for 24 hr. Apoptosis was analyzed as the sub-G1 fraction by fluorescence-activated cell sorting (FACS). a: Untreated HepG2 cells; b: HepG2 cells treated with doxorubicin alone; c: HepG2 cells co-pretreated with tunicamycin, and then exposed to doxorubicin for 24 hr d:HepG2 cells co-pretreated with tunicamycin and Pae, and then exposed to doxorubicin for 24 hr. (B) and(C) Cell morphology and percentage of apoptotic cells was examined by TUNEL staining. a: Untreated HepG2 cells; b: HepG2 cells treated with doxorubicin alone; c: HepG2 cells pretreated with tunicamycin, and then exposed to doxorubicin for 24 hr d:HepG2 cells co-pretreated with tunicamycin and Pae and then exposed to doxorubicin for 24 hr.Data are presented as mean ± SD for the three independent experiments. (**P<0.01 compared with HepG2 cells treated with doxorubicin alone, ##P<0.01 compared with HepG2 cells pretreated with tunicamycin, and then exposed to doxorubicin for 24 hr). (D) Cleaved caspase-3 as an apoptotic marker were measured by western blot using specific anti- caspase-3 antibody. β-actin in the same HepG2 cells extract was used as an internal reference.
Figure 4
Figure 4. Effect of tunicamycin treatment on the expression of COX-2 and GRP78 in HepG2 cells.
HepG2 cells were treated with 3 µmol/L tunicamycin (TM) for 0 (control), 4 and 8 hr. Equal protein amounts of cell lysates were subjected to western blot assay using specific anti-COX-2 and anti-GRP78 antibody. β-actin in the same HepG2 cells extract was used as an internal reference. Optical density reading values of the specific protein versus the loading control protein β-actin are represented as fold of the control values. (**P<0.01, ##P<0.01,compared with untreated HepG2 cells).
Figure 5
Figure 5. Effect of co-pretreatment with tunicamycin and celecoxib on cell viability induced by doxorubicin in HepG2 cells.
HepG2 cells were pretreated with 3 µmol/L tunicamycin for 8 hr, either in the absence or the presence of celecoxib (50 µmol/L) and then exposed to doxorubicin (2.5 mg/L) for 24 hr. Cell viability of HepG2 cells was determined by the MTT assay. Data are expressed as the mean ± SD of three independent experiments (bars represent S.D.). (*P<0.05, **P<0.01, compared with HepG2 cells pretreated with tunicamycin, and then exposed to doxorubicin for 24 hr).
Figure 6
Figure 6. Effect of co-pretreatment with tunicamycin and celecoxib on apoptosis induced by doxorubicin in HepG2 cells.
(A) HepG2 cells were pretreated with 3 µmol/L tunicamycin for 8 hr, either in the absence or the presence of celecoxib (50 µmol/L) and then exposed to doxorubicin (2.5 mg/L) for 24 hr. Apoptosis was analyzed as the sub-G1 fraction by fluorescence-activated cell sorting (FACS). a: Untreated HepG2 cells; b: HepG2 cells treated with doxorubicin alone; c: HepG2 cells pretreated with tunicamycin, and then exposed to doxorubicin for 24 hr d:HepG2 cells co-pretreated with tunicamycin and celecoxib, and then exposed to doxorubicin for 24 hr. (B) and(C) Cell morphology and percentage of apoptotic cells was examined by TUNEL staining. a: Untreated HepG2 cells; b: HepG2 cells treated with doxorubicin alone; c: HepG2 cells pretreated with tunicamycin, and then exposed to doxorubicin for 24 hr d: HepG2 cells co-pretreated with tunicamycin and celecoxib, and then exposed to doxorubicin for 24 hr. Data are presented as mean ± SD for the three independent experiments. (**P<0.01 compared with HepG2 cells treated with doxorubicin alone, ##P<0.01 compared with HepG2 cells pretreated with tunicamycin, and then exposed to doxorubicin for 24 hr). (D) Cleaved caspase-3 as an apoptotic marker were measured by western blot using specific anti- caspase-3 antibody. β-actin in the same HepG2 cells extract was used as an internal reference.
Figure 7
Figure 7. Effect of co-treatment with tunicamycin and celecoxib on the expression of COX-2 and CHOP in HepG2 cells.
HepG2 cells were treated with 3 µmol/L tunicamycin in either the absence (control) or the presence of celecoxib (50 µmol/L) for 8 hr. (A)Equal amounts of cell lysates were subjected to western blot analysis using specific anti-COX-2 and anti-CHOP antibody. β-actin in the same HepG2 cells extract was used as an internal used as an internal reference. Optical density reading values of the specific protein versus the loading control protein β-actin are represented as fold of the control values. (*P<0.05, **P<0.01, compared with untreated HepG2 cells, #P<0.05, ##P<0.01, compared with HepG2 cells treated with tunicamycin alone). (B) RNA was harvested and gene expression examined by qRT-PCR. The qRT-PCR fold-changes were normalised using the expression of a housekeeping gene (GAPDH) and compared with those obtained from untreated HepG2 cells.Data are presented as mean ± SD for the three independent experiments. (**P<0.01 compared with untreated HepG2 cells, ##P<0.01 compared with HepG2 cells pretreated with tunicamycin).
Figure 8
Figure 8. Effect of co-treatment with tunicamycin and celecoxib/LY294002 on the expression of phospho (p)-Akt and CHOP in HepG2 cells.
HepG2 cells were treated with 3 µmol/L tunicamycin in either the absence (control) or the presence of celecoxib(A)(50 µmol/L)/LY294002(B) (30 µmol/L) for 8 hr. Equal amounts of cell lysates were subjected to western blot analysis using specific anti-COX-2, anti-p-AKT, anti-AKT and anti-CHOP antibody. β-actin in the same HepG2 cells extract was used as an internal used as an internal reference. Optical density reading values of the specific protein versus the loading control protein β-actin are represented as fold of the control values. (*P<0.05, **P<0.01, compared with untreated HepG2 cells, #P<0.05, ##P<0.01, compared with HepG2 cells treated with tunicamycin alone).
Figure 9
Figure 9. Effect of co-treatment with Pae and tunicamycin on the expression of COX-2, phospho (p)-Akt and CHOP in HepG2 cells.
Whole cell lysates from HepG2 cells with treatment with 3 µmol/L tunicamycin (TM) in either the absence (control) or the presence of 31.25 mg/LPae for 8 hr were subjected to western blotting analysis. β-actin in the same HepG2 cells extract was used as an internal used as an internal reference. Optical density reading values of the specific protein versus the loading control protein β-actin are represented as fold of the control values. (*P<0.05, **P<0.01, compared with untreated HepG2 cells, #P<0.05, ##P<0.01, compared with HepG2 cells treated with tunicamycin alone).
Figure 10
Figure 10. Schematic model of ER stress-mediated resistance to doxorubicin reversed by Paeonol in human hepatocellular carcinoma cells.

Similar articles

Cited by

References

    1. Lencioni R, Chen XP, Dagher L, Venook AP (2010) Treatment of intermediate/advanced hepatocellular carcinoma in the clinic: how can outcomes be improved? Oncologist 15 Suppl 442–52. - PubMed
    1. Mendizabal M, Reddy KR (2009) Current management of hepatocellular carcinoma.Med Clin North Am 93:885–900, viii. - PubMed
    1. Kapoor A, Sanyal AJ (2009) Endoplasmic reticulum stress and the unfolded protein response.Clin Liver Dis. 13: 581–590. - PubMed
    1. Rasheva VI, Domingos PM (2009) Cellular responses to endoplasmic reticulum stress and apoptosis. Apoptosis 14: 996–1007. - PubMed
    1. Rutkowski DT, Hegde RS (2010) Regulation of basal cellular physiology by the homeostatic unfolded protein response.J Cell Biol. 189: 783–794. - PMC - PubMed

Publication types

MeSH terms