. 2013 May 2;8(5):e63191.
doi: 10.1371/journal.pone.0063191. Print 2013.

Metabolic turnover of synaptic proteins: kinetics, interdependencies and implications for synaptic maintenance

Affiliations

Metabolic turnover of synaptic proteins: kinetics, interdependencies and implications for synaptic maintenance

Laurie D Cohen et al. PLoS One. .

Abstract

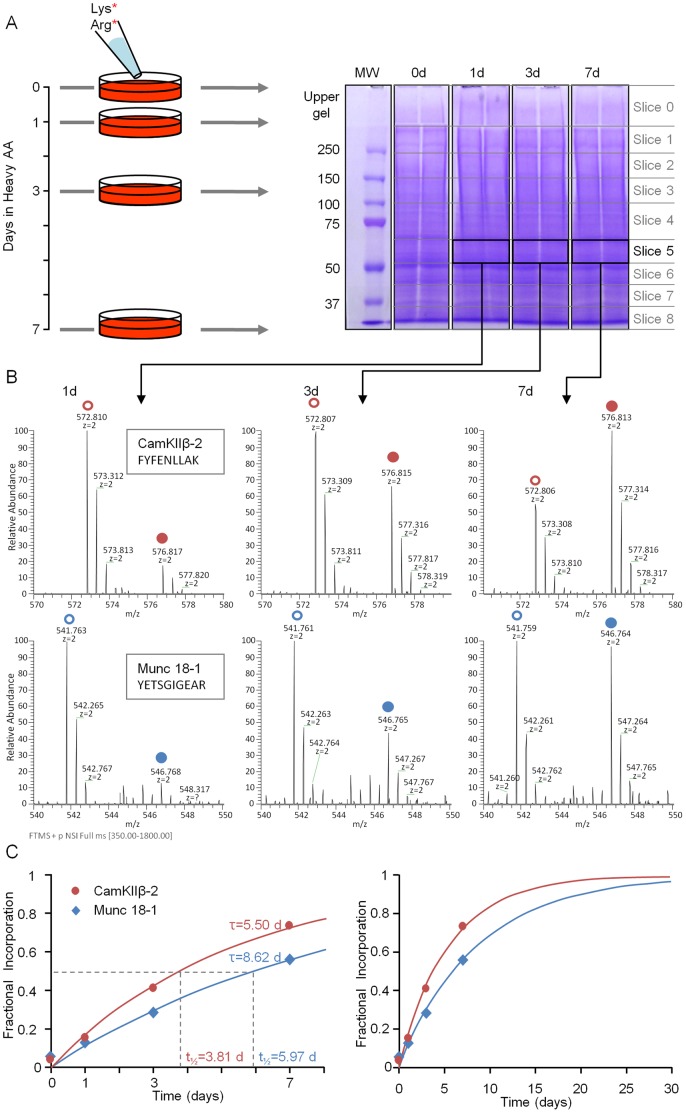
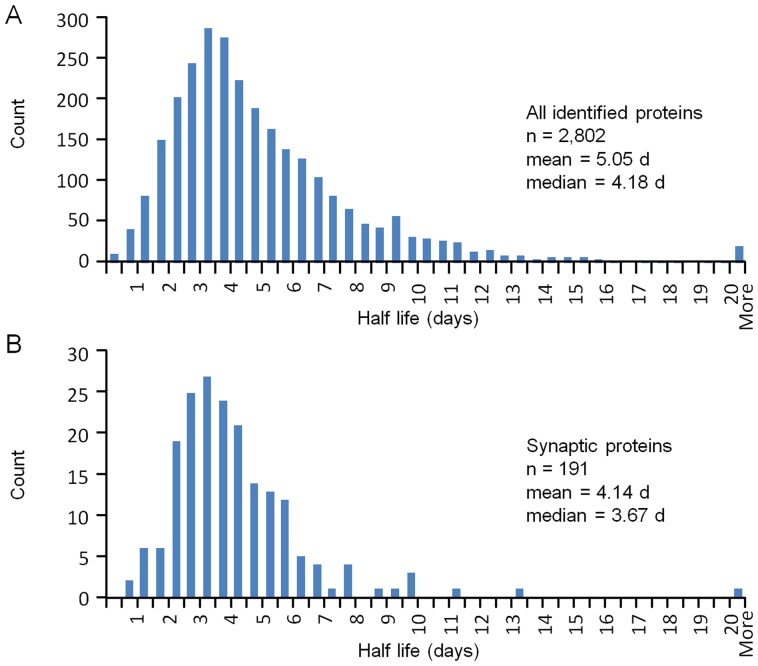
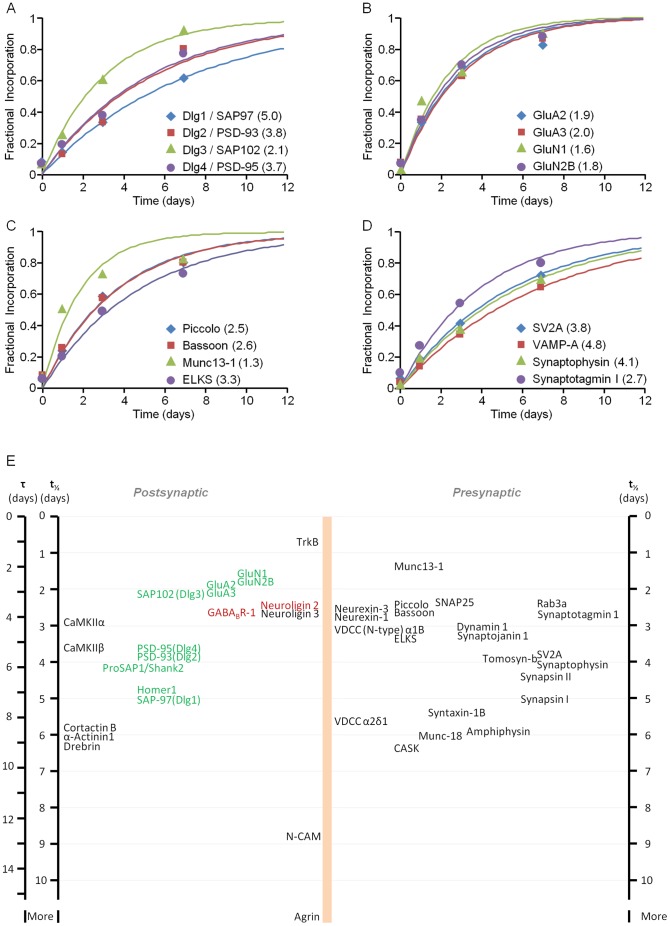
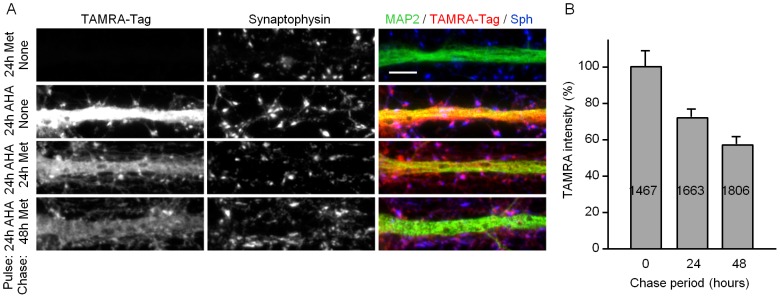
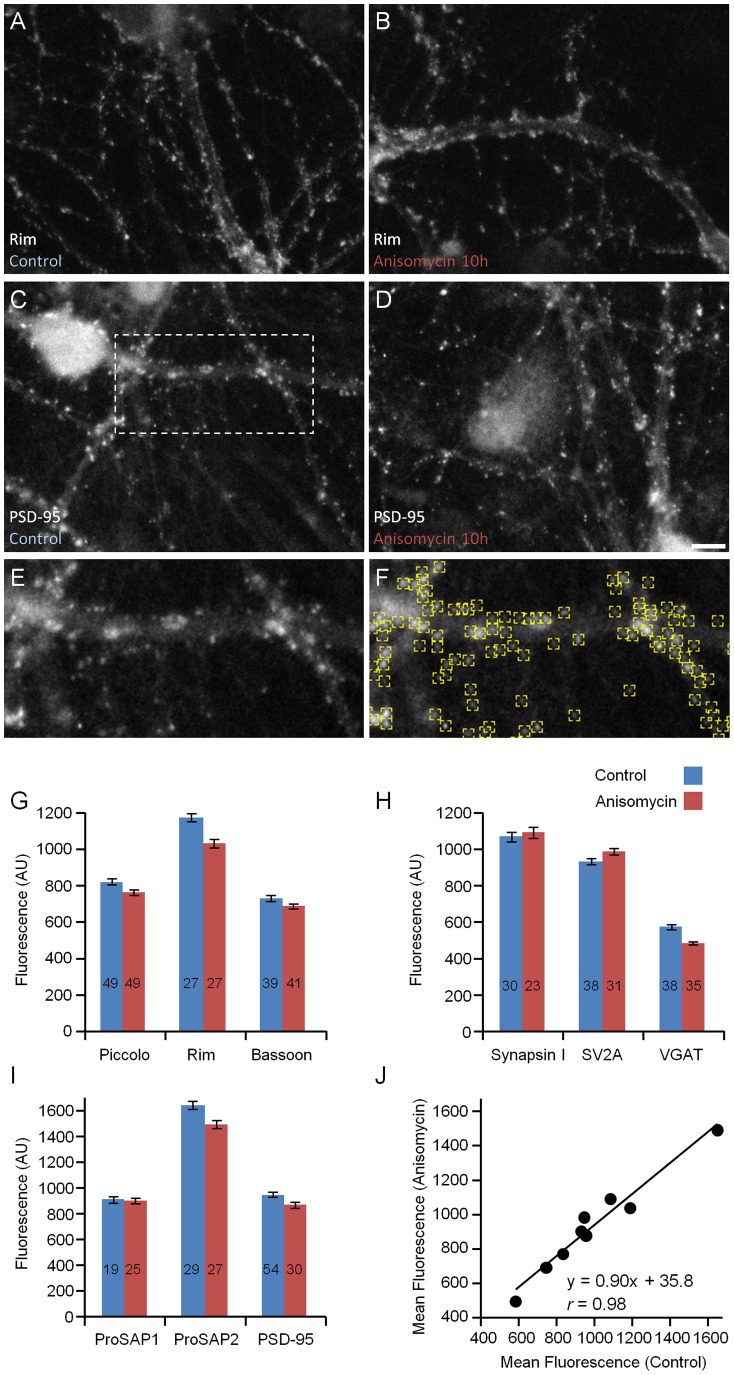
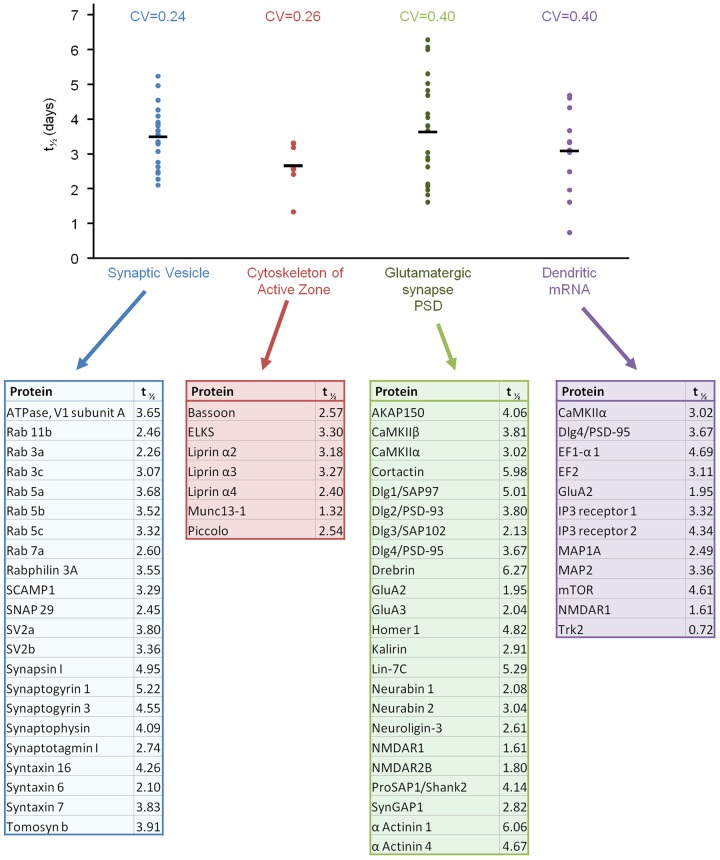
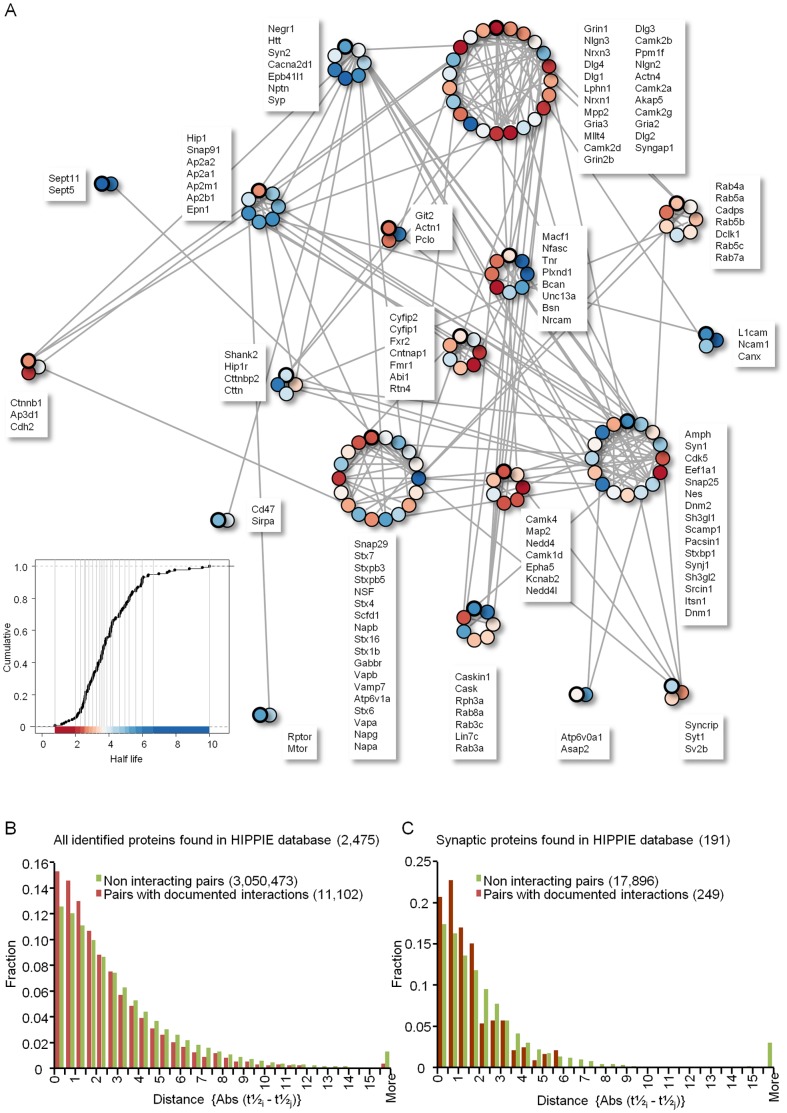
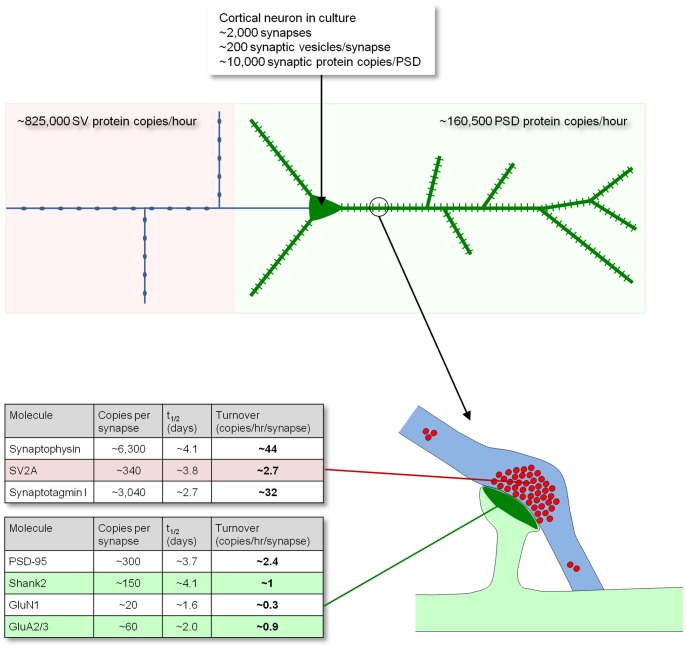
Chemical synapses contain multitudes of proteins, which in common with all proteins, have finite lifetimes and therefore need to be continuously replaced. Given the huge numbers of synaptic connections typical neurons form, the demand to maintain the protein contents of these connections might be expected to place considerable metabolic demands on each neuron. Moreover, synaptic proteostasis might differ according to distance from global protein synthesis sites, the availability of distributed protein synthesis facilities, trafficking rates and synaptic protein dynamics. To date, the turnover kinetics of synaptic proteins have not been studied or analyzed systematically, and thus metabolic demands or the aforementioned relationships remain largely unknown. In the current study we used dynamic Stable Isotope Labeling with Amino acids in Cell culture (SILAC), mass spectrometry (MS), Fluorescent Non-Canonical Amino acid Tagging (FUNCAT), quantitative immunohistochemistry and bioinformatics to systematically measure the metabolic half-lives of hundreds of synaptic proteins, examine how these depend on their pre/postsynaptic affiliation or their association with particular molecular complexes, and assess the metabolic load of synaptic proteostasis. We found that nearly all synaptic proteins identified here exhibited half-lifetimes in the range of 2-5 days. Unexpectedly, metabolic turnover rates were not significantly different for presynaptic and postsynaptic proteins, or for proteins for which mRNAs are consistently found in dendrites. Some functionally or structurally related proteins exhibited very similar turnover rates, indicating that their biogenesis and degradation might be coupled, a possibility further supported by bioinformatics-based analyses. The relatively low turnover rates measured here (∼0.7% of synaptic protein content per hour) are in good agreement with imaging-based studies of synaptic protein trafficking, yet indicate that the metabolic load synaptic protein turnover places on individual neurons is very substantial.


Conflict of interest statement

Competing Interests: The authors have declared that no competing interests exist.

Figures

Figure 1
Figure 1. Measuring metabolic protein turnover by SILAC and MS.
A) Illustration of the experimental process. At t = 0, heavy lysine and arginine were added to the media of cortical neurons in primary culture (14 days in vitro). 0, 1, 3 and 7 days afterward, cells were harvested and separated side by side by SDS-PAGE. One such gel (stained with Coomassie Blue) is shown on right. Two lanes were run for each time-point to increase protein amounts. Gels were then cut into 9 slices as indicated, proteins in each slice were digested, and the resulting peptides from each slice and each time point were submitted separately to MS analysis. B) MS spectrogram showing the relative amounts, at three time points, of light (open circles) and heavy (closed circles) populations of two particular peptides from slice 5. C) Heavy AA incorporation rates for two particular proteins (Munc18-1 and CaMKII-β2). Each data point represents the fractional incorporation values averaged for all peptides belonging to these particular proteins at a given time point. All four data points were used for fitting to exponential curves (solid lines), providing estimates of time constants (τ) and half-lives as indicated. Graph on right hand side shows extrapolation of same exponential curves to longer times.
Figure 2
Figure 2. Distributions of metabolic half-life estimates.
A) Distribution of metabolic half-life estimates for all identified proteins for which fractional incorporation data was obtained for all four time points. Proteins for which fits to single exponentials were not satisfactory (∼2%) were excluded. B) Distribution of metabolic half-life estimates for 191 synaptic proteins (Table 1).
Figure 3
Figure 3. Metabolic half-life estimates for well characterized synaptic proteins.
A–D) Heavy AA incorporation rates for four groups of synaptic proteins: Glutamatergic synapse Dlg family of scaffolding molecules (A); glutamate receptor subunits (B); cytoskeleton of the active zone (CAZ) molecules (C); and synaptic vesicle molecules (D). Each data point (as in Fig. 1C) represents heavy AA fractional incorporation values averaged for all peptides belonging to that particular protein at a given time point. The solid lines represent best fits to single exponential curves. Half-life estimates (in days) based on these fits are provided in the legend (brackets). E) Metabolic half-life estimates for a select group of synaptic proteins. Proteins associated primarily with glutamatergic and GABAergic synapses are shown in green and red respectively. Note that proteins with very similar half-lives were sometimes separated slightly to increase readability.
Figure 4
Figure 4. Degradation rates of newly synthesized proteins measured in dendritic spines.
A 24 h pulse with 4 mM AHA was used to label newly synthesized proteins. Cells were subsequently fixed - immediately or after 24 or 48 h chase periods with high concentrations of methionine. Newly synthesized proteins (proteins containing AHA) were then visualized with a TAMRA-TAG using FUNCAT. A) Examples of proximal dendritic segments after visualization of newly synthesized proteins by FUNCAT, and after immunostaining against MAP2 and Synaptophysin (Sph). Note the strong TAMRA fluorescence in dendrites as well as in Synaptophysin positive synapses, and the reduction in TAMRA fluorescence after 24 and 48 h chase periods. Note also that no TAMRA fluorescence is observed in neurons that were not exposed to the AHA pulse (top row). Color coding: MAP2 - green, TAMRA-tag - magenta/red, Sph - blue. Scale bar: 5 µm. B) Quantification of TAMRA fluorescence intensity in synaptophysin-positive synapses following increasingly longer chase periods. Data is shown as average ± SEM. Data obtained from two independent experiments (two to three coverslips per experiment) and a total number of 40–46 proximal dendrites. The number of spines for which TAMRA-intensity was quantified is indicated inside the bars.
Figure 5
Figure 5. Minor loss of synaptic proteins from synaptic sites following suppression of protein synthesis for 10 hours.
Quantitative immunocytochemistry of neurons exposed to the protein synthesis blocker anisomycin (25 µM) for 10 hours and thereafter labeled against nine different synaptic proteins. Neurons labeled against the CAZ protein Rim after exposure to carrier solution (A) or anisomycin (B). Neurons labeled against the PSD protein PSD-95 after exposure to carrier solution (C) or anisomycin (D). Scale bar, 10 µm. E) Enlarged view of region enclosed in the rectangle in C illustrating a programmatic localization of fluorescent puncta (F). Note that puncta are detected correctly regardless of their brightness. G–I) Changes in synaptic immuofluorescence levels measured following exposure to anisomycin for 10 hours (average ±SEM). Numbers within bars indicate the number of fields of view analyzed for each data set. Each field of view contained ∼297±122 puncta (average ± standard deviation). J) Average immuofluorescence levels following anisomycin treatment plotted against immunofluorescence levels in untreated neurons (same data as in panels G–I).
Figure 6
Figure 6. Comparisons of metabolic half-life estimates for proteins localized to particular synaptic compartments.
Groups of well characterized proteins were curated manually and estimates of their metabolic half-lives were compared. Each dot represents the half-life value of one protein. Horizontal bars represent average values for each group. The coefficient of variation for each group is provided above each group. Proteins contained in each group along with estimates of their metabolic half-lives are listed below the graph. Except for the difference between the Synaptic Vesicle and Cytoskeleton of Active Zone groups (p = 0.01) all other differences between groups were not statistically significant (Kolmogorov-Smirnov test).
Figure 7
Figure 7. Relationships between half-life estimates and protein-protein interaction groups.
A) A molecular interaction network of 191 synaptic related proteins (main text and Table 1) generated on the basis of a manually curated public domain protein-protein interaction database (Human Integrated Protein-Protein Interaction Reference, or HIPPIE; ; see Materials and Methods for further details). Each circle represents one protein, with the estimated metabolic half-life for that protein color coded according to the legend at the bottom left corner. Proteins in each cluster are listed in clockwise fashion, with the top protein in each list referring to the circle in each cluster encompassed with a thick line. B,C) Differences between metabolic turnover rates are smaller on average for pairs of interacting proteins as compared to pairs of non-interacting proteins. Absolute differences between metabolic half-life estimates for all pairs for which interactions are known to exist were compared to all pairs for which interactions are not known to occur (see main text for details), and the distributions of such differences were plotted for both groups. B) All identified proteins, and C) For the list of synaptic and synaptically related proteins. In both cases, differences between groups were highly significant (p ≪10−10, Kolmogorov-Smirnov test).
Figure 8
Figure 8. Metabolic load of synaptic protein synthesis.
Schematic illustration of a neuron (top) and a synapse (bottom) with some estimates of protein synthesis rates required to maintain the synapse population of a prototypical cortical neuron in primary culture (top) or the synaptic contents of some specific molecules (bottom).

References

    1. Baitinger C, Willard M (1987) Axonal transport of synapsin I-like proteins in rabbit retinal ganglion cells. J Neurosci 7: 3723–3735. - PMC - PubMed
    1. Petrucci TC, Macioce P, Paggi P (1991) Axonal transport kinetics and posttranslational modification of synapsin I in mouse retinal ganglion cells. J Neurosci 11: 2938–2946. - PMC - PubMed
    1. Ehlers MD (2003) Activity level controls postsynaptic composition and signaling via the ubiquitin-proteasome system. Nat Neurosci 6: 231–242. - PubMed
    1. Yao I, Takagi H, Ageta H, Kahyo T, Sato S, et al. (2007) SCRAPPER-dependent ubiquitination of active zone protein RIM1 regulates synaptic vesicle release. Cell 130: 943–957. - PMC - PubMed
    1. Hoffman PN, Lasek RJ (1975) The slow component of axonal transport. identification of major structural polypeptides of the axon and their generality among mammalian neurons. J Cell Biol 66: 351–366. - PMC - PubMed

Publication types