. 2013 May 3;8(5):e63495.
doi: 10.1371/journal.pone.0063495. Print 2013.

Downregulation of OPA3 is responsible for transforming growth factor-β-induced mitochondrial elongation and F-actin rearrangement in retinal pigment epithelial ARPE-19 cells

Affiliations

Downregulation of OPA3 is responsible for transforming growth factor-β-induced mitochondrial elongation and F-actin rearrangement in retinal pigment epithelial ARPE-19 cells

Seung-Wook Ryu et al. PLoS One. .

Abstract

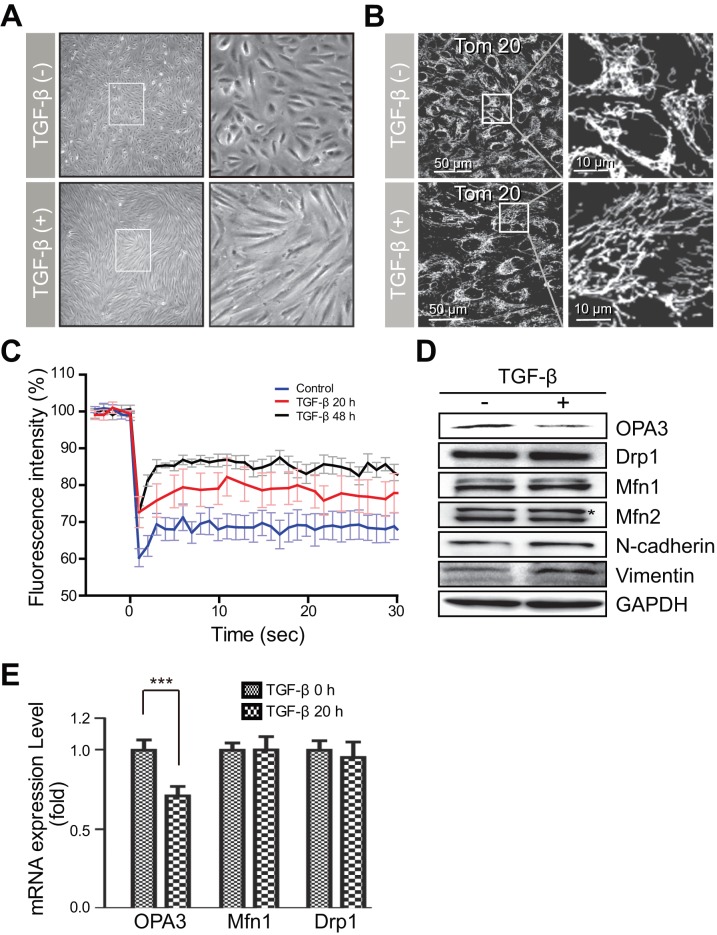
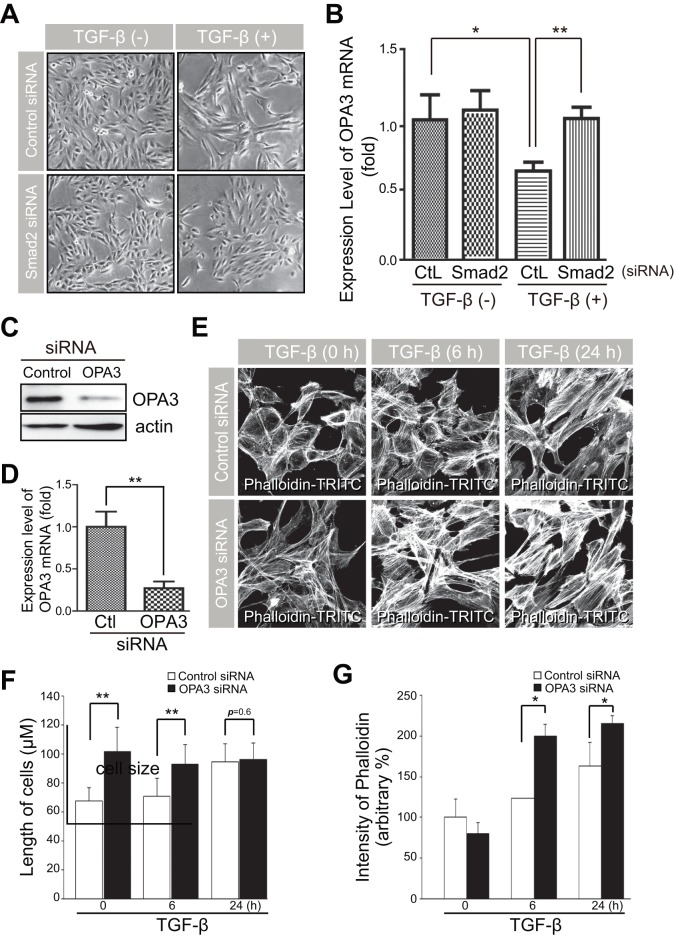
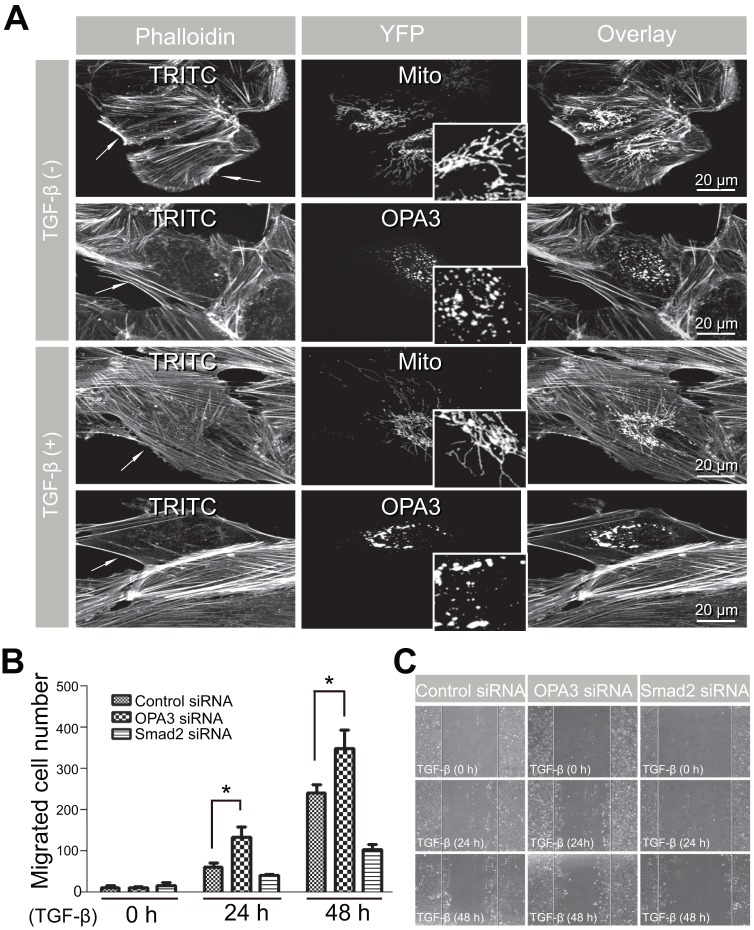
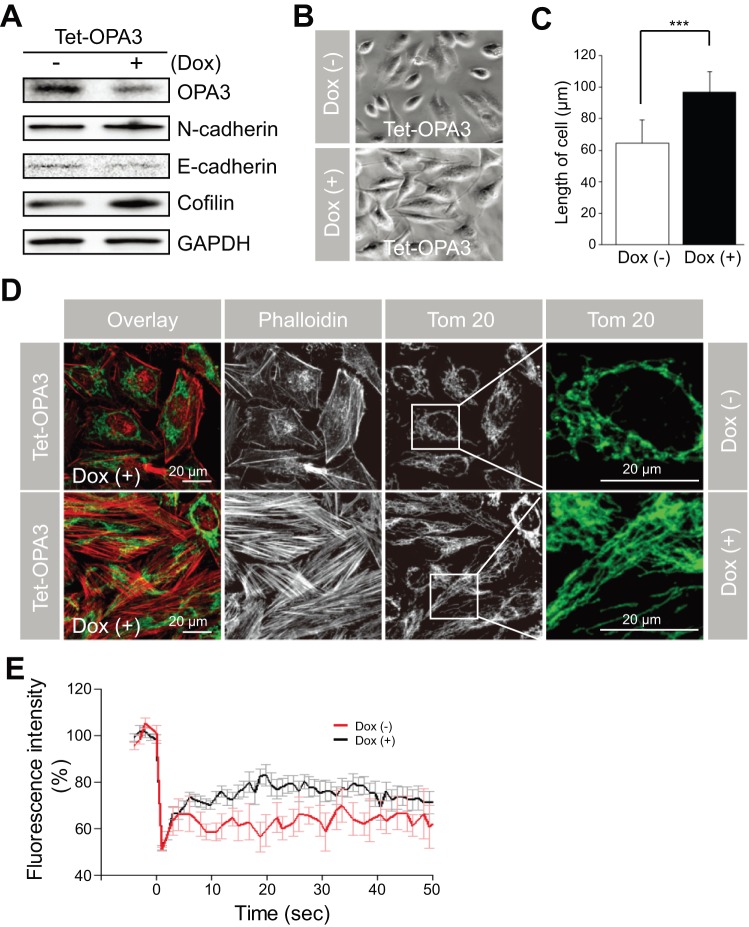
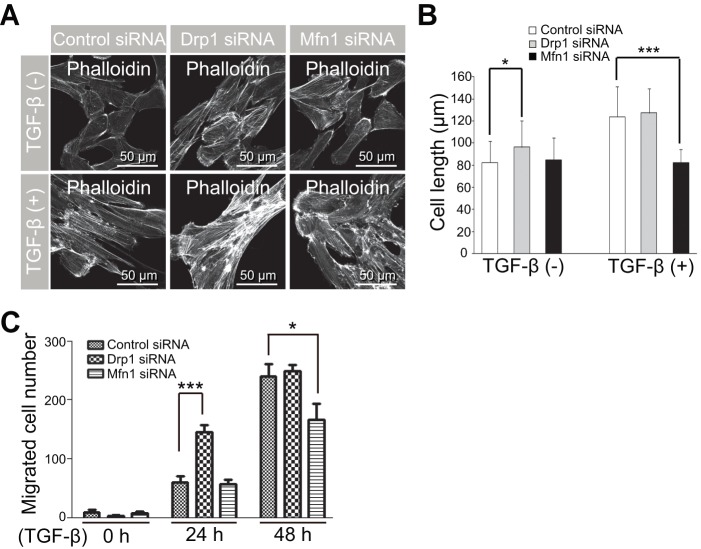
Transforming growth factor-β signaling is known to be a key signaling pathway in the induction of epithelial-mesenchymal transition. However, the mechanism of TGF-β signaling in the modulation of EMT remains unclear. In this study, we found that TGF-β treatment resulted in elongation of mitochondria accompanied by induction of N-cadherin, vimentin, and F-actin in retinal pigment epithelial cells. Moreover, OPA3, which plays a crucial role in mitochondrial dynamics, was downregulated following TGF-β treatment. Suppression of TGF-β signaling using Smad2 siRNA prevented loss of OPA3 induced by TGF-β. Knockdown of OPA3 by siRNA and inducible shRNA significantly increased stress fiber levels, cell length, cell migration and mitochondrial elongation. In contrast, forced expression of OPA3 in ARPE-19 cells inhibited F-actin rearrangement and induced mitochondrial fragmentation. We also showed that Drp1 depletion increased cell length and induced rearrangement of F-actin. Depletion of Mfn1 blocked the increase in cell length during TGF-β-mediated EMT. These results collectively substantiate the involvement of mitochondrial dynamics in TGF-β-induced EMT.


Conflict of interest statement

Competing Interests: The authors have declared that no competing interests exist.

Figures

Figure 1
Figure 1. Treatment with TGF-β induced mitochondrial elongation and suppressed OPA3 expression in ARPE-19 cells.
(A) Changes in cell morphology induced by TGF-β treatment. APRE-19 cells were incubated in the absence or presence of TGF-β (10 ng/mL) for 48 h. Higher magnification images of the highlighted areas are presented in the panels to the right. (B) Changes in mitochondrial morphology induced by TGF-β. After TGF-β treatment, cells were fixed and stained with anti-Tom20 antibody. Higher magnification images of the highlighted areas are presented in the panels to the right. (C) Quantification of mitochondrial fusion activity. Cells were transfected with mito-YFP. After TGF-β treatment, cells were photobleached and then monitored for recovery of mito-YFP fluorescence. Each line represents the mean of more than 30 measurements. (D and E) Reduction of OPA3 expression by TGF-β. Cells were analyzed by Western blotting (D) with the indicated antibodies and Real-time PCR (E) with the indicated quantitative primers. The Mfn2 antibody recognizes Mfn1 and Mfn2. Data are the mean ± SD of three experiments. *** P<0.0005.
Figure 2
Figure 2. Knockdown of OPA3 induced changes in cell morphology and sensitized cells to F-actin rearrangement induced by TGF-β.
(A and B) Effects of Smad2 on changes in cell morphology and OPA3 level by TGF-β treatment. (B) APRE-19 cells were transfected with Smad2 siRNA or control siRNA. Forty-eight hours after transfection, cells were incubated in the absence or presence of TGF-β for 48 h. Cells were analyzed with phase contrast microscopy (A). Real-time PCR evaluated the level of OPA3 mRNA (B). (C–G) Effects of OPA3 depletion on cell morphology and F-actin rearrangement. APRE-19 cells were transfected with OPA3 siRNA or control siRNA. Forty-eight hours after transfection, cells were treated with TGF-β for the indicated periods of time. Cells were analyzed by Western blotting (C) and Real-time PCR (D). Cells were fixed and stained with phalloidin-TRITC (E). TRITC intensity (F) and Cell lengths (G) were analyzed using confocal images. Data are the mean ± SD of three experiments, each with >50 cells per condition. *P<0.05; **P<0.005.
Figure 3
Figure 3. Overexpression of OPA3 prevented the rearrangement of F-actin in response to TGF-β treatment in ARPE-19 cells.
(A) Inhibition of F-actin rearrangement by OPA3 overexpression. APRE-19 cells were transfected with OPA3-YFP and mito-YFP, respectively. Fifteen hours after transfection, cells were incubated in the absence or presence of TGF-β for 48 h. Cells were fixed and stained with phalloidin-TRITC. White arrows indicate YFP-positive ARPE-19 cells. Higher magnification images of mitochondria are presented in the inset panels. (B and C) Effect of OPA3 in TGF-β-induced cell migration. Cells were transfected with the indicated siRNAs. Forty-eight hours after transfection, cells were treated with TGF-β for the indicated periods of time. The migrated cells were counted (B) and photographed (C). Data shown represent the average of three independent experiments. *P<0.05.
Figure 4
Figure 4. Stable knockdown of OPA3 induced the rearrangement of F-actin and mitochondrial elongation in HeLa cells.
(A–D) Effect of OPA3 knockdown on changes in cell morphology. HeLa cells were transfected with an inducible OPA3 shRNA plasmid (Tet-OPA3) and then selected with G418 for 2 weeks. After selection, cells were incubated in the absence or presence of doxycycline (Dox) for 3 days. For Western blotting with the indicated antibodies (A), cells were harvested and then lysed. Cell morphology (B) and cell length (C) was analyzed using phase contrast images. Data are the mean ± SD of three experiments, each with 100 cells per condition. For confocal analysis (D), cells were fixed and stained with anti-Tom20 antibody (green) and phalloidin-TRITC (red). Higher magnification images of the highlighted areas are presented in the panels to the right. For quantification of mitochondrial fusion activity, live cells with mito-YFP were analyzed by photobleaching. Each line represents the mean of >30 measurements. ***P<0.0005.
Figure 5
Figure 5. Functional changes in cells induced by knockdown of proteins involved in mitochondrial dynamics.
(A and B) The mitochondrial fusion by Drp1 knockdown leads to an increase of cell length and F-actin. APRE-19 cells were transfected with Drp1 siRNA, Mfn1 siRNA, or control siRNA. Forty-eight hours after transfection, cells were treated withTGF-β for 48 h. Cells were fixed and stained with phalloidin-TRITC (A). Cell length was analyzed using confocal images (B). Data are the mean ± SD of three experiments, each with 100 cells per condition. (C) The mitochondrial fusion by Drp1 knockdown promotes cell migration induced by TGF-β. Cells were transfected with the indicated siRNAs. Forty-eight hours after transfection, cells were treated with TGF-β for the indicated periods of time. The migrated cells were counted. Data shown represent the average of three independent experiments. *P<0.05; ***P<0.0005.

References

    1. Feng XH, Derynck R (2005) Specificity and versatility in tgf-beta signaling through Smads. Annu Rev Cell Dev Biol 21: 659–693. - PubMed
    1. Massague J, Seoane J, Wotton D (2005) Smad transcription factors. Genes Dev 19: 2783–2810. - PubMed
    1. Groppe J, Hinck CS, Samavarchi-Tehrani P, Zubieta C, Schuermann JP, et al. (2008) Cooperative assembly of TGF-beta superfamily signaling complexes is mediated by two disparate mechanisms and distinct modes of receptor binding. Mol Cell 29: 157–168. - PubMed
    1. Thiery JP (2003) Epithelial-mesenchymal transitions in development and pathologies. Curr Opin Cell Biol 15: 740–746. - PubMed
    1. Heldin CH, Landstrom M, Moustakas A (2009) Mechanism of TGF-beta signaling to growth arrest, apoptosis, and epithelial-mesenchymal transition. Curr Opin Cell Biol 21: 166–176. - PubMed

Publication types

MeSH terms