. 2013 Jul 1;126(Pt 13):2955-64.
doi: 10.1242/jcs.128744. Epub 2013 May 9.

Biased inheritance of mitochondria during asymmetric cell division in the mouse oocyte

Affiliations

Biased inheritance of mitochondria during asymmetric cell division in the mouse oocyte

Caroline M Dalton et al. J Cell Sci. .

Abstract

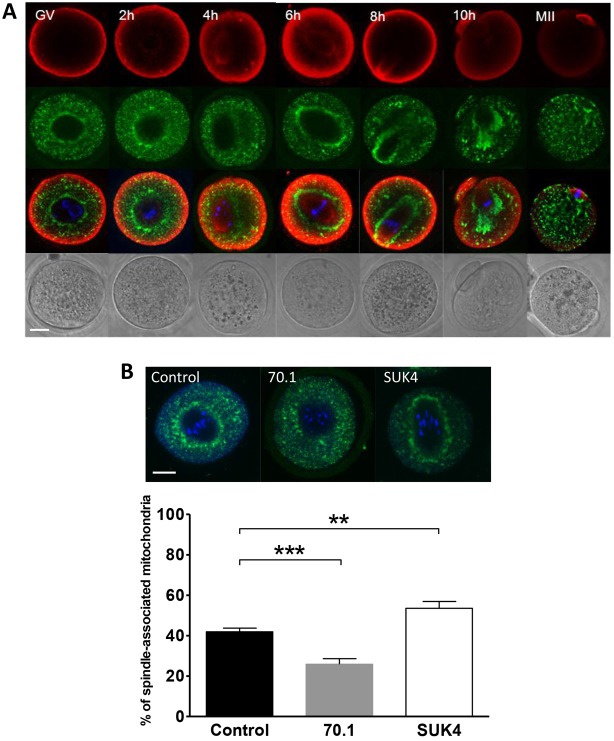
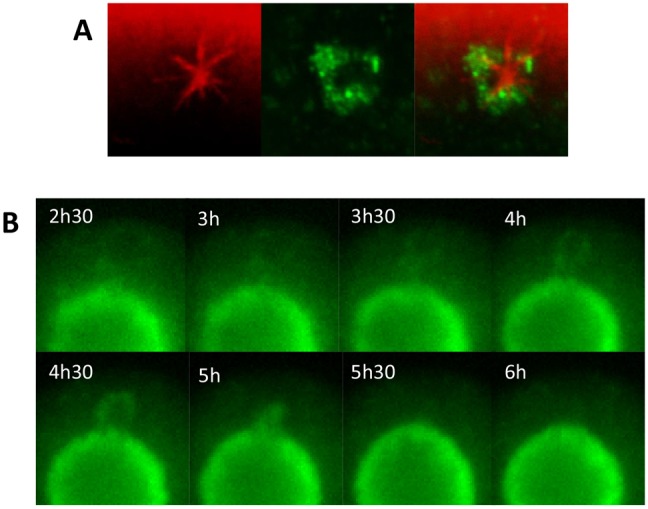
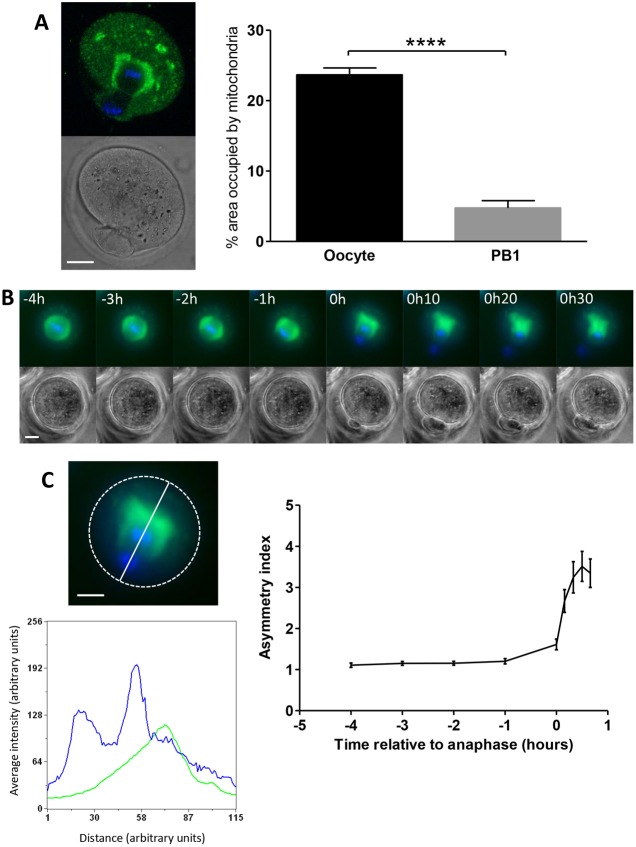
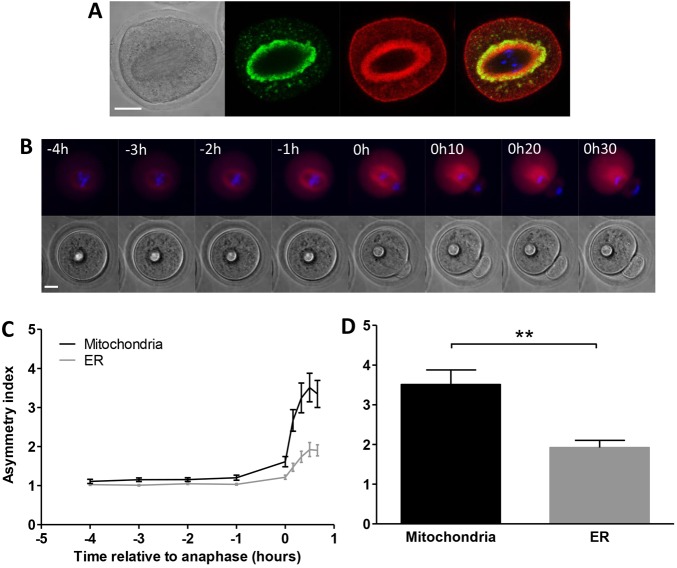
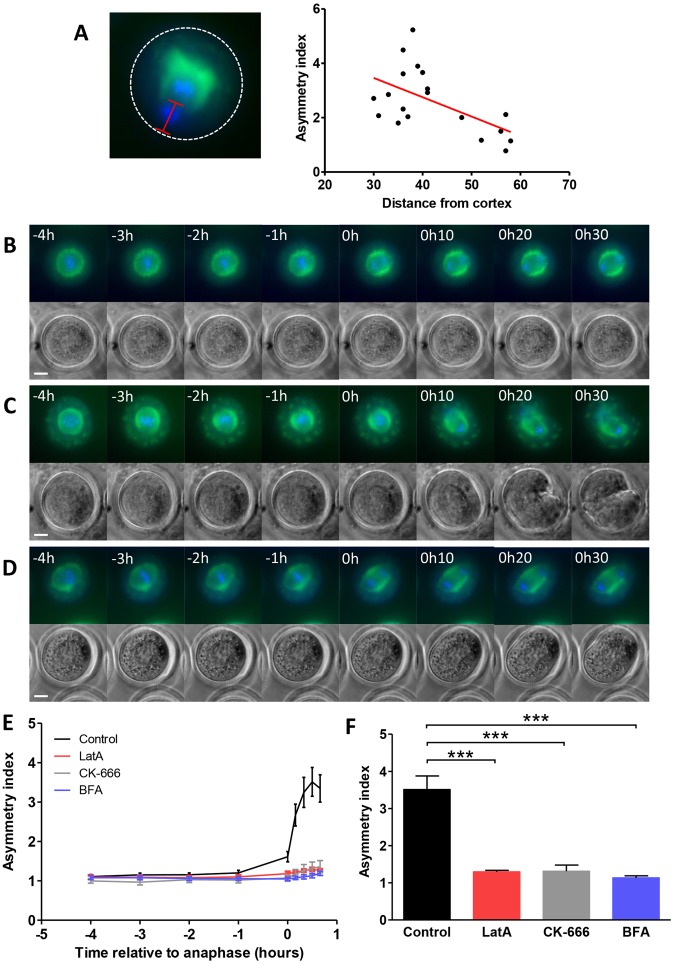
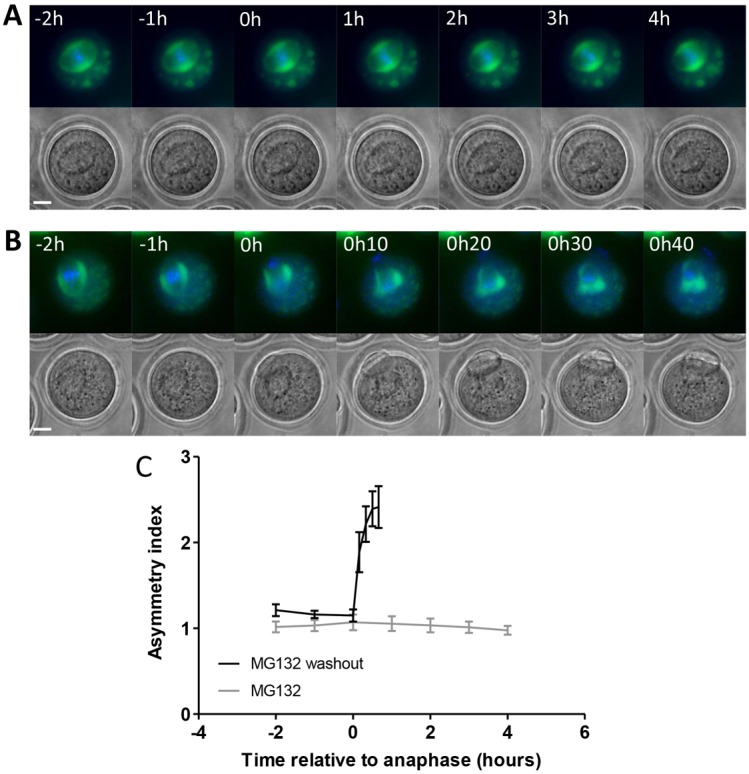
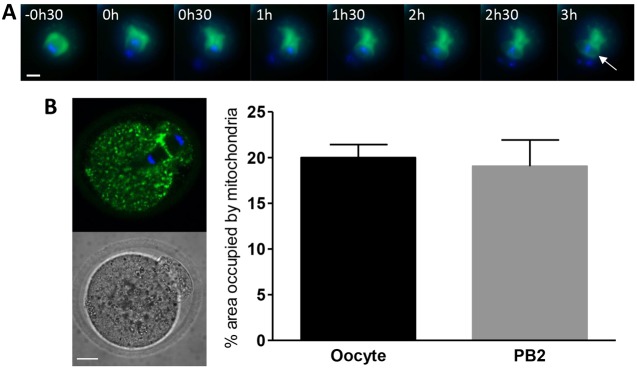
A fundamental rule of cell division is that daughter cells inherit half the DNA complement and an appropriate proportion of cellular organelles. The highly asymmetric cell divisions of female meiosis present a different challenge because one of the daughters, the polar body, is destined to degenerate, putting at risk essential maternally inherited organelles such as mitochondria. We have therefore investigated mitochondrial inheritance during the meiotic divisions of the mouse oocyte. We find that mitochondria are aggregated around the spindle by a dynein-mediated mechanism during meiosis I, and migrate together with the spindle towards the oocyte cortex. However, at cell division they are not equally segregated and move instead towards the oocyte-directed spindle pole and are excluded from the polar body. We show that this asymmetrical inheritance in favour of the oocyte is not caused by bias in the spindle itself but is dependent on an intact actin cytoskeleton, spindle-cortex proximity, and cell cycle progression. Thus, oocyte-biased inheritance of mitochondria is a variation on rules that normally govern organelle segregation at cell division, and ensures that essential maternally inherited mitochondria are retained to provide ATP for early mammalian development.

Keywords: Asymmetry; Mitochondria; Oocyte.


Figures

Fig. 1.
Fig. 1.
Reorganisation of mitochondria during oocyte maturation. (A) Oocytes were fixed at 2 hour intervals from GV stage to MII arrest (n≥7 oocytes at each stage), stained for tubulin (red), mitochondria (green) and DNA (blue) and imaged by confocal microscopy. Mitochondria accumulate around the spindle and follow the path of its migration to the cortex during MI but are distributed throughout the oocyte at MII. (B) Oocytes arrested at GV stage were microinjected with 70.1 to disrupt dynein function (n = 22), SUK4 to inhibit kinesin (KIF5) function (n = 22), or a vehicle control (n = 33). Microinjected oocytes were released from meiotic arrest, fixed at 6 hours, stained for mitochondria (green) and DNA (blue) and imaged by confocal microscopy. The percentage of spindle-associated mitochondria was calculated and was found to be reduced by inhibition of dynein activity (***P<0.001) and enhanced by inhibition of kinesin activity (**P<0.01). Scale bars: 20 µm.
Fig. 2.
Fig. 2.
Mitochondria associate with cytoplasmic MTOCs. (A) Oocytes were fixed during spindle formation and stained for tubulin (red) and mitochondria (green). Mitochondria were found associated with cytoplasmic MTOCs. (B) Oocytes microinjected with mito-GFP to visualise mitochondria were imaged by live-cell time-lapse microscopy. Cytoplasmic clusters of mitochondria, presumed to be encircling MTOCs, were observed to join the spindle-associated mitochondrial ring. Times shown are hours after release.
Fig. 3.
Fig. 3.
Mitochondria are retained in the oocyte during polar body extrusion. (A) Oocytes were fixed at the time of first polar body extrusion, stained for mitochondria (green) and DNA (blue) and imaged by confocal microscopy. The percentage area occupied by mitochondria in both the oocyte and polar body (PB) was calculated and a significant difference was found (n = 15, ****P<0.0001). (B) Mitochondria (green) and DNA (blue) were imaged using live-cell time-lapse microscopy during polar body extrusion. Mitochondria distribute asymmetrically during polar body extrusion, with the reorganisation commencing around the time of anaphase (time = 0). (C) Mitochondrial asymmetry was quantified by calculating the average mitochondrial fluorescence either side of the spindle mid-zone from a linescan through the plane of the dividing chromosomes (solid line on upper left panel). The dotted line indicates the oocyte cortex. The lower panel shows the graph derived from the linescan. Asymmetry begins to develop in the hour preceding anaphase and increases rapidly thereafter (n = 19). Scale bars: 20 µm.
Fig. 4.
Fig. 4.
Mitochondria and ER are similarly distributed at the spindle and during polar body extrusion. (A) Oocytes were microinjected with mito-GFP to visualise mitochondria (green) and dsRed2ER to visualize ER (red), and fixed 6 hours after release from meiotic arrest. Both ER and mitochondria were localised around the first meiotic spindle with the ER closest to the spindle. DNA is shown in blue. (B) Oocytes were microinjected with DiI to visualize the ER (red) and stained with Hoechst to visualize DNA (blue) and imaged by live-cell time-lapse microscopy. Similarly to mitochondria, the ER distributes asymmetrically during polar body extrusion. Time = 0 indicates anaphase. (C) Analysis of the extent of ER asymmetry shows that reorganisation of the ER commences in the hour preceding anaphase and increases progressively during polar body extrusion (n = 14), mirroring the temporal dynamics of mitochondrial asymmetry but at a reduced level. (D) Asymmetry of ER distribution was compared to that of mitochondria at 30 minutes post-anaphase and found to be significantly lower (1.92±0.18 versus 3.51±0.37; P<0.01). Scale bars: 20 µm.
Fig. 5.
Fig. 5.
Asymmetrical mitochondrial inheritance requires spindle–cortex proximity. (A) The mid-zone to cortex distance at a defined time point (10 minutes post-anaphase) was measured (red line in left panel; dotted line indicates the oocyte cortex) and plotted against the asymmetry score. The red line on the graph is a line of best fit, r2 = 0.318. (B–D) Live-cell time-lapse imaging of oocytes that had been microinjected with mito-GFP to visualise mitochondria (green) and stained with Hoechst to visualise DNA (blue) showed that mitochondrial asymmetry does not develop in the presence of (B) 6 µM LatA, (C) 100 µM CK-666 or (D) 5 µM BFA to prevent spindle migration. Time = 0 indicates anaphase. (E) Mitochondrial asymmetry was quantified and no asymmetry was found when spindle migration was prevented by LatA, CK-666 or BFA. (F) The extent of mitochondrial asymmetry at 30 minutes post-anaphase was compared and control oocytes were found to contain mitochondria that were significantly more asymmetrically arranged than those in LatA-treated oocytes (n = 13, P<0.001), CK-666-treated oocytes (n = 6, P<0.001) and BFA-treated oocytes (n = 22, P<0.001). Scale bars: 20 µm.
Fig. 6.
Fig. 6.
Asymmetrical mitochondrial inheritance requires cell cycle progression. (A) Live-cell time-lapse imaging of oocytes that had been microinjected with mito-GFP to visualise mitochondria (green) and stained with Hoechst to visualise DNA (blue) showed that mitochondrial asymmetry does not develop when the cell cycle is arrested at metaphase using 50 µM MG132 (n = 12). (B) MG132 was subsequently washed out, allowing the cell cycle to proceed and a polar body to be extruded, and mitochondrial asymmetry developed. (C) Mitochondrial asymmetry was quantified and no asymmetry was found in the presence of MG132 even over an extended time period. Time = 0 indicates anaphase for MG132 washout experiments. Owing to the absence of anaphase in MG132-treated oocytes, time = 0 for these oocytes was defined as 11 hour 30 minutes after release from meiotic arrest, similar to the average time of anaphase in control oocytes (11 hours 17 minutes ± 10 minutes, n = 48) and in MG132 washout oocytes (11 hour 43 minutes ± 11 minutes, n = 11). Asymmetry developed during polar body extrusion with similar dynamics to that in control oocytes when MG132 was washed out. Scale bars: 20 µm.
Fig. 7.
Fig. 7.
Mitochondrial dynamics during meiosis II. (A) Mitochondria (green) and DNA (blue) were imaged using live-cell time-lapse microscopy during extrusion of the first polar body and formation of the second meiotic spindle. Time is measured from the start of anaphase I. Mitochondria are seen to accumulate around the developing second meiotic spindle (white arrow). (B) Oocytes that had been parthenogenetically activated were fixed during second polar body extrusion, stained for mitochondria (green) and DNA (blue), and imaged by confocal microscopy. The percentage area occupied by mitochondria in both the oocyte and polar body (PB) was calculated and no consistent difference between the oocyte and polar body (PB) was found (n = 14). Scale bars: 20 µm.

Similar articles

Cited by

References

    1. Addinall S. G., Mayr P. S., Doyle S., Sheehan J. K., Woodman P. G., Allan V. J. (2001). Phosphorylation by cdc2-CyclinB1 kinase releases cytoplasmic dynein from membranes. J. Biol. Chem. 276, 15939–15944 10.1074/jbc.M011628200 - DOI - PubMed
    1. Azoury J., Lee K. W., Georget V., Rassinier P., Leader B., Verlhac M. H. (2008). Spindle positioning in mouse oocytes relies on a dynamic meshwork of actin filaments. Curr. Biol. 18, 1514–1519 10.1016/j.cub.2008.08.044 - DOI - PubMed
    1. Biggers J. D., Whittingham D. G., Donahue R. P. (1967). The pattern of energy metabolism in the mouse oöcyte and zygote. Proc. Natl. Acad. Sci. USA 58, 560–567 10.1073/pnas.58.2.560 - DOI - PMC - PubMed
    1. Brunet S., Verlhac M. H. (2011). Positioning to get out of meiosis: the asymmetry of division. Hum. Reprod. Update 17, 68–75 10.1093/humupd/dmq044 - DOI - PubMed
    1. Burkhardt J. K., Echeverri C. J., Nilsson T., Vallee R. B. (1997). Overexpression of the dynamitin (p50) subunit of the dynactin complex disrupts dynein-dependent maintenance of membrane organelle distribution. J. Cell Biol. 139, 469–484 10.1083/jcb.139.2.469 - DOI - PMC - PubMed

Publication types

LinkOut - more resources