Clinical Trial
. 2013 May 25;381(9880):1835-43.
doi: 10.1016/S0140-6736(12)62166-7. Epub 2013 May 7.

Safety and tolerability of an intratumorally injected DNAzyme, Dz13, in patients with nodular basal-cell carcinoma: a phase 1 first-in-human trial (DISCOVER)

Affiliations
Clinical Trial

Safety and tolerability of an intratumorally injected DNAzyme, Dz13, in patients with nodular basal-cell carcinoma: a phase 1 first-in-human trial (DISCOVER)

Eun-Ae Cho et al. Lancet. .

Abstract

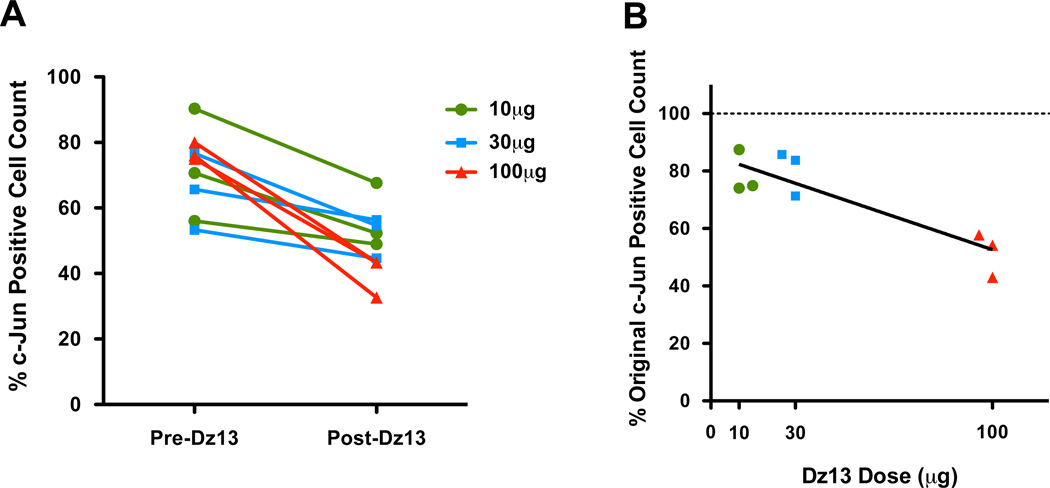
Background: The nuclear transcription factor c-Jun is preferentially expressed in basal-cell carcinoma. Dz13 is a deoxyribozyme that targets JUN messenger RNA and has inhibited the growth of a range of tumours in mice. We did a phase 1 study to assess safety and tolerability in human beings.

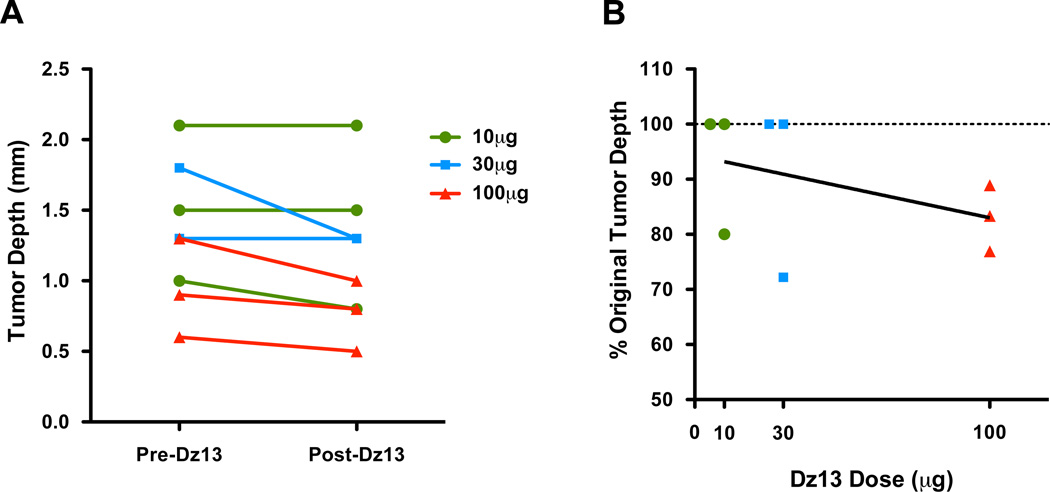
Methods: Adults with nodular basal-cell carcinoma were recruited from Royal Prince Alfred Hospital, Sydney, Australia, between September, 2010, and October, 2011. Patients were assigned to receive one intratumoral injected dose of 10, 30, or 100 μg Dz13, in a 50 μL volume of lipid carrier, and were assessed for adverse effects in the first 24 h then at 7, 14, and 28 days after injection. Treated tumours were surgically excised 14 days after injection and compared with the baseline biopsy samples for expression of c-Jun and tumorigenesis markers.

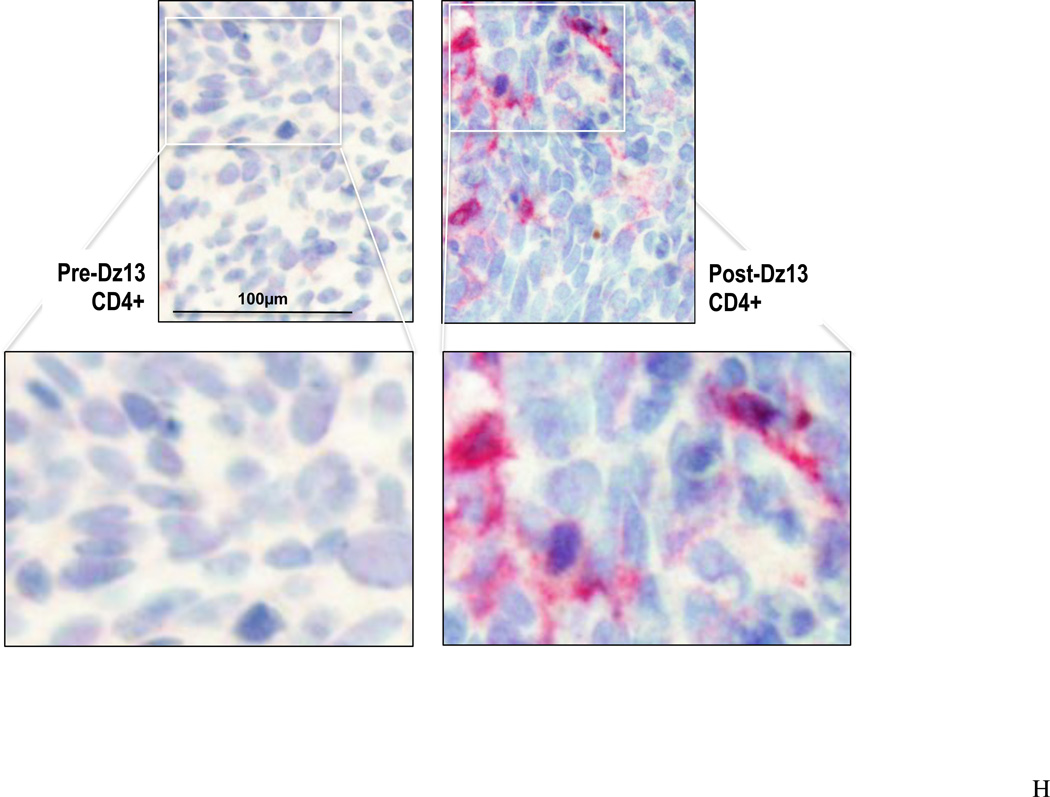
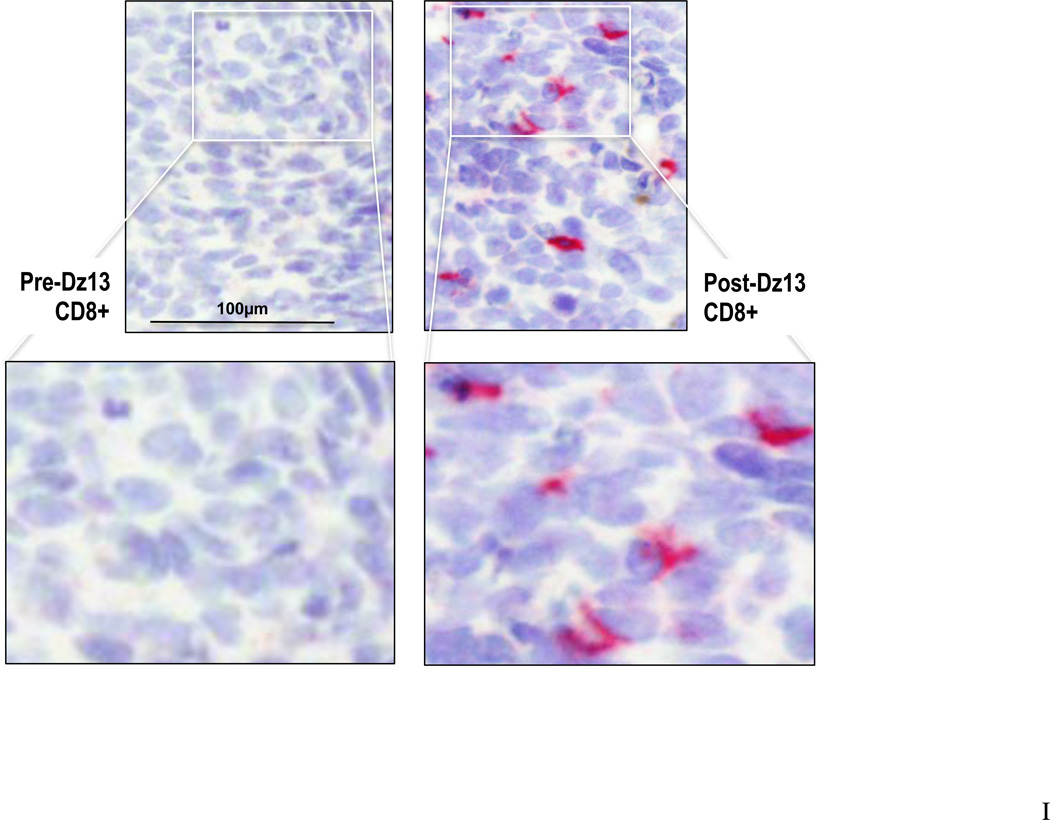
Findings: Nine patients were recruited, of whom three received each dose of Dz13. All patients completed the study with no drug-related serious adverse events. No systemic Dz13 exposure was detected. c-Jun expression was reduced in the excised tumours of all nine (100%) patients, compared with baseline, and histological tumour depth had decreased in five (56%) of nine. Proportions of cells positive for caspases 3, 8, and 9 and P53 were increased, but those of cells positive for Bcl-2 and MMP-9 were decreased. Infiltration by inflammatory and immune cells was stimulated.

Interpretation: Dz13 was safe and well tolerated after single intratumoral injections at all doses.

Funding: Cancer Institute NSW, Cancer Council Australia, and National Health and Medical Research Council.


Figures

Figure 1
Figure 1. Dz13 treatment decreases expression of its target protein c-Jun and induces T lymphocyte infiltration into BCC
(A) Each colored line represents an individual patient linking pre- and post-dose c-Jun immunostaining. Green circles represent 10µg Dz13, blue squares 30µg, and red triangles 100µg. (B, D, E, F) Each point represents post-dose positive cell count for c-Jun (B), CD3 (D), CD4 (E) or CD8 (F) of an individual patient expressed as the percentage of the respective pre-dose cell count, represented as a dotted line at 100%. Straight line generated by linear regression. There were 2 points plotted for the 100µg group for CD8 due to insufficient specimen for patient 7. (C, G, H, I) Representative photomicrographs at two separate magnifications of pre-dose and post-dose (100µg) immunohistochemical staining for c-Jun (C), CD3 (G), CD4 (H) and CD8 (I) (red/pink positive staining with blue hematoxylin counterstain).
Figure 2
Figure 2. Dz13 decreases histological tumor depth
(A) Each colored line links an individual patient’s pre- and post-dose tumor depth. Green circles represent 10µg Dz13, blue squares 30µg, and red triangles 100µg. (B) Each point represents post-dose tumor depth of an individual patient expressed as the percentage of the respective pre-dose tumor depth, represented as a dotted line at 100%. Straight line generated by linear regression demonstrates apparent dose-dependency.

Comment in

References

    1. Cai H, Santiago FS, Prado-Lourenco L, Patrikakis M, Wang B, Chong BH, et al. DNAzymes targeting c-jun suppress skin cancer growth. Science Translational Medicine. 2012;4:139ra82. - PubMed
    1. Miller SJ. Biology of basal cell carcinoma (Part I) J Am Acad Dermatol. 1991;24(1):1–13. - PubMed
    1. Miller SJ. Biology of basal cell carcinoma (Part II) J Am Acad Dermatol. 1991;24(2 Pt 1):161–175. - PubMed
    1. Lacour JP. Carcinogenesis of basal cell carcinomas: genetics and molecular mechanisms. Br J Dermatol. 2002;14661(Suppl 61):17–19. - PubMed
    1. Cancer in Australia 2001. Canberra: Australian Institute of Health and Welfare & Australasian Association of Cancer Registries; 2004.

Publication types

MeSH terms