. 2013 Jul;27(7):1113-27.
doi: 10.1210/me.2012-1353. Epub 2013 May 9.

Transcriptional repression of AIB1 by FoxG1 leads to apoptosis in breast cancer cells

Affiliations

Transcriptional repression of AIB1 by FoxG1 leads to apoptosis in breast cancer cells

Jordan V Li et al. Mol Endocrinol. 2013 Jul.

Abstract

The oncogene nuclear receptor coactivator amplified in breast cancer 1 (AIB1) is a transcriptional coactivator that is overexpressed in various types of human cancers. However, the molecular mechanisms controlling AIB1 expression in the majority of cancers remain unclear. In this study, we identified a novel interacting protein of AIB1, forkhead-box protein G1 (FoxG1), which is an evolutionarily conserved forkhead-box transcriptional corepressor. We show that FoxG1 expression is low in breast cancer cell lines and that low levels of FoxG1 are correlated with a worse prognosis in breast cancer. We also demonstrate that transient overexpression of FoxG1 can suppress endogenous levels of AIB1 mRNA and protein in MCF-7 breast cancer cells. Exogenously expressed FoxG1 in MCF-7 cells also leads to apoptosis that can be rescued in part by AIB1 overexpression. Using chromatin immunoprecipitation, we determined that FoxG1 is recruited to a region of the AIB1 gene promoter previously characterized to be responsible for AIB1-induced, positive autoregulation of transcription through the recruitment of an activating, multiprotein complex, involving AIB1, E2F transcription factor 1, and specificity protein 1. Increased FoxG1 expression significantly reduces the recruitment of AIB1, E2F transcription factor 1 and E1A-binding protein p300 to this region of the endogenous AIB1 gene promoter. Our data imply that FoxG1 can function as a pro-apoptotic factor in part through suppression of AIB1 coactivator transcription complex formation, thereby reducing the expression of the AIB1 oncogene.


Figures
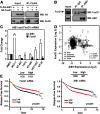
Figure 1.
Figure 1.
AIB1 and FoxG1 Interact in Mammalian Cells. A, AIB1 interacts with FoxG1 in HEK293T cells. FLAG-AIB1 was cotransfected with HA-FoxG1 constructs. Whole-cell lysates were collected 48 hours after transient transfection, and used for IP and WB analysis with anti-FLAG and anti-HA antibodies as indicated. B, Interaction of endogenous AIB1 with FoxG1 in MCF-7 breast cancer cells. Nuclear lysates were prepared from MCF-7 cells and immunoprecipitated with an AIB1 antibody or control IgG. FoxG1 protein associated with AIB1 in the IP was detected by WB as indicated. C, AIB1 and FoxG1 mRNA expression levels in breast cancer cell lines. Total RNA was harvested from breast cancer cell lines to determine the relative gene expression for AIB1 and FoxG1. D, FoxG1 and AIB1 mRNA expression are inversely correlated. Data from Zhao et al (28), Turashvili et al (29), Richardson et al (30), and TCGA (The Cancer Genome Atlas-Invasive Breast Carcinoma Gene Expression Data) were analyzed using Oncomine (www.oncomine.org). Higher expression of FoxG1 coincides with lower expression of AIB1 and vice versa. E, Analysis of the levels of AIB1 and FoxG1 mRNA on a gene expression microarray of breast cancer samples from patients with known RFS times provided by KM Plotter (http://www.kmplot.com) (KM analysis parameters are described in Material and Methods) (31)..
Figure 2.
Figure 2.
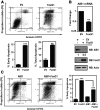
FoxG1 Induces Apoptosis and Down-Regulates AIB1 Expression in MCF-7 Cells. A, MCF-7 cells were transfected with either an EV control or FoxG1 constructs. Cells were subjected 24 hours after transfection to Annexin V apoptosis analysis. The percentages of cells in early and late apoptosis are represented by bottom right and top right quadrants of the FACS analysis, respectively. Percent total apoptosis was the total percentage of cells in both early and late apoptosis. The mean ± SEM values were obtained from duplicate samples from each transfection condition. ***, P < .001; **, P < .01 relative to EV. Statistical analysis was done by Student's t test. B, Analysis of endogenous AIB1 expression in MCF-7 cells overexpressing FoxG1. Cells were transfected with EV or FoxG1 as in panel A. Total RNA and whole-cell lysates were collected to determine the relative levels of mRNA and protein for AIB1. Cells transfected with EV were arbitrarily set at 1, and cells expressing FoxG1 were analyzed in reference to it. Student's t test. **, P < .01 relative to EV. Relative protein levels were determined by WB with antibodies as indicated. C, AIB1 rescues MCF-7 cells from FoxG1-induced apoptosis. MCF-7 cells were transfected separately with expression vectors for either EV control, FoxG1, AIB1, or AIB1 and FoxG1 together. Cells were assessed for apoptosis as in panel A. ***, P < .001, EV vs FoxG1; or FoxG1 vs AIB1+FoxG1. One-way ANOVA with Bonferroni posttest. FITC, fluorescein isothiocyanate.
Figure 3.
Figure 3.
FoxG1 Represses AIB1 Gene Promoter Activity. A, Model of the AIB1 gene promoter. Model showing an activating transcriptional complex consisting of AIB1, E2F1, and Sp1, anchored to DNA through a Sp1-binding site, the GC box, which is downstream of exon 1 (black box) in the −250 to +350 bp region of the AIB1 promoter. The red arrows represent the locations and orientations of the AIB1 promoter-specific primers. B (panel i), AIB1 WT and mutant Sp1 site-deleted promoter luciferase reporters. The red arrows are primers that specifically detect these reporters. B (panel ii), FoxG1 represses the activity of the AIB1 promoter reporter. MCF-7 cells were transfected with WT AIB1 (−250/+350) reporter alone, or together with E2F1 in the presence or absence of FoxG1. A representative graph is shown from 2 independent experiments, and data were analyzed by 1-way ANOVA with Bonferroni posttest. **, P < .01 when E2F1 is compared with promoter alone; or FoxG1 and E2F1 together relative to E2F1. B (panel iii), Protein association to the Sp1-binding site in the transfected AIB1 gene promoter. HEK293T cells were transfected with either the WT AIB1 reporter or the mutant reporter where the Sp1-binding sequence is deleted. Cells were processed for ChIP 6 hours after transfection. Recruitment of FoxG1, AIB1, E2F1, and Sp1 to both the WT and mutant reporters was assessed with a pair of primers that specifically detect the transfected reporter DNA (panel i, red arrows). The IgG-ChIP was arbitrarily set as 1, and all the samples were analyzed and plotted in reference to IgG. Data represent 2 independent experiments and were analyzed by Student's t test. ***, P < .001; **, P < .01; *, P < .05 compared with IgG control.
Figure 4.
Figure 4.
FoxG1 Forms a Complex with AIB1 and E2F1 on the AIB1 Gene Promoter. A, FoxG1 is recruited to the endogenous AIB1 promoter. ChIP assays were performed in MCF-7 cells, where endogenous FoxG1-DNA complex was immunoprecipitated with anti-FoxG1 antibody or isotype IgG. Protein-enriched DNA was analyzed by RT-PCR using AIB1 promoter-specific primers (Figure 3A, red arrows) or primers that will either amplify a region in exon 4 of the AIB1 gene or the albumin promoter. ChIP results were analyzed by Student's t test, where ***, P < .001 relative to IgG. B–D, Two-step reChIP assays were performed in MCF-7 cells, and all DNA samples were subjected to 2 rounds of ChIPs. Sonicated chromatin was immunoprecipitated first with AIB1 or E2F1- (panel B), FoxG1 or AIB1- (panel C), or FoxG1 or E2F1 antibodies (panel D), followed by reChIP with antibodies specific to E2F1 or AIB1 (panel B), AIB1 or FoxG1 (panel C), or E2F1 or FoxG1 (panel D). As a negative control, isotype IgG was used for the first-round ChIPs followed by reChIP of the respective second-round antibodies. The endogenous AIB1 promoter bound to each immunocomplex as indicated in the figure was analyzed by qPCR using the AIB1 promoter-specific primers. Student's t test. ***, P < .001;4 **, P < .01; *, P < .05 when compared with each respective IgG-reChIP control. E, FoxG1 recruitment to the endogenous AIB1 promoter is dependent on AIB1. Endogenous AIB1 was depleted by infection of MCF-7 cells with lentiviral vectors expressing shRNAs targeting a distinct sequence in AIB1 (shRNA-AIB1) or control scrambled shRNA (shRNA-Control). Ninety-six hours after lentiviral infection, cells were subjected to ChIP analyses in which protein-DNA complexes were immunoprecipitated with antibodies against either AIB1 or FoxG1, or an isotype IgG. Student's t test. **, P < .01; shRNA-Control vs shRNA-AIB1. The amount of AIB1 protein knocked down 96 hours after infection was assessed by WB with antibodies as indicated.
Figure 5.
Figure 5.
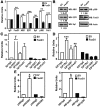
FoxG1 Destabilizes the Sp1-Associated Transcription Complex on the AIB1 Gene Promoter. A, FoxG1 overexpression leads to decreased recruitment of the members of the transcriptional complex to the endogenous AIB1 promoter. ChIP assays were performed in MCF-7 cells transfected with EV or FoxG1 vectors, by enriching protein-bound endogenous AIB1 promoter with antibodies as indicated. Student's t test, in which ***, P < .001; **, P < .01 were FoxG1-expressing cells (black bars) relative to EV (white bars). B, Relative protein levels after FoxG1 transfection in MCF-7 cells are shown by WB and probed with antibodies as indicated. C and D, Overexpressing FoxG1 compromises the integrity of the transcription complex. The immunocomplexes associated with the AIB1 promoter were assessed by reChIP experiments, where chromatin was immunoprecipitated sequentially first with an anti-Sp1 antibody, followed by reChIP with antibodies specific to either E2F1, AIB1, or FoxG1; or first with an anti-E2F1 antibody, followed by reChIP with antibodies specific to either Sp1, AIB1, or FoxG1. The Sp1-ChIP and E2F1-ChIP were also followed by a reChIP of IgG as a negative control. ***, P < .001; **, P < .01; *, P < .05 relative to E2F1/IgG. Student's t test. E, Overexpressing FoxG1 causes reduction in p300-AIB1 co-occupancy at the AIB1 promoter. MCF-7 cells were transfected with EV or FoxG1 as in panel A and harvested for reChIP experiments by performing reciprocal and sequential ChIPs using antibodies specific to p300, followed by AIB1, or to AIB1, followed by p300. The AIB1 promoter-specific primers were used to assess the relative occupancy of the AIB1–p300 complex at the endogenous AIB1 promoter. *, P < .05 relative to p300/IgG or AIB1/IgG. Student's t test.
Figure 6.
Figure 6.
FoxG1 Disrupts AIB1's Coactivator Function. A and B, FoxG1's effect on steroid-independent promoters. HEK293T cells were transfected with AIB1 expression constructs as indicated with either a multimerized AP-1 reporter (panel A) or a multimerized NF-κB reporter (panel B), in the presence or absence of FoxG1. c-fos and c-jun expression vectors were also cotransfected with the AP-1 reporter. Cells were lysed 24 hours after transfection to measure luciferase activity. C, FoxG1's effect on estrogen-stimulated transcription. AIB1 was cotransfected with ERα and ERE constructs into hormone-stripped HEK293T cells, with or without cotransfection of FoxG1. Cells were treated with ethanol (−) or 10 nM estradiol (E2) (+) for 24 hours and analyzed for reporter activity. Results are expressed as changes in the level of activation compared with EV-transfected cells. D, FoxG1 has no effect on E2F1-regulated gene expression. MCF-7 cells were transfected with EV or FoxG1, and total RNA was harvested from cells to determine the relative gene expression for CDK2, CDC25A, MCM7, E2F1, and CDC6. The Ct values were normalized to actin expression as control.
Figure 7.
Figure 7.
A Proposed Model for the role of FoxG1 in Regulating AIB1 Gene Expression. FoxG1 binds to, and reduces, AIB1 binding to the components of the activating transcription complex that is required for the up-regulation of AIB1 gene expression. In the presence of increased FoxG1 levels, the activating complex disassembles and disassociates from the AIB1 promoter, leading to reduced AIB1 gene transcription.

Similar articles

Cited by

References

    1. Xu J, Wu RC, O'Malley BW. Normal and cancer-related functions of the p160 steroid receptor co-activator (SRC) family. Nat Rev Cancer. 2009;9:615–630 - PMC - PubMed
    1. Anzick SL, Kononen J, Walker RL, et al. AIB1, a steroid receptor coactivator amplified in breast and ovarian cancer. Science. 1997;277:965–968 - PubMed
    1. Chen H, Lin RJ, Schiltz RL, et al. Nuclear receptor coactivator ACTR is a novel histone acetyltransferase and forms a multimeric activation complex with P/CAF and CBP/p300. Cell. 1997;90:569–580 - PubMed
    1. Suen CS, Berrodin TJ, Mastroeni R, Cheskis BJ, Lyttle CR, Frail DE. A transcriptional coactivator, steroid receptor coactivator-3, selectively augments steroid receptor transcriptional activity. J Biol Chem. 1998;273:27645–27653 - PubMed
    1. Xu J, Li Q. Review of the in vivo functions of the p160 steroid receptor coactivator family. Mol Endocrinol. 2003;17:1681–1692 - PubMed

Publication types

MeSH terms