. 2013 Jun 11;108(11):2354-66.
doi: 10.1038/bjc.2013.217. Epub 2013 May 9.

Model-based patterns in prostate cancer mortality worldwide

Affiliations

Model-based patterns in prostate cancer mortality worldwide

F Fontes et al. Br J Cancer. .

Abstract

Background: Prostate cancer mortality has been decreasing in several high income countries and previous studies analysed the trends mostly according to geographical criteria. We aimed to identify patterns in the time trends of prostate cancer mortality across countries using a model-based approach.

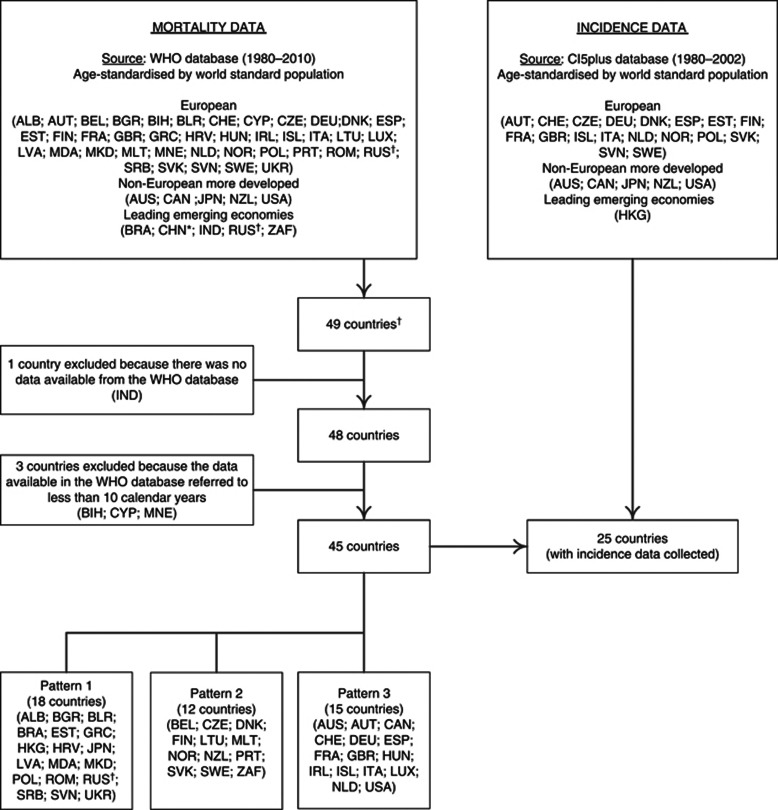
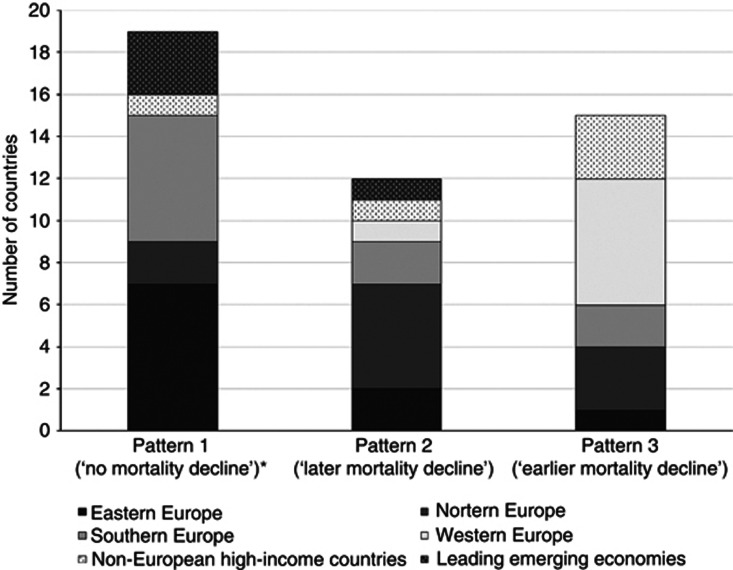
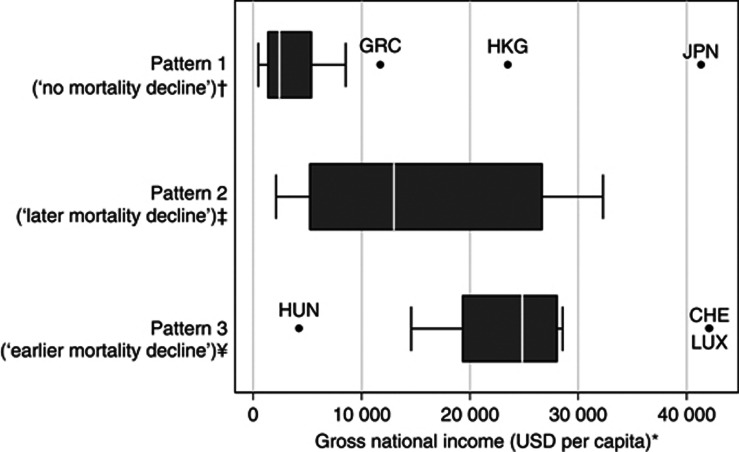
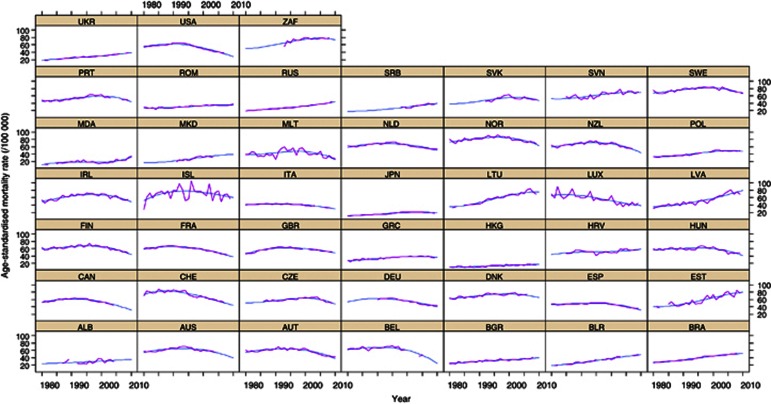
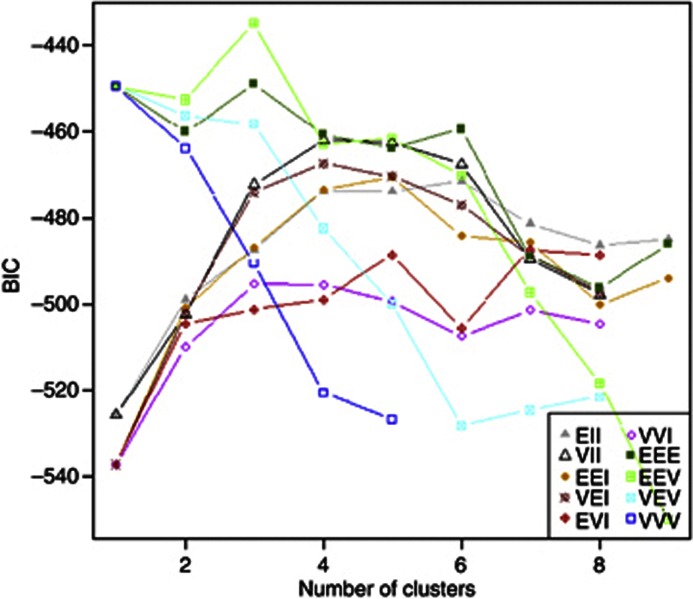
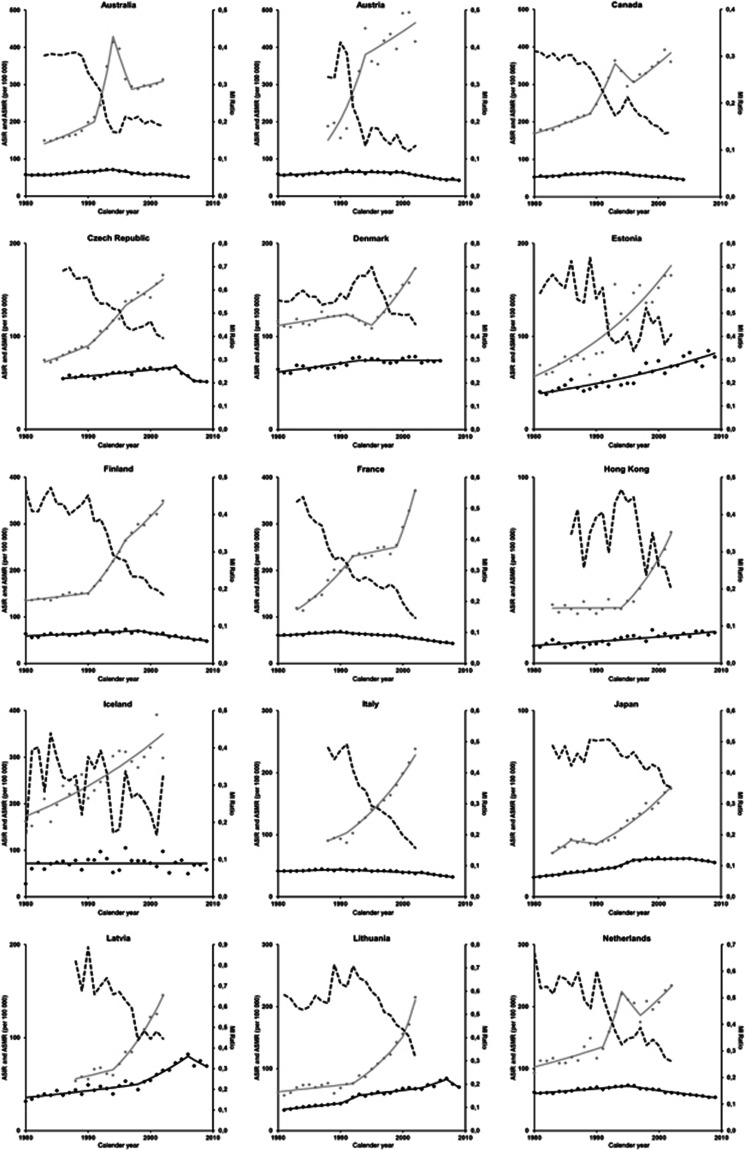
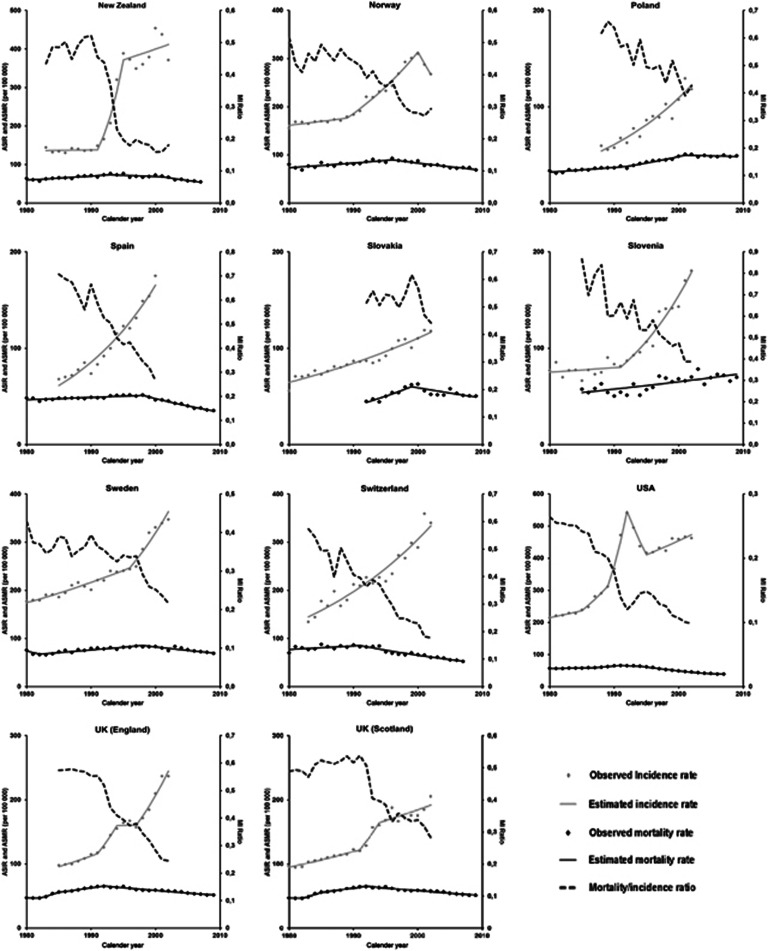
Methods: Model-based clustering was used to identify patterns of variation in prostate cancer mortality (1980-2010) across 37 European, five non-European high-income countries and four leading emerging economies. We characterised the patterns observed regarding the geographical distribution and gross national income of the countries, as well as the trends observed in mortality/incidence ratios.

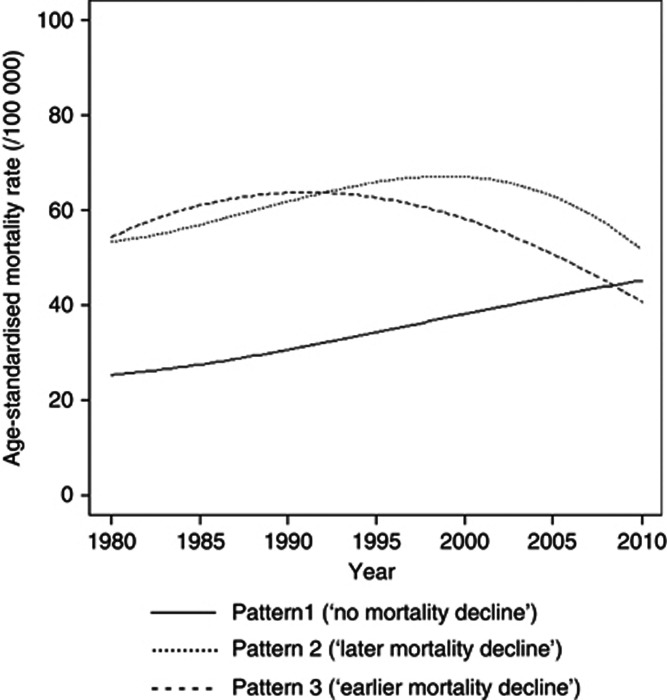
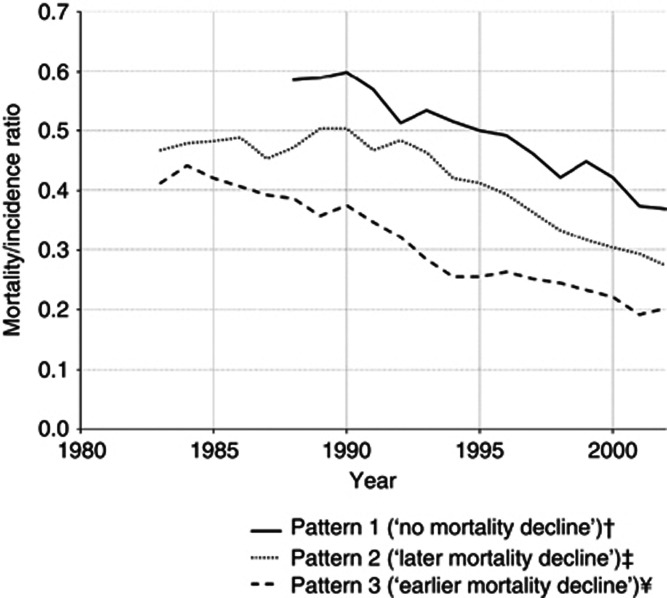
Results: We identified three clusters of countries with similar variation in prostate cancer mortality: pattern 1 ('no mortality decline'), characterised by a continued increase throughout the whole period; patterns 2 ('later mortality decline') and 3 ('earlier mortality decline') depict mortality declines, starting in the late and early 1990s, respectively. These clusters are also homogeneous regarding the variation in the prostate cancer mortality/incidence ratios, while are heterogeneous with reference to the geographical region of the countries and distribution of the gross national income.

Conclusion: We provide a general model for the description and interpretation of the trends in prostate cancer mortality worldwide, based on three main patterns.


Figures

Figure 1
Figure 1
Flowchart of the model-based approach used to identify prostate cancer mortality patterns and estimation of mortality/incidence ratios in the same countries. *For China, we used data from Hong Kong Special Administrative Region because Mainland China uses a special list of causes that does not encode prostate cancer. Russian Federation was considered both as an European country and a leading emerging economy; ALB=Albania; AUS=Australia; AUT=Austria; BEL=Belgium; BIH=Bosnia and Herzegovina; BGR=Bulgaria; BLR=Belarus; BRA=Brazil; CAN=Canada; CYP=Cyprus; CHE=Switzerland; CHN=China; CZE=Czech Republic; DEU=Germany; DNK=Denmark; ESP=Spain; EST=Estonia; FIN=Finland; FRA=France; GBR=United Kingdom; GRC=Greece; HKG=Hong Kong Special Administrative Region; HRV=Croatia; HUN=Hungary; IND=India; IRL=Ireland; ISL=Iceland; ITA=Italy; JPN=Japan; LTU=Lithuania; LUX=Luxembourg; LVA=Latvia; MDA=Republic of Moldova; MNE=Montenegro; MKD=The Former Yugoslav Republic of Macedonia; MLT=Malta; NLD=The Netherlands; NOR=Norway; NZL=New Zealand; POL=Poland; PRT=Portugal; ROM=Romania; RUS=Russian Federation; SRB=Serbia; SVK=Slovakia; SVN=Slovenia; SWE=Sweden; UKR=Ukraine; USA=United States of America; ZAF=South Africa.
Figure 2
Figure 2
Prostate cancer age-standardised mortality rates* (45+ years, direct method, World standard population), for each pattern identified. *Mean of the predictions for each of the countries included in the same pattern.
Figure 3
Figure 3
Number of countries from each region, by pattern of prostate cancer mortality trends. *In pattern 1, Russian Federation is represented twice, among Eastern European countries and the selected leading emerging economies.
Figure 4
Figure 4
Gross national income per capita, by pattern of prostate cancer mortality trends. *The gross national income per capita (Atlas method) (GNI) in 1995 (the midpoint of the period under analysis) was obtained from the World Bank database (The World Bank, 2012). For Croatia, we used the GNI in 1997; for Serbia, we used the GNI in 1999; and for Estonia and Czech Republic, we used the GNI in 2002, as these were the first years with available data for these countries. According to the World Bank classification of economic development, this pattern includes two countries classified as low income (GNI <765 USD), eight countries classified as lower middle income (GNI between 766 and 3035 USD), five countries classified as upper middle income (GNI between 3036 and 9385 USD) and three countries classified as high income (GNI >9385 USD). According to the World Bank classification of economic development, this pattern includes one country classified as lower middle income (GNI between 766 and 3035 USD), four countries classified as upper middle income (GNI between 3036 and 9385 USD) and seven countries classified as high income (GNI >9385 USD). ¥According to the World Bank classification of economic development, this pattern includes one country classified as upper middle income (GNI between 3036 and 9385 USD) and 14 countries classified as high income (GNI >9385 USD). CHE=Switzerland; GRC=Greece; HKG=Hong Kong Special Administrative Region; HUN=Hungary; JPN=Japan; LUX=Luxembourg; USD=United States dollars.
Figure 5
Figure 5
Mortality/incidence ratio for prostate cancer* (age 45+ years), for each pattern identified. Includes the countries for which it was possible to compute MI ratios between 1988 and 2002 (Estonia, Hong Kong SAR, Japan, Latvia; Poland, Slovenia); includes the countries for which it was possible to compute MI ratios between 1983 and 2002 (Denmark; Finland; Lithuania; New Zealand; Norway; Sweden); ¥includes the countries for which it was possible to compute MI ratios between 1983 and 2002 (Australia; Canada; France; Netherlands; Iceland; Switzerland; United Kingdom§; United States of America). §To represent the United Kingdom, we used incidence data from Scotland because incidence data available from England refers to less than the period considered for this analyses. *Each line represents the mean of the MI ratios of the countries included in the same pattern.
Figure A1
Figure A1
Observed and predicted age-standardised mortality rate (direct method, world standard population), in the age group 45+ years. ALB=Albania; AUS=Australia; AUT=Austria; BEL=Belgium; BGR=Bulgaria; BLR=Belarus; BRA=Brazil; CAN=Canada; CHE=Switzerland; CHN=China; CZE=Czech Republic; DEU=Germany; DNK=Denmark; ESP=Spain; EST=Estonia; FIN=Finland; FRA=France; GBR=United Kingdom; GRC=Greece; HKG=Hong Kong Special Administrative Region; HRV=Croatia; HUN=Hungary; IRL=Ireland; ISL=Iceland; ITA=Italy; JPN=Japan; LTU=Lithuania; LUX=Luxembourg; LVA=Latvia; MDA=Republic of Moldova; MKD=The Former Yugoslav Republic of Macedonia; MLT=Malta; NLD=The Netherlands; NOR=Norway; NZL=New Zealand; POL=Poland; PRT=Portugal; ROM=Romania; RUS=Russian Federation; SRB=Serbia; SVK=Slovakia; SVN=Slovenia; SWE=Sweden; UKR=Ukraine; USA=United States of America; ZAF=South Africa.
Figure A2
Figure A2
Bayesian Information Criterion for models considering different geometric features (orientation, volume and shape) of the distribution of the data (intercept, slope, quadratic and cubic terms) and number of clusters. BIC—Bayesian Information Criterion (the plot depicts the BIC value multiplied by −1); EII—Equal volume, equal shape, non-applicable orientation; VII—Variable volume, equal shape, non-applicable orientation; EEI—Equal volume, equal shape, coordinate axes orientation; VEI—Variable volume, equal shape, coordinate axes orientation; EVI—Equal volume, variable shape, coordinate axes orientation; VVI—Variable volume, variable shape, coordinate axes orientation; EEE—Equal volume, equal shape, equal orientation; EEV—Equal volume, equal shape, variable orientation; VEV—Variable volume, equal shape, variable orientation; VVV—Variable volume, variable shape, variable orientation.
Figure A3
Figure A3
Trends in age-standardised (45+ years, direct method, world standard population) mortality rates (ASMR), age-standardised (45+ years, direct method, world standard population) incidence rates (ASIR) and ASMR/ASIR (MI) ratios.
Figure A3
Figure A3
Trends in age-standardised (45+ years, direct method, world standard population) mortality rates (ASMR), age-standardised (45+ years, direct method, world standard population) incidence rates (ASIR) and ASMR/ASIR (MI) ratios.

Similar articles

Cited by

References

    1. Andriole GL, Crawford ED, Grubb RLr, Buys SS, Chia D, Church TR, Fouad MN, Isaacs C, Kvale P, Reding DJ, Weissfeld JL, Yokochi LA, O'Brien B, Ragard LR, Clapp JD, Rathmell JM, Riley TL, Hsing AW, Izmirlian G, Pinsky PF, Kramer BS, Miller AB, Gohagan JK, Prorok PC. Prostate cancer screening in the randomized prostate, lung, colorectal, and ovarian cancer screening trial: mortality results after 13 years of follow-up. J Natl Cancer Inst. 2012;104 (2:125–132. - PMC - PubMed
    1. Bill-Axelson A, Holmberg L, Ruutu M, Garmo H, Stark JR, Busch C, Nordling S, Häggman M, Andersson SO, Bratell S, Spångberg A, Palmgren J, Steineck G, Adami HO, Johansson J. Radical prostatectomy versus watchful waiting in early prostate cancer. N Engl J Med. 2011;364 (48:1708–1717. - PubMed
    1. Bolla M, Collette L, Blank L, Warde P, Dubois JB, Mirimanoff RO, Storme G, Bernier J, Kuten A, Sternberg C, Mattelaer J, Lopez Torecilla J, Pfeffer JR, Lino Cutajar C, Zurlo A, Pierart M. Long-term results with immediate androgen suppression and external irradiation in patients with locally advanced prostate cancer (an EORTC study): a phase III randomised trial. Lancet. 2002;360 (9327:103–106. - PubMed
    1. Bosetti C, Bertuccio P, Chatenoud L, Negri E, La Vecchia C, Levi F. Trends in mortality from urologic cancers in Europe, 1970–2008. Eur Urol. 2011;60 (1:1–15. - PubMed
    1. Bouchardy C, Fioretta G, Rapiti E, Verkooijen HM, Rapin CH, Schmidlin F, Miralbell R, Zanetti R. Recent trends in prostate cancer mortality show a continuos decrease in several countries. Int J Cancer. 2008;123 (2:421–429. - PubMed

Publication types