. 2013 Jun 27;121(26):5184-91.
doi: 10.1182/blood-2013-04-495309. Epub 2013 May 9.

Perforin deficiency impairs a critical immunoregulatory loop involving murine CD8(+) T cells and dendritic cells

Affiliations

Perforin deficiency impairs a critical immunoregulatory loop involving murine CD8(+) T cells and dendritic cells

Catherine E Terrell et al. Blood. .

Abstract

Humans and mice with impaired perforin-dependent cytotoxic function may develop excessive T-cell activation and the fatal disorder hemophagocytic lymphohistiocytosis (HLH) after infection. Though cytotoxic lymphocytes can kill antigen-presenting cells, the physiological mechanism of perforin-mediated immune regulation has never been demonstrated in a disease-relevant context. We used a murine model of HLH to examine how perforin controls immune activation, and we have defined a feedback loop that is critical for immune homeostasis. This endogenous feedback loop involves perforin-dependent elimination of rare, antigen-presenting dendritic cells (DCs) by CD8(+) T cells and has a dominant influence on the magnitude of T-cell activation after viral infection. Antigen presentation by a minor fraction of DCs persisted in T-cell- or perforin-deficient animals and continued to drive T-cell activation well beyond initial priming in the latter animals. Depletion of DCs or transfer of perforin-sufficient T cells dampened endogenous DC antigen presentation and T-cell activation, demonstrating a reciprocal relationship between perforin in CD8(+) T cells and DC function. Thus, selective cytotoxic "pruning" of DC populations by CD8(+) T cells limits T-cell activation and protects against the development of HLH and potentially other immunopathological conditions.


Figures
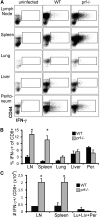
Figure 1
Figure 1
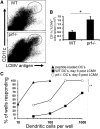
In vivo IFN-γ production by CD8+ T cells in various tissues from WT and prf−/− mice after LCMV infection. (A) Seven days after LCMV infection, CD8+ T cells producing IFN-γ in vivo were assessed by flow cytometry (fixed immediately ex vivo without additional stimulation; see “Methods”). Live gated, CD8+/CD4 cells are shown from each of the indicated tissues (lymph node represents mesenteric lymph nodes; peritoneum represents cells in the peritoneal cavity). (B) The percentage of CD8+ cells producing IFN-γ in vivo in the indicated tissue is displayed (minus any background staining seen in uninfected animals). (C) The absolute number of CD8+ cells producing IFN-γ in vivo in the indicated organ is displayed. The number plotted for lymph nodes is an extrapolation based on the estimate that the mesenteric lymph nodes represent 25% of all lymph nodes (ie, the number for all lymph nodes = mesenteric lymph nodes × 4). IFN-γ+ cells from lung, liver, and the peritoneal cavity are combined in the final bar graph in order to plot them on the same scale as lymphoid tissues. *P < .01, compared with the same tissue in WT mice. LN, lymph node; Per, peritoneal cavity; Lu, lung; Liv, liver.
Figure 2
Figure 2
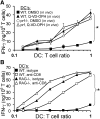
DCs are the principle cell type presenting antigen and driving T-cell activation 1 week after LCMV infection in WT and prf−/− mice. (A) LCMV-specific CD8+ effector T cells (P14 transgenic) were cultured at the indicated ratios with either purified DCs (CD11c+) or non-DC APCs (depleted of CD11c+ and TCR+ cells) obtained from the spleens of prf−/− mice 6 days after LCMV infection. Production of IFN-γ by effector T cells was measured in culture supernatants at 24 hours. IFN-γ production was not detected when APCs were cultured with T cells of irrelevant specificity (OT1) (see Figure 3). (B) WT and prf−/− mice were irradiated and reconstituted with prf+/+/CD11cDTR or prf−/−/CD11cDTR, bone marrow, respectively. Animals were infected with LCMV and treated on days 5 and 6 with either phosphate-buffered saline (PBS) or DT. On day 7, splenic CD8+ T cells producing IFN-γ in vivo were measured (as in Figure 1). *P < .05; **P < .01.
Figure 3
Figure 3
DC numbers and function in WT and prf−/− mice after LCMV infection are shown. (A) Splenic DCs (CD11c+/major histocompatibility class II+ cells) were quantitated in uninfected WT mice, LCMV-infected (day 6) WT, and prf−/− mice (day 6). (B) Splenic DCs were sorted from WT or prf−/− mice 6 days after LCMV infection and cultured with LCMV-specific (P14) or ovalbumin-specific (OT1) CD8+ effector T cells at the indicated ratios. IFN-γ production was measured by ELISA at 24 hours. (C) Splenic DCs were sorted from WT and prf−/− mice at the indicated times after LCMV infection and cultured at a fixed ratio (0.4:1, DC/T cell) with LCMV-specific effector T cells. Data are presented ± standard error. *P < .001. N.S., not significant.
Figure 4
Figure 4
Increased numbers of DCs in prf−/− mice contain viral antigen and present it to T cells after LCMV infection. (A) Example dot plots are shown of live gated spleen cells, analyzed 6 days after LCMV infection, stained for CD11c and LCMV antigens. (B) The total number of LCMV antigen+ DCs (staining above isotype) per spleen in WT and prf−/− mice, 6 days after LCMV infection, is displayed. *P < .01. (C) Splenic DCs were sorted from WT and prf−/− mice 6 days after LCMV infection and cultured in limiting numbers in a high-sensitivity antigen presentation assay with LCMV (GP33)–specific effector CD8+ T cells (see “Methods”). To define the sensitivity of this assay and provide a positive control, a portion of sorted DCs from prf−/− mice were loaded with GP33 peptide and plated in parallel wells. The percentage of individual wells producing measurable IFN-γ at each concentration of DCs is plotted against the number of DCs per well. *P < .01, comparing WT and prf−/− response curves at DC concentrations of 30 to 1000 cells per well.
Figure 5
Figure 5
CD8+ T cells and the action of caspases are necessary for the suppression of antigen presentation by endogenous DCs after viral infection. (A) Six days after LCMV infection, splenic DCs were sorted from WT or prf−/− mice that were treated with either the pan-caspase inhibitor Q-VD-OPH or the carrier (dimethylsulfoxide) on day 5 and cultured as above with LCMV-specific CD8+ T cells at the indicated ratios. IFN-γ production was measured by ELISA after overnight culture. (B) Six days after LCMV infection, splenic DCs were sorted from WT and RAG−/− mice given either CD8-depleting antibody or an isotype control antibody. DCs were cultured with LCMV-specific CD8+ T cells. IFN-γ production was measured by ELISA after overnight culture. *P < .005.
Figure 6
Figure 6
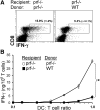
Perforin-expressing CD8+ T cells are sufficient to suppress host T-cell activation in vivo and viral antigen presentation by endogenous DCs. Naive, polyclonal CD8+ T cells from WT or prf−/− donors (CD45.1 congenic) were transferred into prf−/− mice to achieve high levels of donor T-cell chimerism (20% to 30%; see “Methods”). Two weeks later, recipients were infected with LCMV. (A) Seven days after infection, in vivo IFN-γ production by T cells was assessed (as in Figure 1). Live gated, endogenous (host) CD8+ T cells are shown. (B) Antigen presentation by splenic DCs from recipient mice was assessed by sorting DCs 7 days after infection and culturing with LCMV-specific CD8+ T cells. *P < .01.
Figure 7
Figure 7
Perforin-mediated immune regulation is shown as a negative feedback loop. In response to pathogens, DCs prime, or initiate, T-cell responses. T-cell populations expand, differentiate, and direct successful resistance to infection. As cytotoxic CD8+ T-cell populations expand, they continue to interact with DCs (presumably in a reiterative fashion) and selectively eliminate those that continue to present infection-related antigens. This selective pruning of DC populations suppresses the principle driver of ongoing T-cell activation and expansion. Defects in this loop lead to the pathological overshooting of immune activation and the disorder known as HLH.

References

    1. Jordan MB, Allen CE, Weitzman S, Filipovich AH, McClain KL. How I treat hemophagocytic lymphohistiocytosis. Blood. 2011;118(15):4041–4052. - PMC - PubMed
    1. Jordan MB, Hildeman D, Kappler J, Marrack P. An animal model of hemophagocytic lymphohistiocytosis (HLH): CD8+ T cells and interferon gamma are essential for the disorder. Blood. 2004;104(3):735–743. - PubMed
    1. Pachlopnik Schmid J, Ho CH, Diana J, et al. A Griscelli syndrome type 2 murine model of hemophagocytic lymphohistiocytosis (HLH). Eur J Immunol. 2008;38(11):3219–3225. - PubMed
    1. Jessen B, Maul-Pavicic A, Ufheil H, et al. Subtle differences in CTL cytotoxicity determine susceptibility to hemophagocytic lymphohistiocytosis in mice and humans with Chediak-Higashi syndrome. Blood. 2011;118(17):4620–4629. - PubMed
    1. Lykens JE, Terrell CE, Zoller EE, Risma K, Jordan MB. Perforin is a critical physiologic regulator of T-cell activation. Blood. 2011;118(3):618–626. - PMC - PubMed

Publication types

MeSH terms