. 2013 May 9;4(5):e625.
doi: 10.1038/cddis.2013.148.

FoxO3a is activated and executes neuron death via Bim in response to β-amyloid

Affiliations

FoxO3a is activated and executes neuron death via Bim in response to β-amyloid

P Sanphui et al. Cell Death Dis. .

Abstract

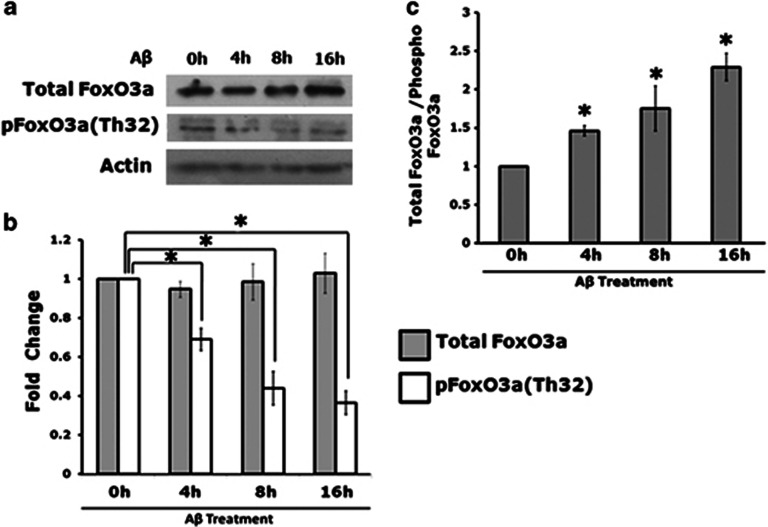
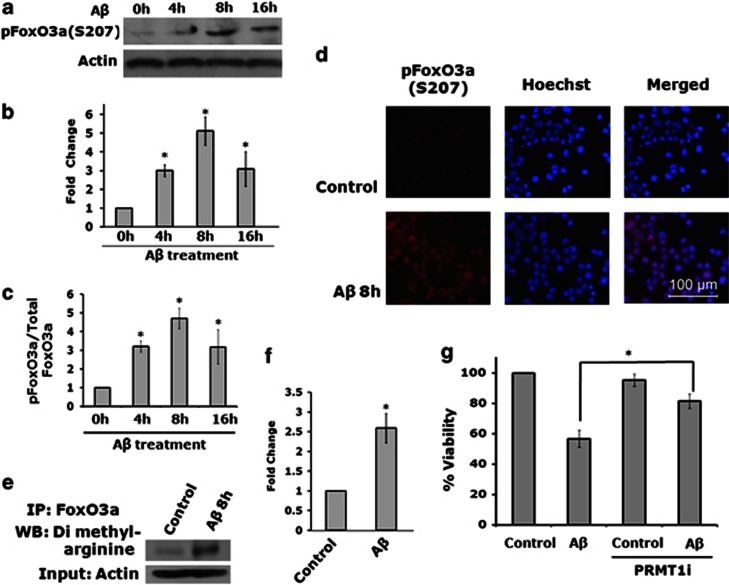
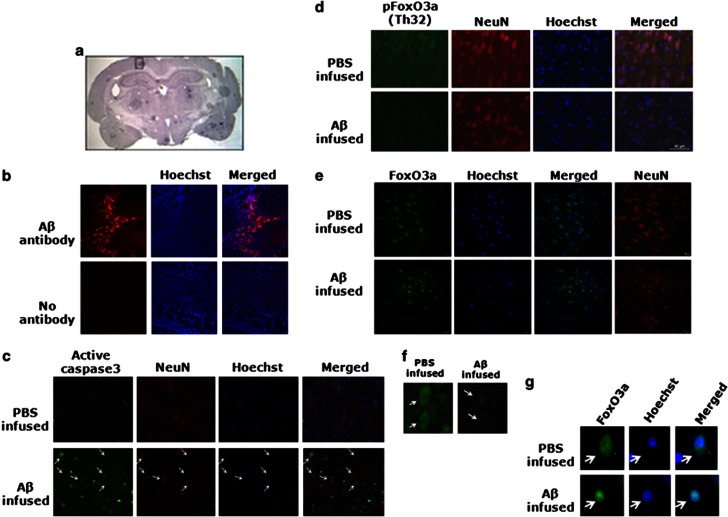
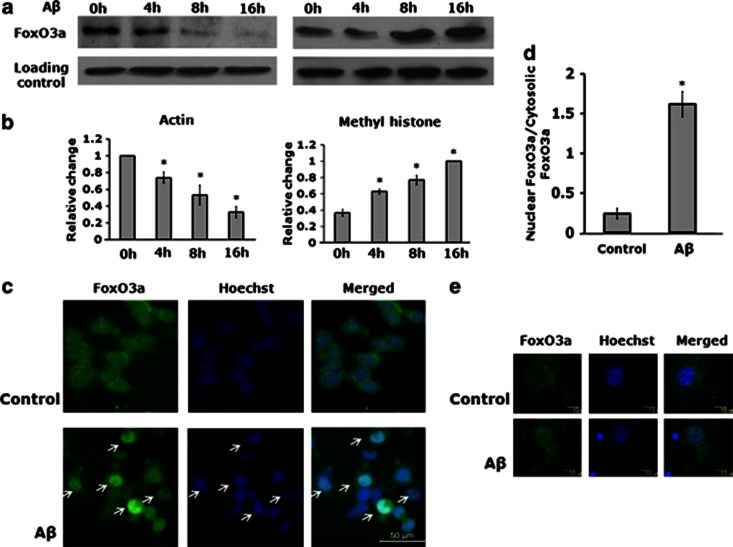
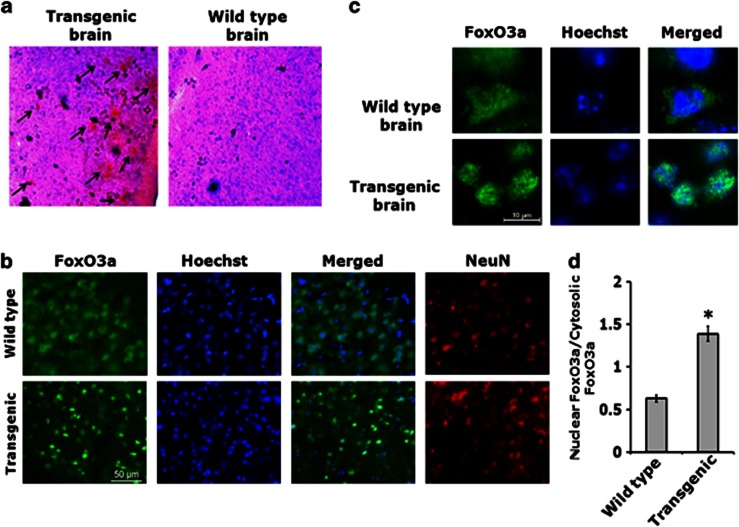
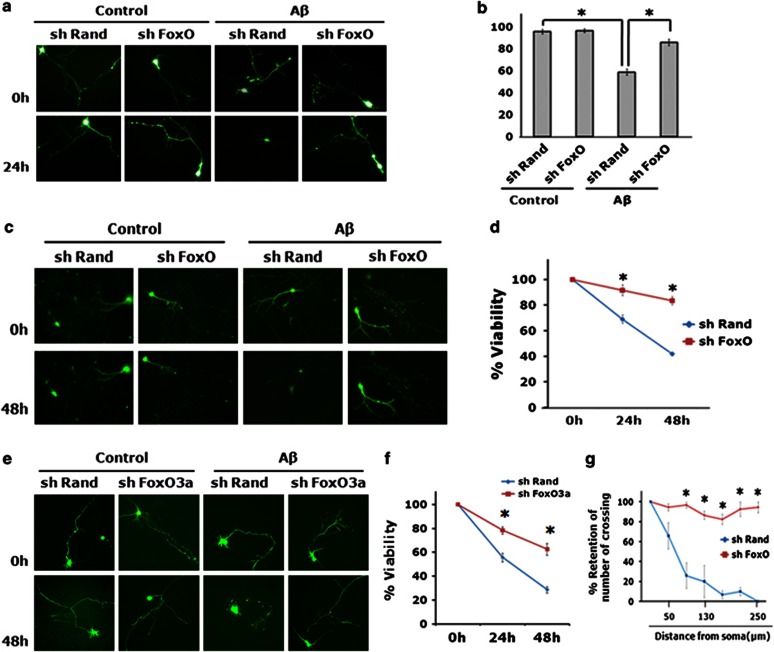
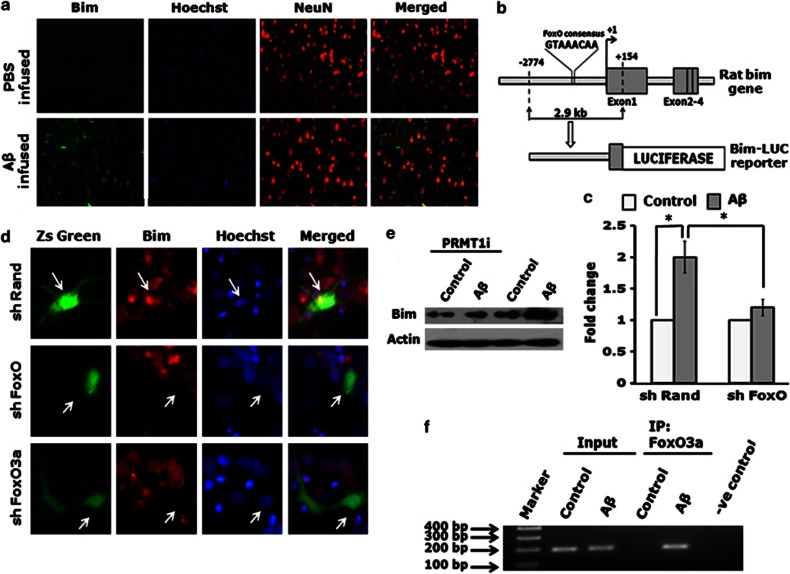
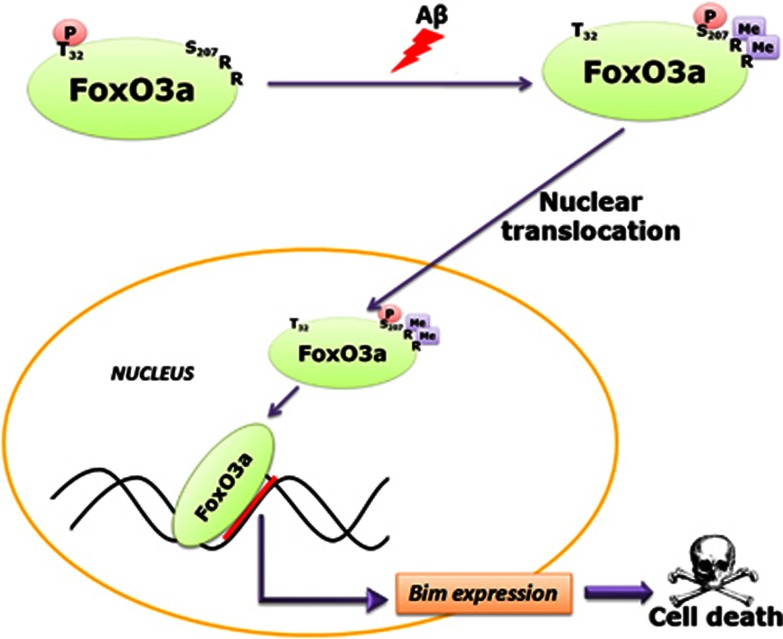
The molecules that mediate death of selective neurons in Alzheimer's disease (AD) are mostly unknown. The Forkhead transcription factor FoxO3a has emerged as an important mediator of cell fate including apoptosis. When phosphorylated by Akt, it is localized in the cytosol as an inactive complex bound with 14-3-3 protein. For activation and localization of FoxO3a in the nucleus, further modifications are required, such as phosphorylation by mammalian sterile 20-like kinase 1 (MST1) and arginine methylation by protein arginine methyltransferase1. We report here that Akt-mediated phosphorylation of FoxO3a is diminished in neurons exposed to oligomeric β-amyloid (Aβ), in vitro and in vivo. We also find that oligomeric Aβ activates FoxO3a by MST1 phosphorylation and arginine methylation in primary cultures of hippocampal and cortical neurons. Moreover, FoxO3a translocates from the cytosol to nucleus in cultured neurons in response to Aβ. Most importantly, the nuclear redistribution of FoxO3a is significantly increased in Aβ-overexpressing AβPPswe-PS1dE9 mice and Aβ-infused rat brains. We further find that FoxO3a is essential for loss of neurons and neural networks in response to Aβ. Recent reports implicate Bim, a pro-apoptotic member of Bcl-2 family, in neuron death in AD, as a key target of this transcription factor. We show that Bim is a direct target of FoxO3a in Aβ-treated neurons. Our findings thus indicate that FoxO3a is activated, translocated to the nucleus and mediates neuron death via Bim in response to Aβ toxicity.


Figures

Figure 1
Figure 1
Level of phosphorylation at Thr32 of FoxO3a is drastically reduced in response to Aβ. (a) Primary cortical neurons were exposed to oligomeric Aβ1-42 (1.5 μM) for indicated times. The total cell lysates were prepared as described in the experimental procedure and then proteins were separated by SDS-PAGE and probed by western blotting using enhanced chemiluminescence for the level of total FoxO3a and phosphorylated FoxO3a by using specific antibodies against FoxO3a and p-FoxO3a (Thr32). A representative immunoblot showing FoxO3a and p-FoxO3a levels is depicted. Actin level was used as loading control. (b) Graphical representation of the level of FoxO3a and p-FoxO3a as determined by scanning and quantification with NIH imageJ program. Data represent mean±S.E.M. of six independent experiments. *P<0.05. (c) Graphical representation of the ratio of total FoxO3a and p-FoxO3a protein level in cortical neurons exposed to Aβ. This ratio represents the level of active form of FoxO3a protein in the cell. Data are represented as mean±S.E.M. of six independent experiments. Asterisks denote statistically significant differences between 0 h (control) and 4, 8, 16 h of Aβ treatment: *P<0.001
Figure 2
Figure 2
MST1-mediated phosphorylation of FoxO3a at Ser207 and arginine methylation of FoxO3a increase on Aβ exposure. (a) Primary cortical neurons were exposed to oligomeric Aβ1-42 (1.5 μM) for the indicated times. The total cell lysates were separated by SDS-PAGE and subjected to western blotting using enhanced chemiluminescence. Specific antibody was used to detect the level of FoxO3a phosphorylated at serine 207. A representative immunoblot showing p-FoxO3a(S207) levels is depicted. Actin level was used as loading control. (b) Graphical representation of densitometric results of p-FoxO3a(S207) levels as determined by NIH imageJ program. Data are represented as mean±S.E.M. of three independent experiments. Asterisks denote statistically significant differences between 0 h (control) and 4, 8, 16 h of Aβ treatment: *P<0.01. (c) Graphical representation of ratio of PhosphoFoxO3a (S207) and total FoxO3a protein level in cortical neurons exposed to Aβ. This ratio represents the level of active form of FoxO3a protein in the cell. Data represented as mean±S.E.M. of three independent experiments. Asterisks denote statistically significant differences between 0 h (control) and 4, 8, 16 h of Aβ treatment: *P<0.001. (d) Differentiated PC12 cells were treated with Aβ1-42 (5 μM) for 8 h and immunostained with pFoxO3a(S207) antibody. Alexa Fluor 568 was used as secondary antibody. The nucleus was stained with Hoechst. Fluorescence microscope images show an increase in the level of pFoxO3a(S207) in cells exposed to Aβ1-42 (5 μM). (e) Methylation of FoxO3a at arginine residues in response to Aβ. Primary rat cortical neurons were treated with oligomeric Aβ1-42 (1.5 μM) for 8 h. The cell lysates were analysed for the level of FoxO3a methylated at the arginine residues. For this, total FoxO3a was immunoprecipitated using anti-FoxO3a antibody followed by western blotting by anti-dimethyl arginine antibody. A representative immunoblot showing increase in the arginine methylation of FoxO3a in Aβ1-42-treated cells is depicted. (f) Graphical representation of densitometric analysis of levels of FoxO3a methylated at arginine residues as determined by NIH imageJ program. Data are represented as mean±S.E.M. of three independent experiments. Asterisks denote statistically significant differences between control and treatment: *P<0.01. (g) Primary rat cortical neurons were treated with or without Aβ1-42 in the presence and absence of a chemical inhibitor of PRMT1. Quantitative data show significant protection of cells by the chemical inhibitor of PRMT1 against Aβ1-42-induced death. Data are represented as mean±S.E.M. of three independent experiments.*P<0.05
Figure 3
Figure 3
FoxO3a is dephosphorylated following Aβ1-42 infusion in vivo. (a) The rats were infused with either Aβ1-42 or PBS in the right hemisphere of the brain in the treated or control group, respectively. After 21 days of infusion, the animals were killed and the brains were taken out following cardiac perfusion. The frozen brains were sectioned by cryotome. Representative image of a brain section stained with haematoxylin–eosin is shown. (b) Brain sections of the treated rats were immunostained with Aβ1-42 antibody to check the presence of Aβ plaques in the infused area. Upper panel shows brain section stained with anti-Aβ1-42 antibody. Lower panel shows brain sections from the same animal stained without any primary antibody as a negative control. (c) Brain sections (portion marked with black box in a) of control and treated groups were co-immunostained for active caspase3 and NeuN. Nuclei were stained with Hoechst. Arrows show neurons with high active caspase-3 staining. Representative image of six sections from three animals with similar results is shown here. Images were taken under × 40 objective. (d) Brain sections (portion marked with black box in a) of control and treated groups were co-immunostained for p-FoxO3a(Thr32) and NeuN. Nuclei were stained with Hoechst. Representative images of six sections from three animals with similar result are shown here. Scale bar, 50 μm. (e) Confocal images of brain sections from control and treated groups were co-immunostained for FoxO3a and NeuN. Nuclei were stained with Hoechst. Representative images of six sections from three animals with similar results are shown here. Scale bar, 10 μm. (f) Enlarged view of the first column of d, showing cells from treated and control brains immunostained with p-FoxO3a(Th32). Arrows show neurons with high or low p-FoxO3a(Th32) staining. (g) Enlarged view of the first column of e, showing cells from treated and control brains immunostained with FoxO3a. Arrows show the neurons with cytosolic or nuclear FoxO3a
Figure 4
Figure 4
FoxO3a is translocated from the cytosol to the nucleus in neuronal cells in response to Aβ. (a and b) Primary cortical neurons (7DIV) were exposed to oligomeric Aβ1-42 (1.5 μM) for the indicated times. The cytosolic and nuclear extracts were isolated as described in the experimental procedure and proteins were analysed by western blotting, as described in Figure 1a, for the level of FoxO3a. (a) Representative immunoblots showing change in FoxO3a levels in the cytosol (left) and nucleus (right). (b) Graphical representation of change in FoxO3a protein level in the cytosol (left) and nucleus (right). Asterisks denote statistically significant differences between 0 h (control) and 4, 8, 16 h of Aβ treatment: *P<0.05. (c) Aβ exposure causes the translocation of FoxO3a from the cytosol to the nucleus in differentiated PC12 cells. Differentiated PC12 cells (5DIV) were treated with Aβ for 16 h. Cells were then fixed and immunostained with FoxO3a antibody and Hoechst. Localization of FoxO3a was visualized by using fluorescence microscopy. (d) Graphical representation of FoxO3a translocation in differentiated PC12 cells following Aβ exposure as quantified by NIH imageJ. Data represent mean±S.E.M of seven different cells from two independent experiments. Asterisks denote statistically significant differences between control and treatment: *P<0.001. (e) Aβ exposure causes the translocation of FoxO3a from the cytosol to the nucleus in hippocampal neurons. Hippocampal neurons (24DIV) were maintained with or without Aβ for 16 h. Cells were then fixed and immunostained with FoxO3a. The nucleus was stained with Hoechst. Localization of FoxO3a was visualized by using confocal microscopy
Figure 5
Figure 5
Increased nuclear distribution of FoxO3a in neurons of AβPPswe-PS1dE9 transgenic mice. The brain tissues from AβPPswe-PS1dE9 transgenic mice and control littermate were analysed for FoxO3a subcellular distribution. (a) Congo red staining of brain slices from transgenic and wild-type mice. Transgenic mice brain shows the presence of amyloid plaques (shown by arrow), whereas such plaques were absent in the wild-type brain tissue. Representative images of nine sections from three animals of each group with similar results are shown here. Images taken under × 5 objective. (b) Brain sections of wild-type and transgenic animals were co-immunostained for FoxO3a and NeuN. Nuclei were stained with Hoechst. Representative images of five sections from three animals of each group with similar results are shown here. Scale bar, 50 μm. (c) Enlarged view of the first three columns of B showing cells from transgenic and wild-type brains immunostained with FoxO3a. Scale bar, 10 μm. (d) Graphical representation of distribution of FoxO3a in the cytosol and nucleus in cortical neurons of wild-type or transgenic animals as quantified by NIH imageJ. Data represent mean±S.E.M. of about 60 different neurons from three animals of each group. Asterisks denote statistically significant differences between wild-type and transgenic animals: *P<0.001
Figure 6
Figure 6
siRNA-mediated knockdown of FoxO and FoxO3a protects the primary rat cortical, hippocampal neurons against Aβ toxicity. (a) Primary rat cortical neurons (7DIV) were transfected with shRand-zsgreen or shFoxO-zsgreen. Forty-eight hours post transfection, oligomeric Aβ1-42 was treated for 24 h. Live green cells were counted after 24 h under fluorescense microscope. Representative pictures of primary rat cortical neurons that were transfected with shRand-zsgreen or shFoxO-zsgreen and exposed to Aβ. (b) Graphical representation of percentage of the viable cells. Asterisks denote statistically significant differences between shRand and shFoxO: *P<0.01. (c) Primary hippocampal neurons (22 DIV) were transfected with shRand-zsgreen or shFoxO-zsgreen. 48 h post transfection, oligomeric Aβ1-42 was treated for 48 h. Live green cells were counted at indicated times under fluorescense microscope. Representative pictures of primary rat hippocampal neurons that were transfected with shRand-zsgreen or shFoxO-zsgreen and exposed to Aβ for 48 h. (d) Graphical representation of percentage of viable cells. Asterisks denote statistically significant differences from shRand (control): *P<0.01. (e) Primary rat cortical neurons (7DIV) were transfected with shRand-zsgreen or shFoxO3a-zsgreen. Forty-eight hours post transfection, oligomeric Aβ1-42 was treated for 48 h. Live green cells were counted after 24 and 48 h under a fluorescence microscope. Representative images of primary rat cortical neurons that were transfected with shRand-zsgreen or shFoxO3a-zsgreen and exposed to Aβ. (f) Graphical representation of percentage of viable cells. Asterisks denote statistically significant differences from shRand (control): *P<0.01. (g) Downregulation of FoxO protects neuronal processes and networks against Aβ toxicity. Hippocampal neurons transfected with either shRand or shFoxO were treated with Aβ for 48 h and then were imaged under a fluorescence microscope. Sholl analyses of imaged neurons were done as described in the experimental procedure. Data represent mean±S.E.M. of six different neurons from three independent cultures for each class. Asterisks denote statistically significant differences from shRand (control): *P<0.001
Figure 7
Figure 7
FoxO is required for induction of Bim following Aβ exposure. (a) Brain sections of Aβ or PBS-infused rats were co-immunostained for Bim and NeuN. Nuclei were stained with Hoechst. A representative image of six sections from three animals with similar results is shown here. Images were taken under × 20 objective. (b) Schematic representation of Bim-LUC reporter consisting 2.9 kb of the rat bim gene extending 5′ from exon 1. (c) FoxO is necessary for the activation of a Bim promoter-driven luciferase activity in response to Aβ. Neuronally, differentiated PC12 cells were cotransfected with 0.3 μg of Bim-LUC and 0.1 μg of the renilla luciferase expression construct pRL-CMV with 0.4 μg of either shRand or shFoxO per well of 24-well plate. Forty-eight hours post transfection, cells were treated with Aβ for 24 h and processed for luciferase assay. The data are shown as relative firefly luciferase expression normalized to renilla luciferase activity and represent mean±S.E.M. of three independent experiments performed in duplicate/triplicate. (d) shRNAs targeted to FoxO or FoxO3a blocks Bim expression in primary cortical neurons subjected to Aβ exposure. It shows neurons that were transfected with the indicated constructs, maintained for 48 h and then subjected to Aβ for 20 h, after which they were immunostained with antibodies against Bim. Arrows indicate transfected neurons. (e) PRMT1 inhibiton blocks Aβ-induced upregulation of Bim. Cortical neurons were treated with or without Aβ in the presence or absence of PRMT1 inhibitor. The cell lysates were analysed by western blotting for the Bim level. (f) Binding of FoxO3a with endogenous Bim promoter is increased in cultured cortical neurons following Aβ exposure. Primary cultures of rat cortical neurons were treated with or without Aβ for 6 h. An equal number of cells was processed for chromatin immunoprecipitation assay using anti-FoxO3a antibody for immunoprecipitation. The immunoprecipitated materials were subjected to PCR using primers against the portion of Bim promoter that flanks one FoxO-binding site. PCR products were verified by agarose gel electrophoresis. Templates were DNA from cells before chromatin immunoprecipitation (input), DNA in immunoprecipitated (IP) materials with or without FoxO3a antibody or an irrelevant antibody (−ve control). The figure shows a representative image of two independent experiments with similar results
Figure 8
Figure 8
Schematic representation of FoxO3a activation and neuron death in response to Aβ

References

    1. Huang Y, Mucke L. Alzheimer mechanisms and therapeutic strategies. Cell. 2012;148:1204–1222. - PMC - PubMed
    1. Hardy J, Selkoe DJ. The amyloid hypothesis of Alzheimer's disease: progress and problems on the road to therapeutics. Science. 2002;297:353–356. - PubMed
    1. Selkoe DJ. Alzheimer's disease results from the cerebral accumulation and cytotoxicity of amyloid beta-protein. J Alzheimers Dis. 2001;3:75–80. - PubMed
    1. Biswas SC, Shi Y, Vonsattel JP, Leung CL, Troy CM, Greene LA. Bim is elevated in Alzheimer's disease neurons and is required for beta-amyloid-induced neuronal apoptosis. J Neurosci. 2007;27:893–900. - PMC - PubMed
    1. Kudo W, Lee HP, Smith MA, Zhu X, Matsuyama S, Lee HG. Inhibition of Bax protects neuronal cells from oligomeric Abeta neurotoxicity. Cell Death Dis. 2012;3:e309. - PMC - PubMed

Publication types

MeSH terms