

Impact of methimazole treatment on magnesium concentration and lymphocytes activation in adolescents with Graves' disease
- PMID: 23661330
- PMCID: PMC3667385
- DOI: 10.1007/s12011-013-9690-z
Impact of methimazole treatment on magnesium concentration and lymphocytes activation in adolescents with Graves' disease
Abstract
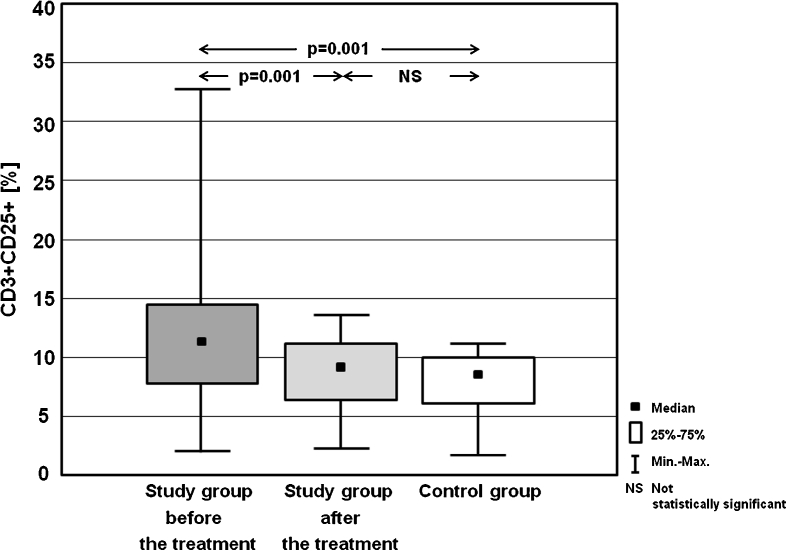
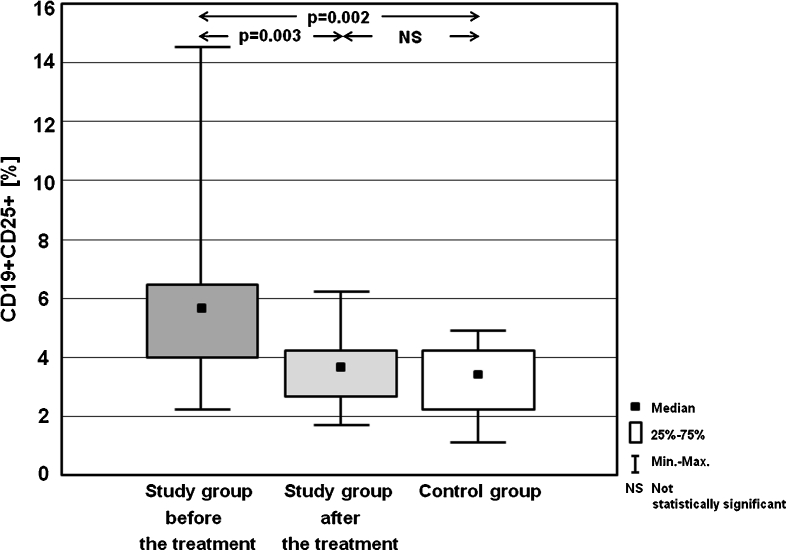
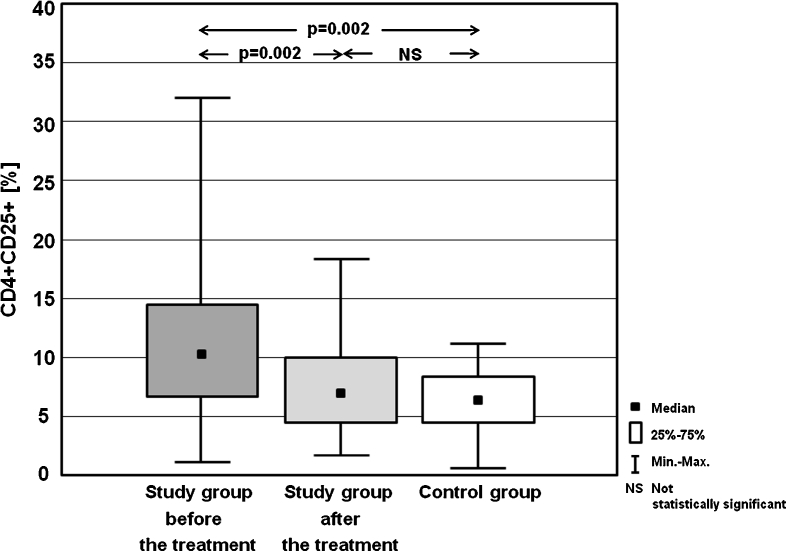
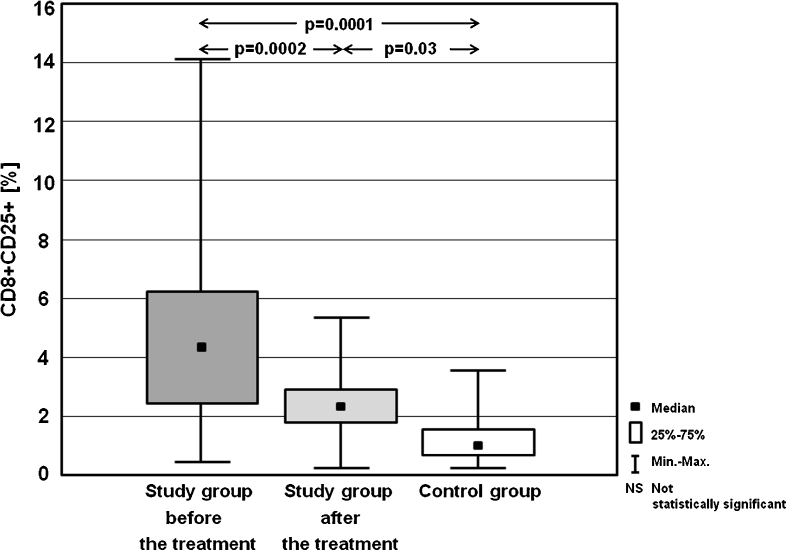
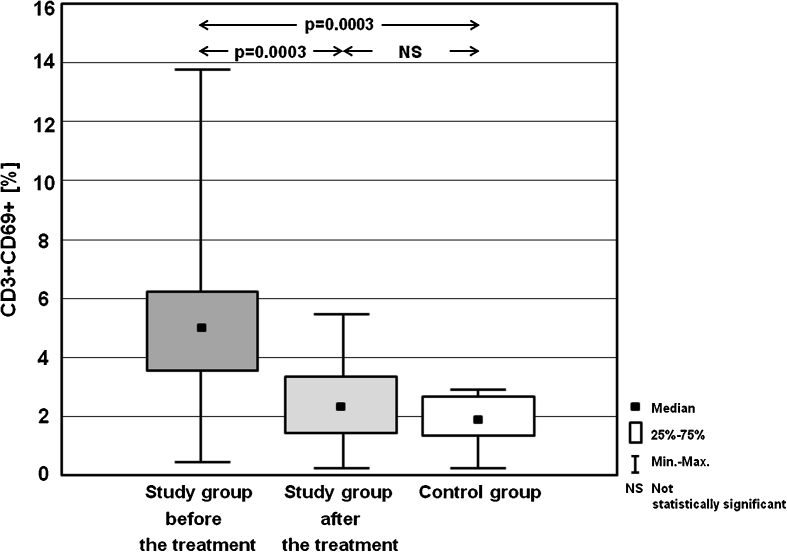
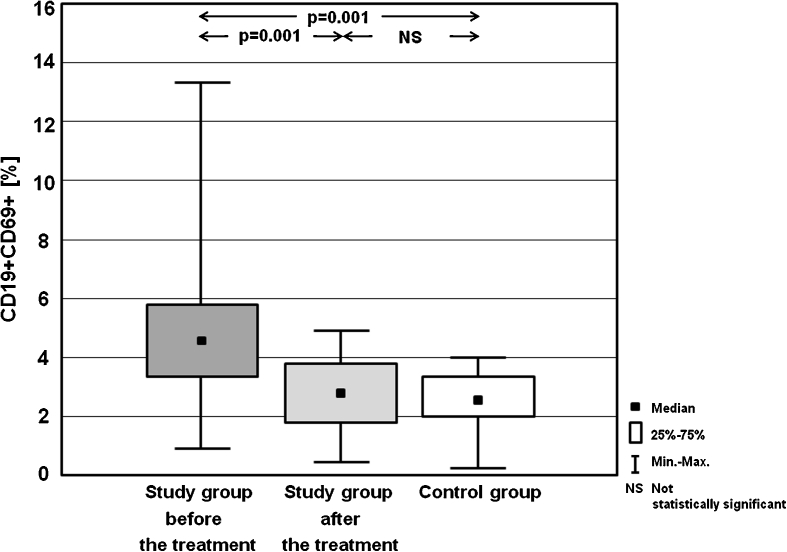
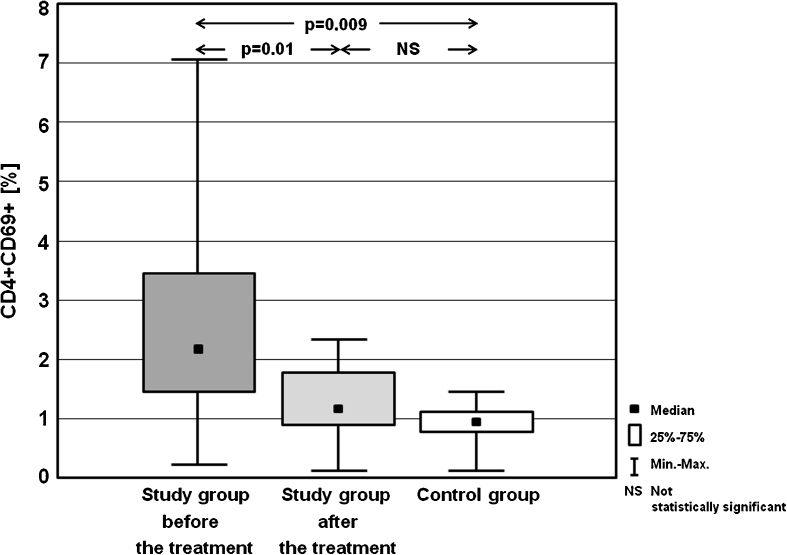
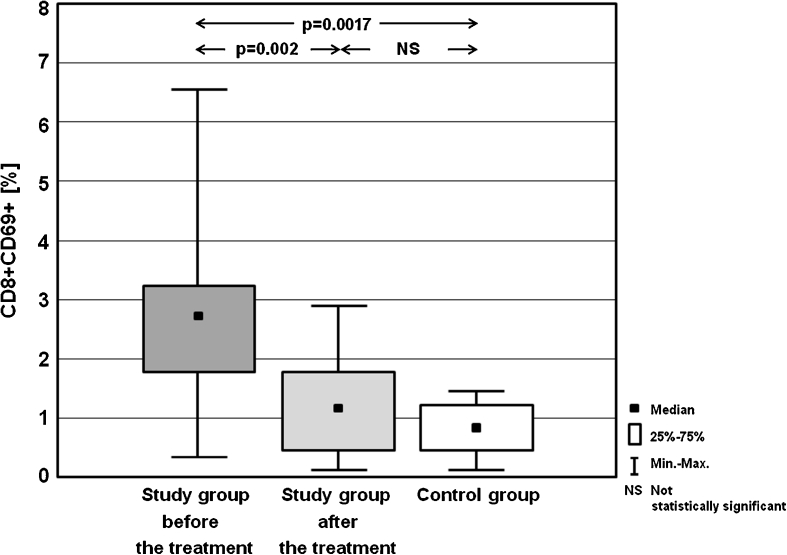
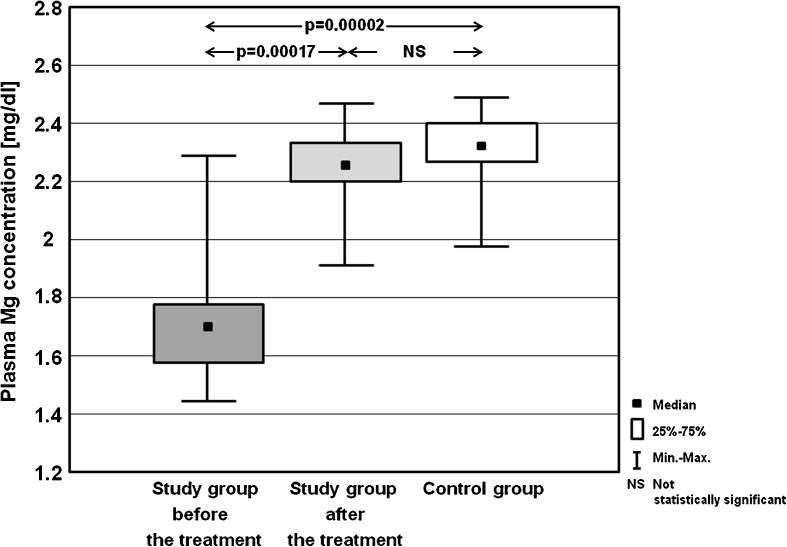
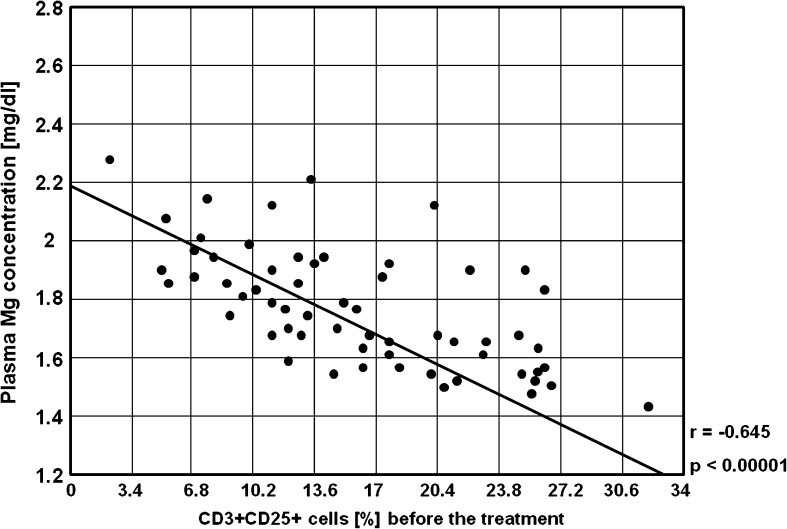
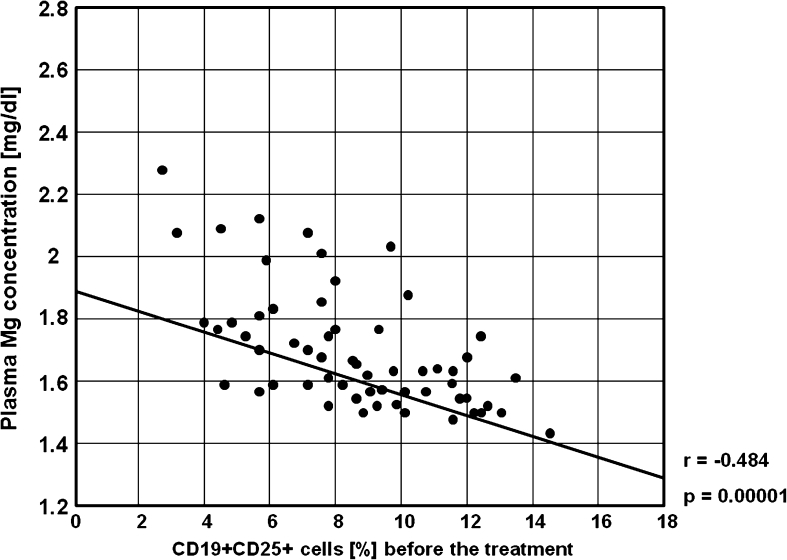
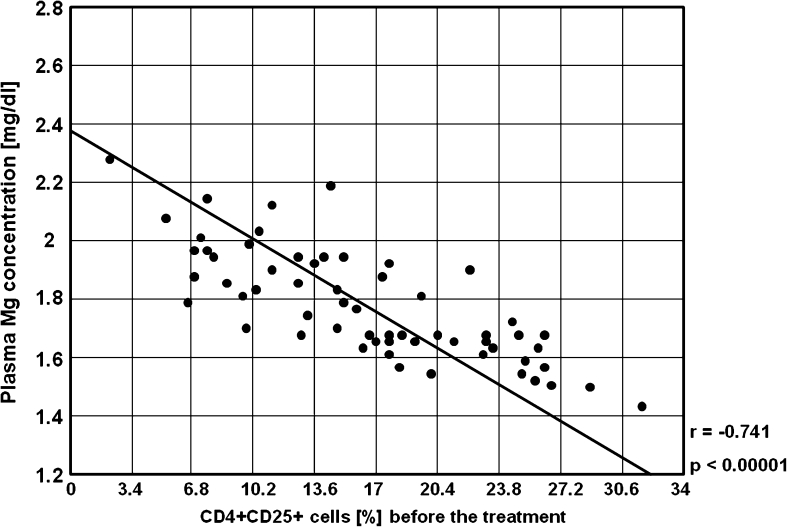
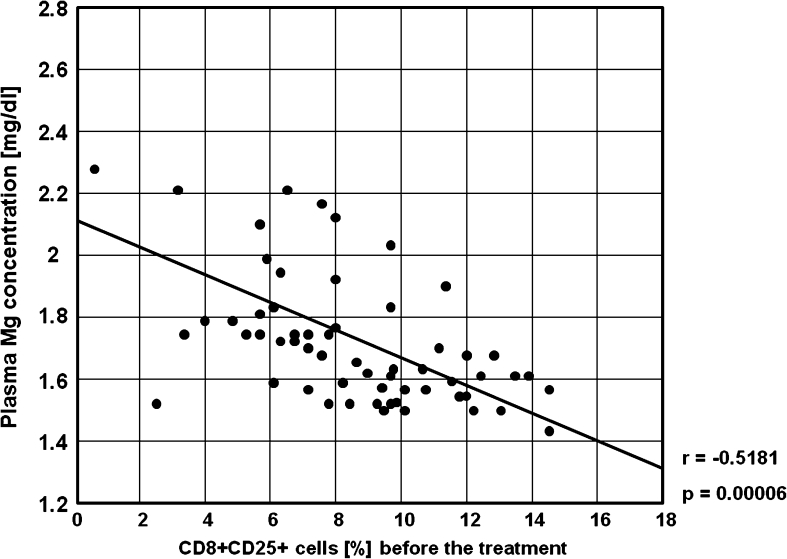
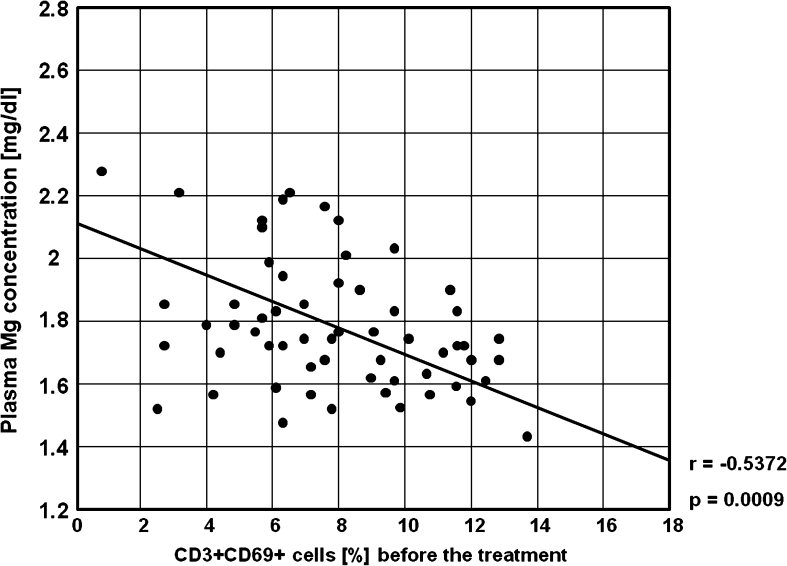
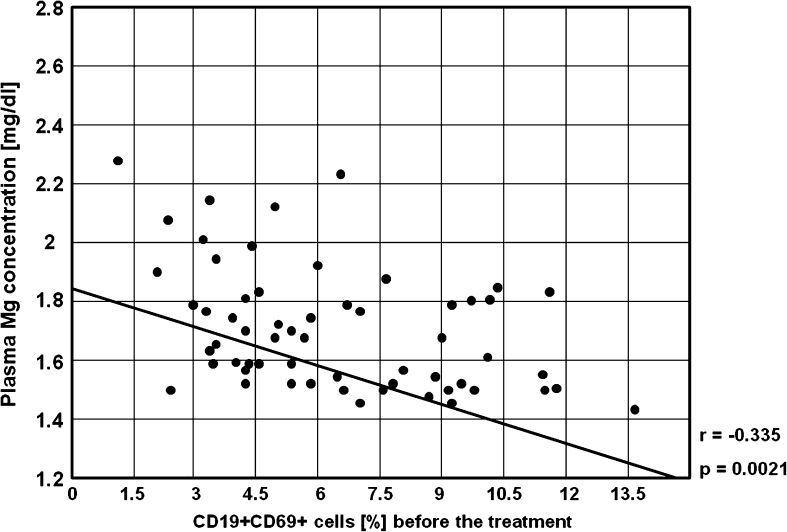
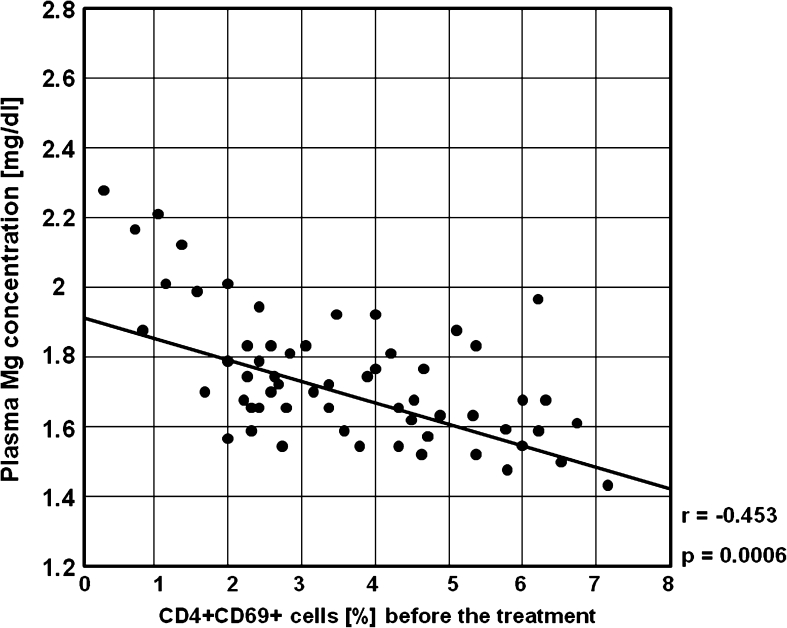
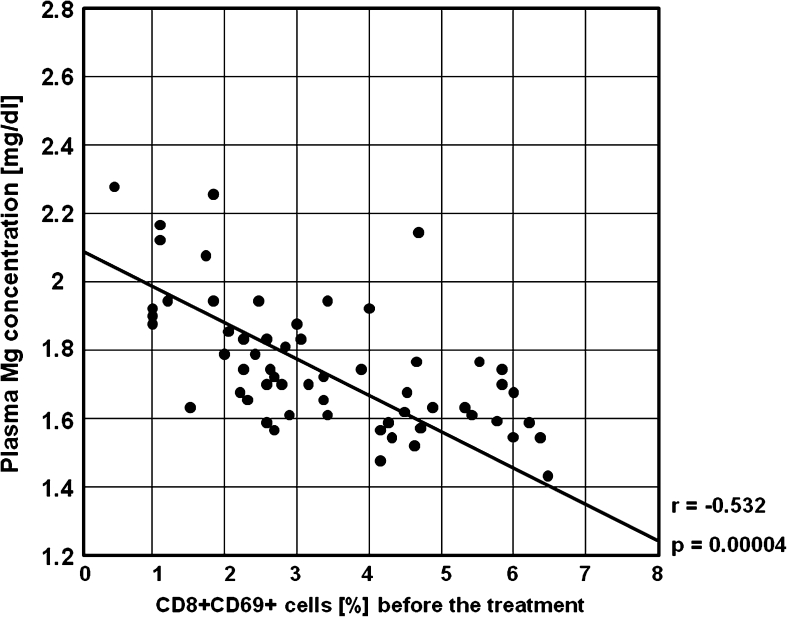
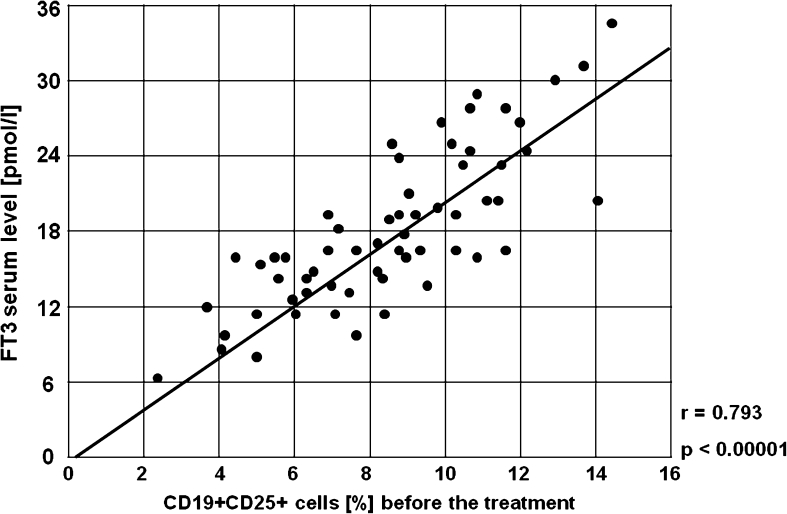
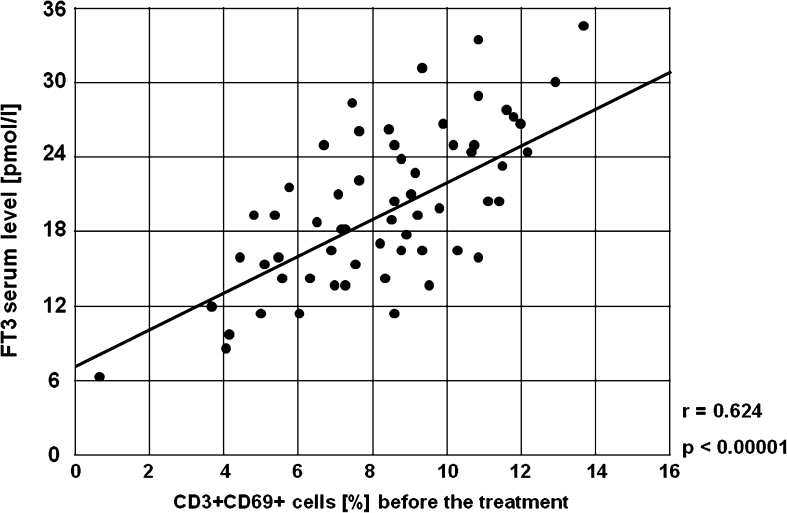
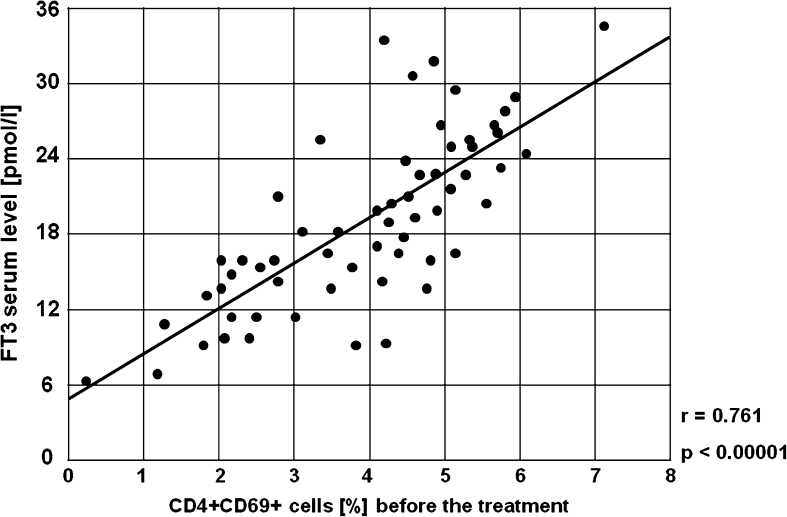
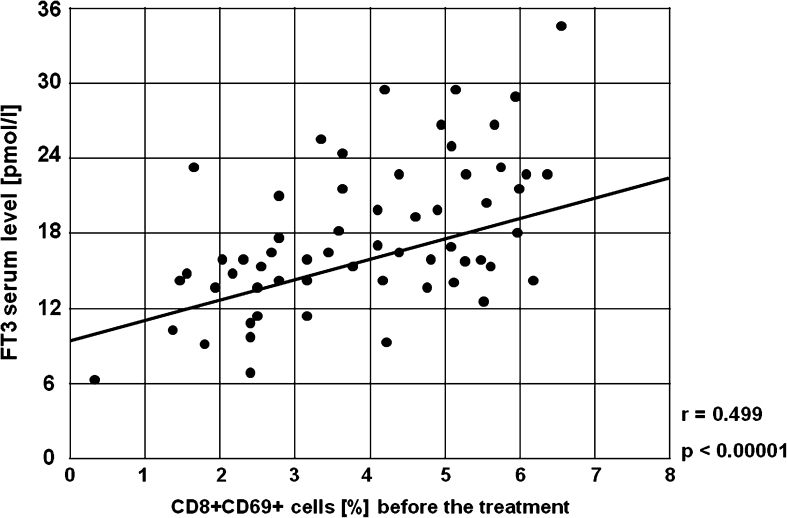
The aim of this research was to assess plasma magnesium (Mg) concentration, the frequencies of activated T CD4+ and T CD8+ lymphocytes and B lymphocytes in adolescents with hyperthyroidism due to Graves' disease (GD), and to assess changes in the above-mentioned parameters during methimazole (MMI) treatment. The frequencies of activated T and B cells were measured by flow cytometry method and plasma Mg concentration was determined by spectrophotometry method in 60 adolescents at the time of GD diagnosis and after receiving the normalisation of the thyroid hormones levels. The control group consisted of 20 healthy volunteers. We observed lower plasma Mg concentration, and higher frequencies of activated T and B lymphocytes in the study group before the treatment in comparison with healthy controls, and with study group in MMI-induced euthyreosis (p < 0.01).Statistically significant negative correlations between the percentages of activated T CD3+, T CD4+, T CD8+ and B CD19+ lymphocytes, and plasma Mg concentration before the treatment were found (r < -0.335, p < 0.002). After the treatment no vital differences in plasma Mg concentration, and in percentages of activated cells between GD patients and controls were found, except CD8+CD25+ cells (p = 0.03). The present study demonstrates that both activated T and B cells might play an important role in the pathogenesis of GD, and activation is related to Mg plasma level. The use of MMI in treatment of hyperthyroidism due to GD leads to decrease the frequencies of activated lymphocytes and normalisation of Mg levels.
Figures
Similar articles
-
Th17 and Treg cells in adolescents with Graves' disease. Impact of treatment with methimazole on these cell subsets.Autoimmunity. 2014 May;47(3):201-11. doi: 10.3109/08916934.2013.879862. Epub 2014 Jan 20. Autoimmunity. 2014. PMID: 24443787
-
Treatment of Graves' disease with methimazole in children alters the proliferation of Treg cells and CD3+ T lymphocytes.Folia Histochem Cytobiol. 2014;52(1):69-77. doi: 10.5603/FHC.2014.0008. Folia Histochem Cytobiol. 2014. PMID: 24802963
-
[Analysis of costimulatory molecules (CD28-CTLA-4/B7) expression on chosen mononuclear cells in adolescents with Graves' disease during methimazole therapy].Endokrynol Diabetol Chor Przemiany Materii Wieku Rozw. 2004;10(2):93-101. Endokrynol Diabetol Chor Przemiany Materii Wieku Rozw. 2004. PMID: 15504312 Polish.
-
Analysis of changes in the percentage of B (CD19) and T (CD3) lymphocytes, subsets CD4, CD8 and their memory (CD45RO), and naive (CD45RA) T cells in children with immune and non-immune thyroid diseases.J Pediatr Endocrinol Metab. 2003 Jan;16(1):63-70. doi: 10.1515/jpem.2003.16.1.63. J Pediatr Endocrinol Metab. 2003. PMID: 12585342
-
Impact of treatment with methimazole on the Bcl-2 expression in CD8+ peripheral blood lymphocytes in children with Graves' disease.Ann Agric Environ Med. 2013;20(4):884-8. Ann Agric Environ Med. 2013. PMID: 24364474
Cited by
-
Severely low serum magnesium is associated with increased risks of positive anti-thyroglobulin antibody and hypothyroidism: A cross-sectional study.Sci Rep. 2018 Jul 2;8(1):9904. doi: 10.1038/s41598-018-28362-5. Sci Rep. 2018. PMID: 29967483 Free PMC article.
-
Diet in Thyroid Disorders: A Survey among Clinicians and a Review of the Current Perspective.Indian J Endocrinol Metab. 2024 Jul-Aug;28(4):378-384. doi: 10.4103/ijem.ijem_68_24. Epub 2024 May 29. Indian J Endocrinol Metab. 2024. PMID: 39371648 Free PMC article.
-
Novel compound heterozygous mutation of SLC12A3 in Gitelman syndrome co-existent with hyperthyroidism: A case report and literature review.World J Clin Cases. 2022 Jul 26;10(21):7483-7494. doi: 10.12998/wjcc.v10.i21.7483. World J Clin Cases. 2022. PMID: 36158002 Free PMC article.
-
Complicated Gitelman syndrome and autoimmune thyroid disease: a case report with a new homozygous mutation in the SLC12A3 gene and literature review.BMC Endocr Disord. 2018 Nov 8;18(1):82. doi: 10.1186/s12902-018-0298-3. BMC Endocr Disord. 2018. PMID: 30409157 Free PMC article. Review.
-
Gitelman syndrome with Graves' disease leading to rhabdomyolysis: a case report and literature review.BMC Nephrol. 2023 May 2;24(1):123. doi: 10.1186/s12882-023-03180-8. BMC Nephrol. 2023. PMID: 37131142 Free PMC article. Review.
References
-
- Nauman J, Nauman A. Graves disease: etiopathogenesis, clinics, treatment. Polish J Endocrinol. 1995;46:3–8.
-
- Rivkees SA. The treatment of Graves' disease in children. J Pediatr Endocrinol Metab. 2006;19:1095–1111. - PubMed
-
- Lombardo F, Messina MF, Salzano G, Rabbone I, Lo Presti D, Calcaterra V, Aversa T, De Luca F, Wasniewska M. Prevalence, presentation and clinical evolution of Graves' disease in children and adolescents with type 1 diabetes mellitus. Horm Res Paediatr. 2011;76:221–225. doi: 10.1159/000327587. - DOI - PubMed
-
- Mao C, Wang S, Xiao Y, Xu J, Jiang Q, Jin M, Jiang X, Guo H, Ning G, Zhang Y. Impairment of regulatory capacity of CD4+CD25+ regulatory T cells mediated by dendritic cell polarization and hyperthyroidism in Graves' disease. J Immunol. 2011;186:4734–4743. doi: 10.4049/jimmunol.0904135. - DOI - PubMed
Publication types
MeSH terms
Substances
LinkOut - more resources
Full Text Sources
Other Literature Sources
Research Materials
