. 2013 May 10;340(6133):759-62.
doi: 10.1126/science.1234274.

Compartmentalization of GABAergic inhibition by dendritic spines

Affiliations

Compartmentalization of GABAergic inhibition by dendritic spines

Chiayu Q Chiu et al. Science. .

Abstract

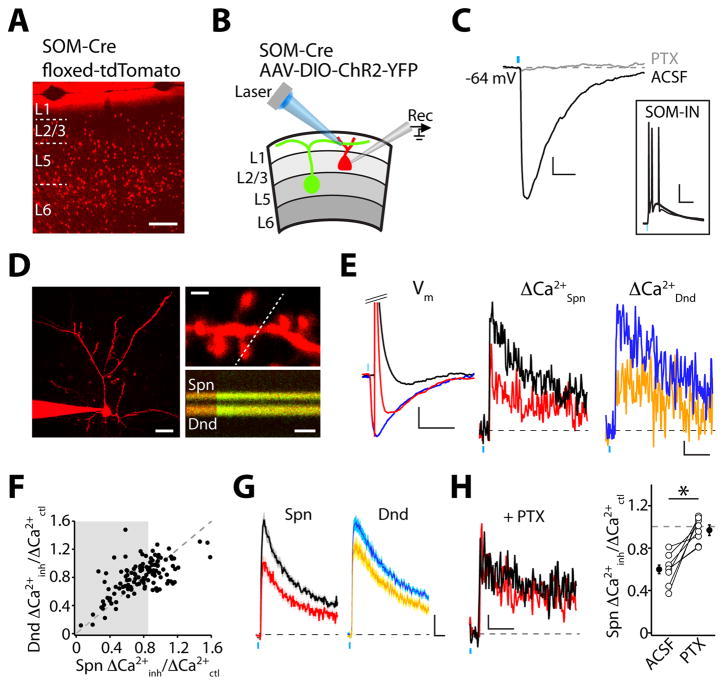
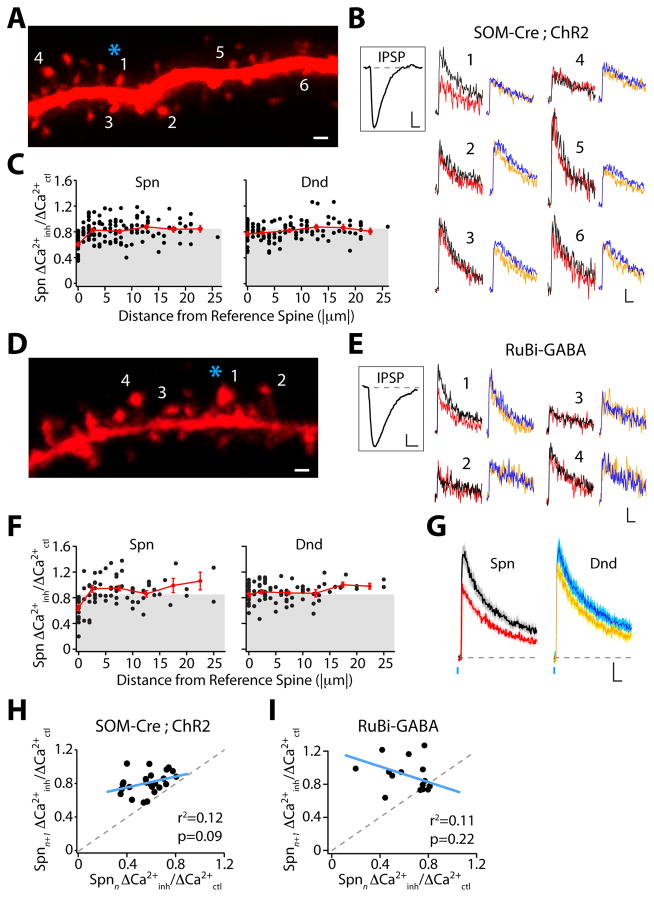
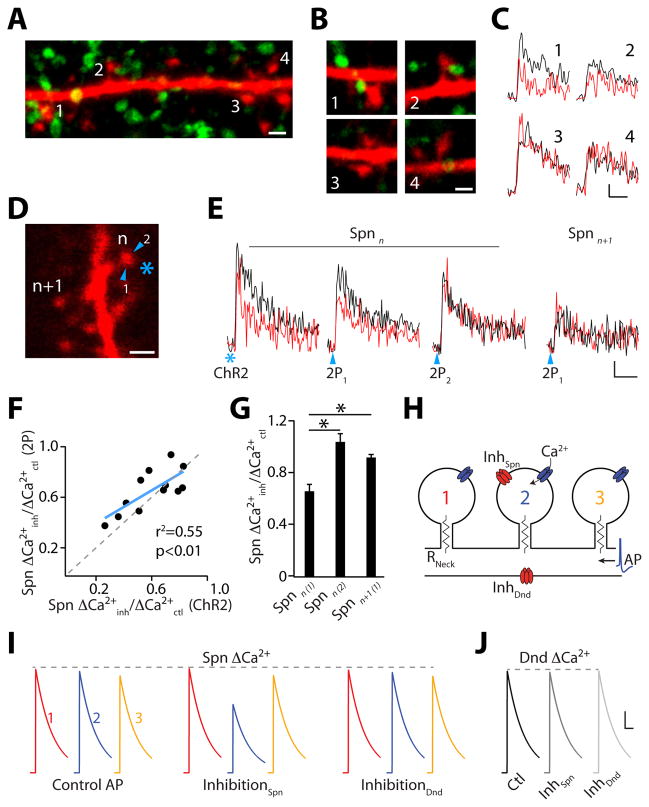
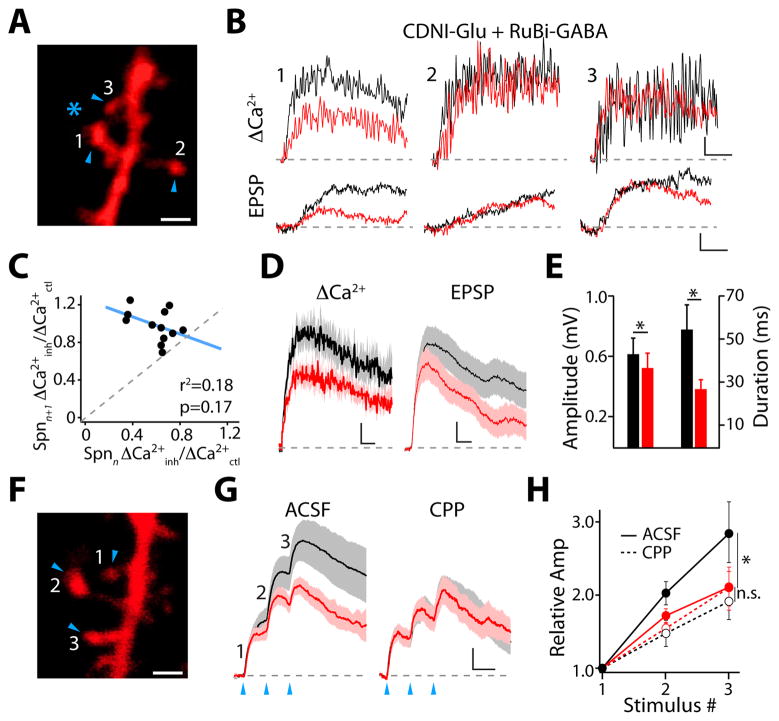
γ-aminobutyric acid-mediated (GABAergic) inhibition plays a critical role in shaping neuronal activity in the neocortex. Numerous experimental investigations have examined perisomatic inhibitory synapses, which control action potential output from pyramidal neurons. However, most inhibitory synapses in the neocortex are formed onto pyramidal cell dendrites, where theoretical studies suggest they may focally regulate cellular activity. The precision of GABAergic control over dendritic electrical and biochemical signaling is unknown. By using cell type-specific optical stimulation in combination with two-photon calcium (Ca(2+)) imaging, we show that somatostatin-expressing interneurons exert compartmentalized control over postsynaptic Ca(2+) signals within individual dendritic spines. This highly focal inhibitory action is mediated by a subset of GABAergic synapses that directly target spine heads. GABAergic inhibition thus participates in localized control of dendritic electrical and biochemical signaling.


Figures

Fig. 1
Fig. 1
SOM-INs mediate inhibition of dendritic Ca(2+) signals. (A) td-Tomato expression in the prefrontal cortex of SOM-Cre;Ai9 mice. Scale bar: 200 μm. (B) Recording configuration. (C) Light-evoked IPSPs (ACSF) are abolished by picrotoxin (PTX). Scale bars: 1 mV, 50 ms. Inset: Light-evoked APs in a SOM-IN. Scale bars: 20 mV, 50 ms. (D) Left, 2PLSM image of a layer 2/3 pyramidal neuron. Scale bar: 25 μm. Right, AP-evoked ΔCa(2+) in the spine and dendritic shaft indicated by the dashed line. Scale bars: 1 μm, 50 ms. (E) Left, Vm during AP (black), IPSP (blue), and IPSP-AP (red). Scale bars: 2 mV, 100 ms. Middle and right, ΔCa(2+) (Spn, Dnd) in response to AP (black, blue) or IPSP-AP (red, orange). Scale bars: 1% ΔG/Gsat, 100 ms. (F) Ca(2+) inhibition for dendritic shafts versus spines. Gray region indicates significant spine inhibition. (G) Average Ca(2+) signals (±SEM) evoked by AP or IPSP-AP for locations showing significant inhibition. Scale bars: 1% ΔG/Gsat, 50 ms. (H) Left, Ca(2+) transients from spine in (E), recorded in picrotoxin. Scale bars: 1% ΔG/Gsat, 100 ms. Right, Average Ca(2+) inhibition before (ACSF) and after GABAA block (PTX). * indicates p<0.05 (paired Student’s t-test).
Fig. 2
Fig. 2
GABAergic dendritic inhibition is highly compartmentalized. (A) Inhibition mapping utilizing ChR2 stimulation (asterisk) of SOM-INs. Scale bar: 1 μm. (B) ΔCa(2+) evoked by AP and IPSP-AP for spines (black and red, respectively) and dendritic shafts (blue and orange, respectively) indicated in (A). Scale bars: 2% ΔG/Gsat, 50 ms. Inset: somatic IPSP. Scale bars: 1 mV, 100 ms. (C) Population data for Ca(2+) inhibition versus distance from the reference spine. Average binned (5 μm) data shown in red. Gray region indicates significant inhibition. (D) Inhibition mapping utilizing GABA uncaging. Scale bar: 1 μm. (E) ΔCa(2+) evoked by AP and IPSP-AP. Scale bars: 2% ΔG/Gsat, 50 ms. Inset: somatic IPSP. Scale bar: 1 mV, 100 ms. (F) As in (C) for GABA uncaging. (G) Average Ca(2+) signal (± SEM) for GABA uncaging experiments. Scale bars: 2% ΔG/Gsat, 50 ms. (H) Lack of correlation between ChR2-evoked inhibition for reference (n) and adjacent (n+1) spines. (I) As in (H) for GABA uncaging.
Fig. 3
Fig. 3
GABAergic synapses on spines mediate local Ca(2+) inhibition. (A) Confocal projection of a dendrite (red) and ChR2-EYFP-positive boutons (green). Scale bar: 1 μm. (B) Single section images of spines from (A). Scale bar: 1 μm. (C) ΔCa(2+) measured in spines from (B) for AP (black) and IPSP-AP (red). Scale bars: 1% ΔG/Gsat, 50 ms. (D) Inhibition mapping utilizing ChR2 (asterisk) or 2PLUGABA (arrowheads). Scale bar: 1 μm. (E) ΔCa(2+) in reference spine (n) and neighbor (n+1) for AP (black) and IPSP-AP (red). Scale bars: 2% ΔG/Gsat, 50 ms. (F) Correlation between ChR2- and 2PLUGABA-evoked inhibition. (G) Average Ca(2+) inhibition (±SEM) evoked by 2PLUGABA. (H) Computational model of dendritic inhibition. (I) Simulated GABAergic input selectively inhibits ΔCa(2+) in spine 2. GABAergic input onto dendritic shaft has minimal effect on ΔCa(2+). (J) GABAergic input does not inhibit Ca(2+) in the dendritic shaft. Scale bars (I and J): 100 nM, 100 ms. * indicates p<0.05 (paired Student’s t-test).
Fig. 4
Fig. 4
Dendritic inhibition regulates synaptic integration. (A) Inhibition of responses evoked by 2PLUGlu (arrowheads) utilizing 1-photon GABA uncaging (asterisk). Scale bar: 1 μm. (B) ΔCa(2+) and voltage transients for EPSP (black) and IPSP-EPSP (red) for spines indicated in (A). Scale bars: 4% ΔG/Gsat, 50 ms (upper), 0.1 mV, 5 ms (lower). (C) Ca(2+) inhibition is not correlated between neighboring spines. (D) Average ΔCa(2+) and somatic voltage transients (± SEM) for EPSP alone (black) and IPSP-EPSP (red) pairing. Scale bars: 2% ΔG/Gsat, 50 ms (left), 0.1 mV, 10 ms (right). (E) Average amplitude and duration (±SEM) of voltage transients for EPSP (black) and IPSP-EPSP pairing (red). (F) Integration of responses evoked by 2PLUGlu (arrowheads). Scale bar: 1 μm. (G) Average voltage transients (± SEM) for EPSP (black) and IPSP-EPSP (red) evoked by 2PLUGlu on three neighboring spines, recorded in control ACSF (left) or with NMDARs blocked by CPP (right). Scale bars: 0.25 mV, 20 ms. (H) Relative summation of EPSPs (black) or IPSP-EPSPs (red), recorded in control ACSF or with CPP. * indicates p<0.05 (Wilcoxon matched pairs test).

Comment in

References

    1. Gupta A, Wang Y, Markram H. Science. 2000;287:273. - PubMed
    1. Fishell G, Rudy B. Annual review of neuroscience. 2011;34:535. - PMC - PubMed
    1. Dumitriu D, Cossart R, Huang J, Yuste R. Cerebral cortex. 2007;17:81. - PubMed
    1. Somogyi P, Tamas G, Lujan R, Buhl EH. Brain research reviews. 1998;26:113. - PubMed
    1. Wang Y, et al. The Journal of physiology. 2004;561:65. - PMC - PubMed

Publication types