Reduced use of erythropoiesis-stimulating agents and intravenous iron with ferric citrate: a managed care cost-offset model
- PMID: 23662073
- PMCID: PMC3647605
- DOI: 10.2147/IJNRD.S40729
Reduced use of erythropoiesis-stimulating agents and intravenous iron with ferric citrate: a managed care cost-offset model
Abstract
Background: Ferric citrate (FC) is a phosphate binder in development for the treatment of hyperphosphatemia in patients with end-stage renal disease (ESRD). In clinical trials, FC improved patient serum phosphorus levels and increased serum ferritin and percent transferrin saturation. Because nephrologists respond to increases in these iron measures by reducing intravenous (IV) iron and erythropoiesis-stimulating agent (ESA) doses, the decreased use of iron and ESA associated with FC may reduce costs.
Objectives: To develop a cost-offset model from a managed care perspective estimating the cost savings associated with FC use.
Methods: We created a cost-offset model from the managed care payer perspective that compared the treatment costs of ESRD for patients given FC. The model considered the number of dialysis sessions per month; number of ESRD patients enrolled in the health plan; cost of ESAs, iron, and dialysis sessions; and the proportion of patients on phosphate binder therapy. The model assumed equivalent efficacy and cost neutrality between FC and other phosphate binders. Monte Carlo simulations were conducted by varying model inputs.
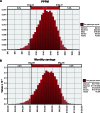
Results: When FC was compared to other phosphate binders, the monthly cost of ESA and IV iron per 500 patients with ESRD (85% treated with phosphate binders) was reduced by 8.15% and 33.2%, respectively. When incorporated into the total cost of dialysis for patients with ESRD (dialysis, ESA, and IV iron), the decrease in the monthly cost of dialysis care was US$80,214 per 500 ESRD patients. Monte Carlo simulations suggest that a plan serving 500 dialysis patients could save between US$626,000 and US$1,106,000 annually with the use of FC.
Conclusion: The use of FC in ESRD patients with hyperphosphatemia may help reduce treatment costs.
Keywords: dialysis; end-stage renal disease; hemodialysis; hyperphosphatemia; phosphate binders.
Figures


References
-
- United States Renal Data System The United States Renal Data System 2011 Annual Data Report: Atlas of End-Stage Renal Disease in the United States Minneapolis, MN: United States Renal Data System; 2011Available from http://www.usrds.org/atlas11.aspxAccessed May 15, 2011 - PubMed
-
- Rettig RA. Special treatment – the story of Medicare’s ESRD entitlement. N Engl J Med. 2011;364(7):596–598. - PubMed
-
- Centers for Medicare and Medicaid Services (CMS), HHS Medicare program; end-stage renal disease prospective payment system and quality incentive program; ambulance fee schedule; durable medical equipment; and competitive acquisition of certain durable medical equipment prosthetics, orthotics and supplies. Final rule. Fed Regist. 2011;76(218):70228–70316. - PubMed
-
- Kalantar-Zadeh K, Gutekunst L, Mehrotra R, et al. Understanding sources of dietary phosphorus in the treatment of patients with chronic kidney disease. Clin J Am Soc Nephrol. 2010;5(3):519–530. - PubMed
-
- Dusso A, González EA, Martin KJ. Vitamin D in chronic kidney disease. Best Pract Res Clin Endocrinol Metab. 2011;25(4):647–655. - PubMed
LinkOut - more resources
Full Text Sources
Other Literature Sources

