

Calcium activity of upper thoracic dorsal root ganglion neurons in zucker diabetic Fatty rats
- PMID: 23662103
- PMCID: PMC3639628
- DOI: 10.1155/2013/532850
Calcium activity of upper thoracic dorsal root ganglion neurons in zucker diabetic Fatty rats
Abstract
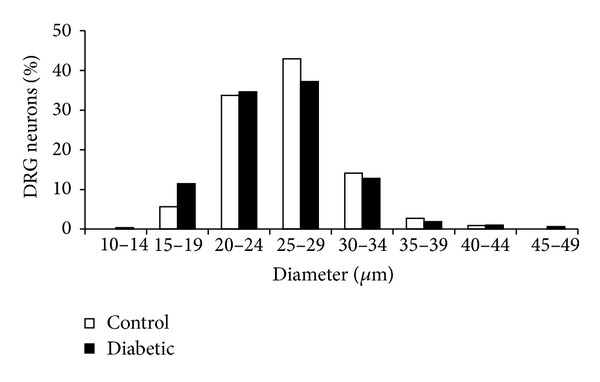
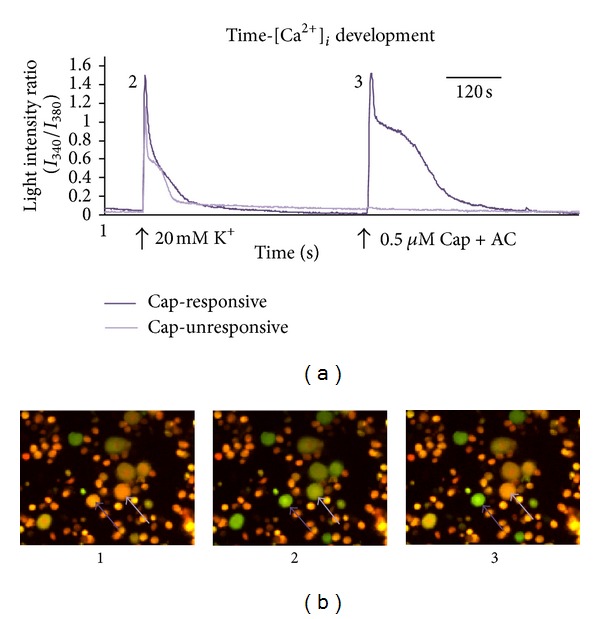
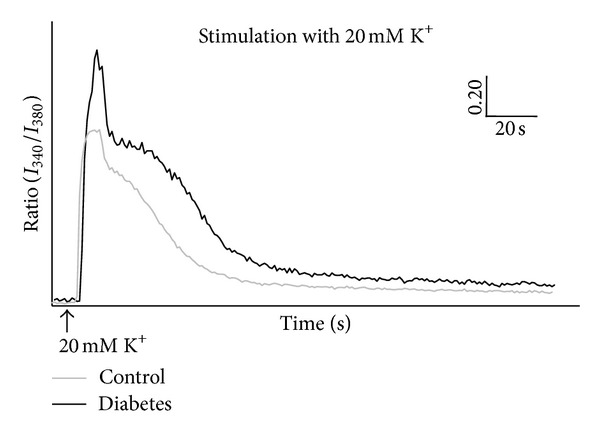
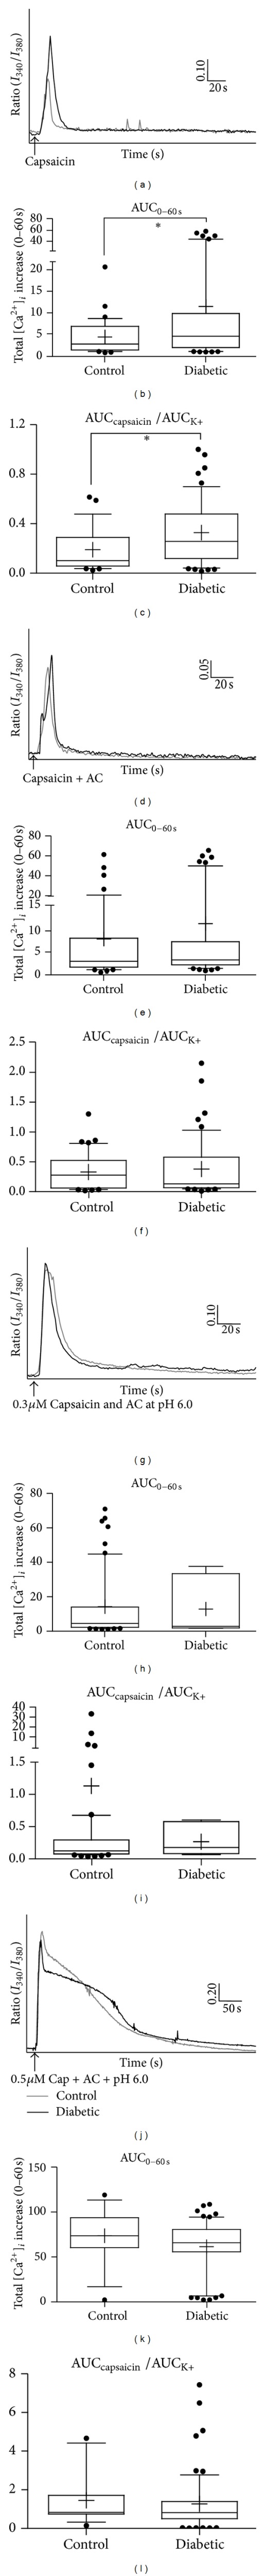
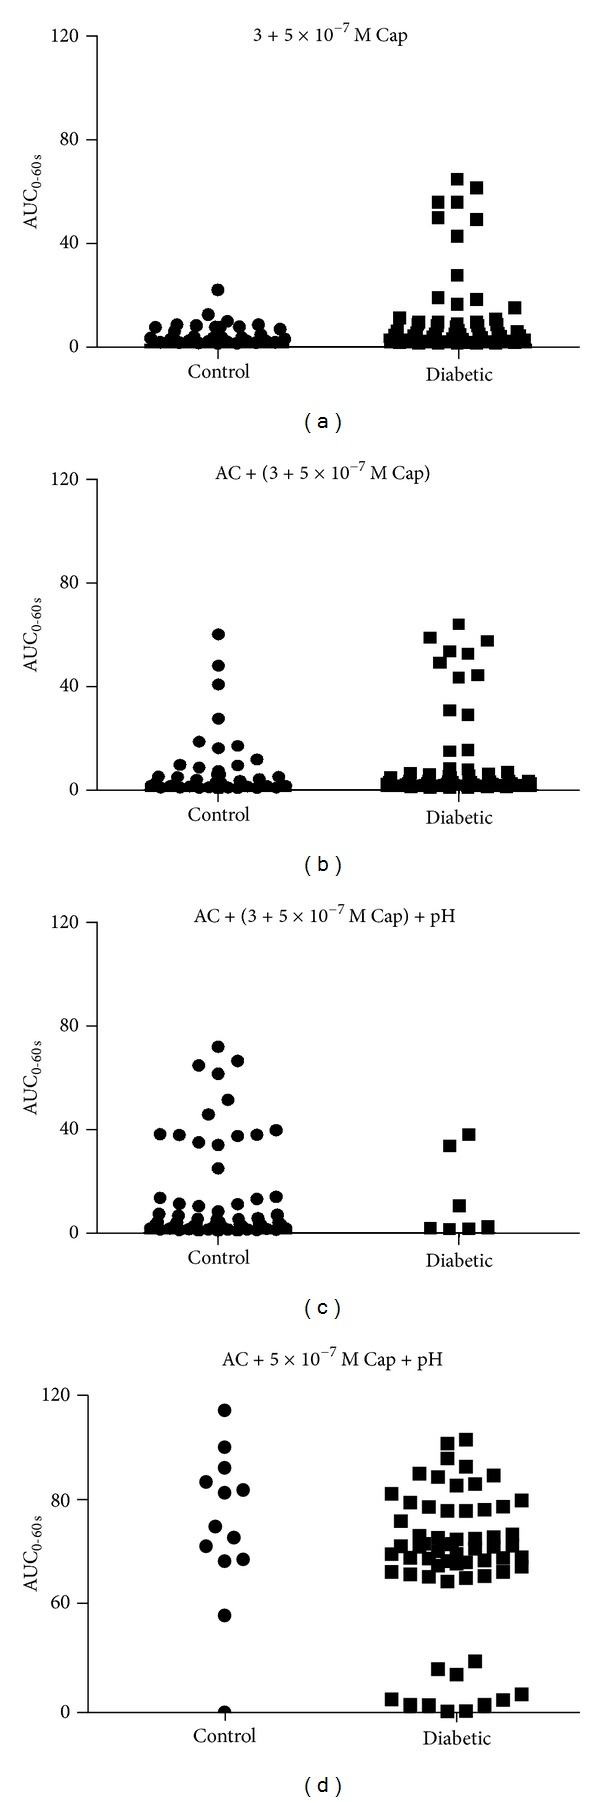
The aim of the present study was to examine the calcium activity of C8-T5 dorsal root ganglion (DRG) neurons from Zucker diabetic fatty rats. In total, 8 diabetic ZDF fatty animals and 8 age-matched control ZDF lean rats were employed in the study. C8-T5 dorsal root ganglia were isolated bilaterally from 14 to 18 weeks old rats, and a primary culture was prepared. Calcium activity was measured ratiometrically using the fluorescent Ca(2+)-indicator Fura-2 acetoxymethyl ester. All neurons were stimulated twice with 20 mM K(+), followed by stimulation with either 0.3 or 0.5 μ M Capsaicin, alone or in combination with algogenic chemicals (bradykinin, serotonin, prostaglandin E2 (all 10(-5) M), and adenosine (10(-3) M)) at pH 7.4 and 6.0. Neurons from diabetic animals exhibited an overall increased response to stimulation with 20 mM K(+) compared to neurons from control. Stimulation with Capsaicin alone caused an augmented response in neurons from diabetic animals compared to control animals. When stimulated with a combination of Capsaicin and algogenic chemicals, no differences between the two groups of neurons were measured, neither at pH 7.4 nor 6.0. In conclusion, diabetes-induced alterations in calcium activity of the DRG neurons were found, potentially indicating altered neuronal responses during myocardial ischemia.
Figures
Similar articles
-
A simple and fast method to image calcium activity of neurons from intact dorsal root ganglia using fluorescent chemical Ca2+ indicators.Mol Pain. 2017 Jan-Dec;13:1744806917748051. doi: 10.1177/1744806917748051. Epub 2017 Dec 6. Mol Pain. 2017. PMID: 29212403 Free PMC article.
-
Spinorphin inhibits membrane depolarization- and capsaicin-induced intracellular calcium signals in rat primary nociceptive dorsal root ganglion neurons in culture.J Recept Signal Transduct Res. 2015;35(6):550-8. doi: 10.3109/10799893.2015.1024850. Epub 2015 Jun 8. J Recept Signal Transduct Res. 2015. PMID: 26053512
-
Effects of capsaicin on Ca(2+) release from the intracellular Ca(2+) stores in the dorsal root ganglion cells of adult rats.Biochem Biophys Res Commun. 2001 Aug 3;285(5):1114-20. doi: 10.1006/bbrc.2001.5272. Biochem Biophys Res Commun. 2001. PMID: 11478769
-
Stimulation of cyclic GMP production via a nitrosyl factor in sensory neuronal cultures by algesic or inflammatory agents.J Neurochem. 1995 Jul;65(1):363-72. doi: 10.1046/j.1471-4159.1995.65010363.x. J Neurochem. 1995. PMID: 7790881
-
Inflammatory mediators release calcitonin gene-related peptide from dorsal root ganglion neurons of the rat.Neuroscience. 2000;98(1):135-40. doi: 10.1016/s0306-4522(00)00095-6. Neuroscience. 2000. PMID: 10858619
References
-
- International Diabetes Federation. Diabetes Atlas, 2011, http://www.idf.org/
-
- Alpert JS, Chipkin SR, Aronin N. Diabetes mellitus and silent myocardial ischemia. Advances in Cardiology. 1990;37:297–303. - PubMed
-
- Vinik AI, Erbas T, Pfeifer MA, Feldman EL, Stevens MJ, Russell JW. Diabetic autonomic neuropathy. In: Porte D, Sherwin RS, Baron A, editors. Ellenberg & Rifkin's Diabetes Mellitus. 6th edition. chapter 46. McGraw-Hill; 2003. pp. 789–804.
-
- Kahn CR, Weir GC, King GL, Jacobson AM, Moses AC, Smith RJ, editors. Joslin’s Diabetes Mellitus. 14th edition. Philadelphia, Pa, USA: Lippincott Williams & Wilkins; 2005.
-
- Vinik AI, Ziegler D. Diabetic cardiovascular autonomic neuropathy. Circulation. 2007;115(3):387–397. - PubMed
LinkOut - more resources
Full Text Sources
Other Literature Sources
Research Materials
Miscellaneous
