

Establishment and comparison of combining disease and syndrome model of asthma with "kidney yang deficiency" and "abnormal savda"
- PMID: 23662148
- PMCID: PMC3639643
- DOI: 10.1155/2013/658364
Establishment and comparison of combining disease and syndrome model of asthma with "kidney yang deficiency" and "abnormal savda"
Abstract
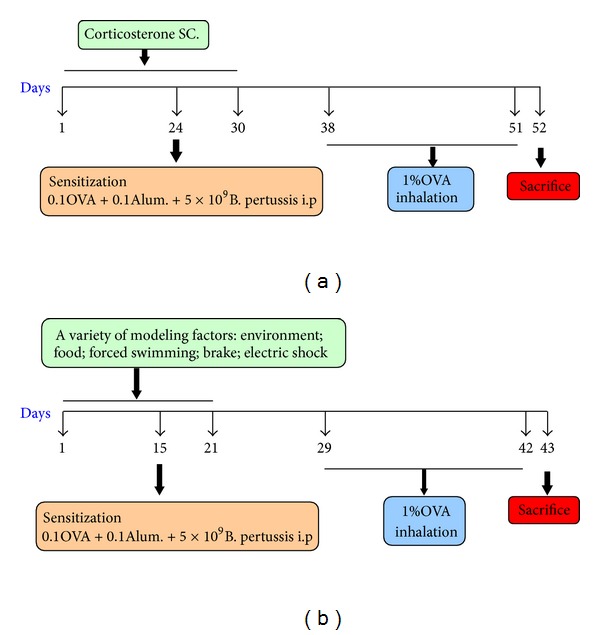
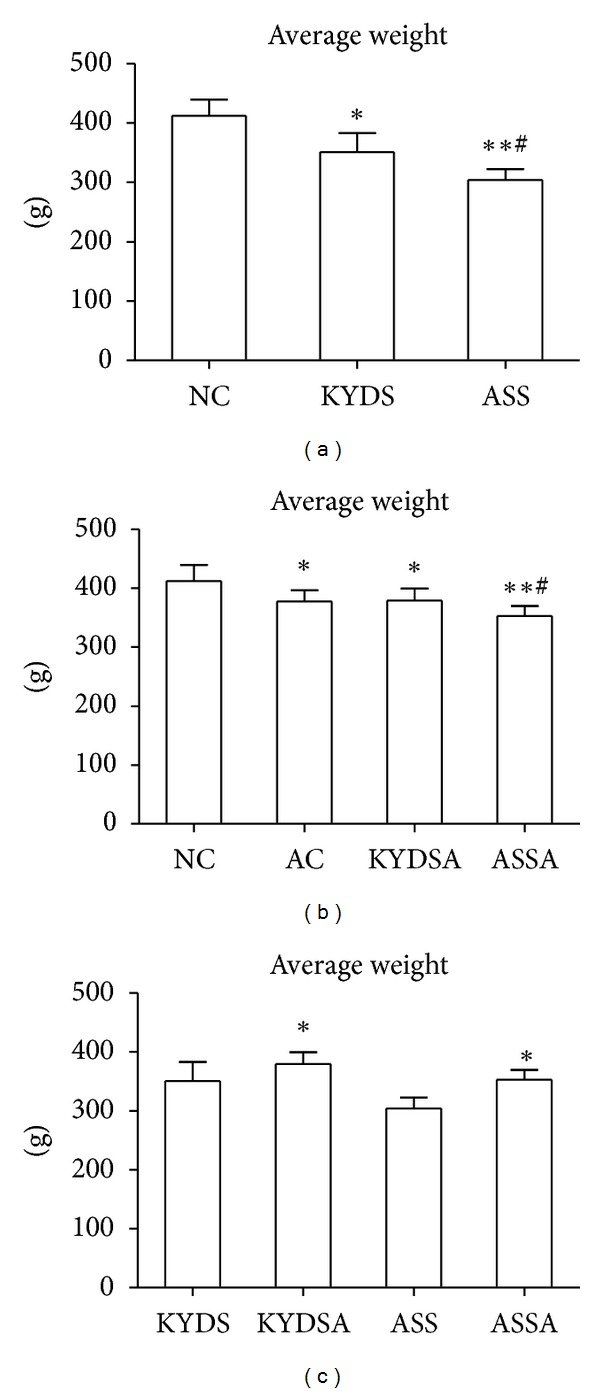
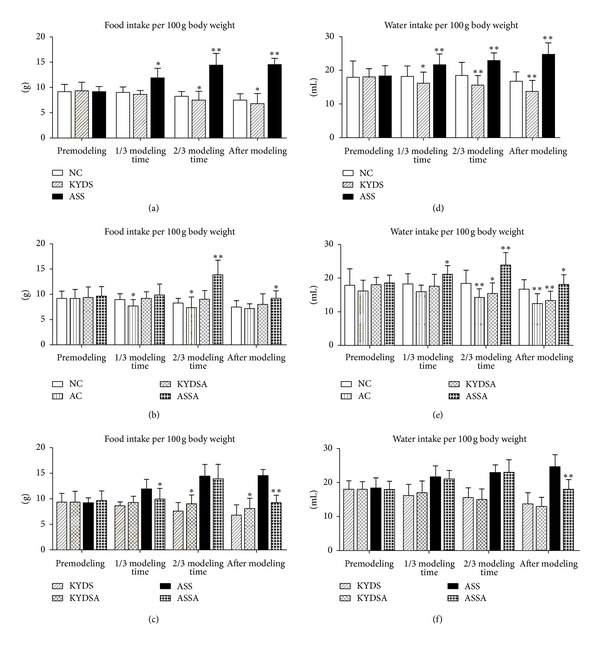
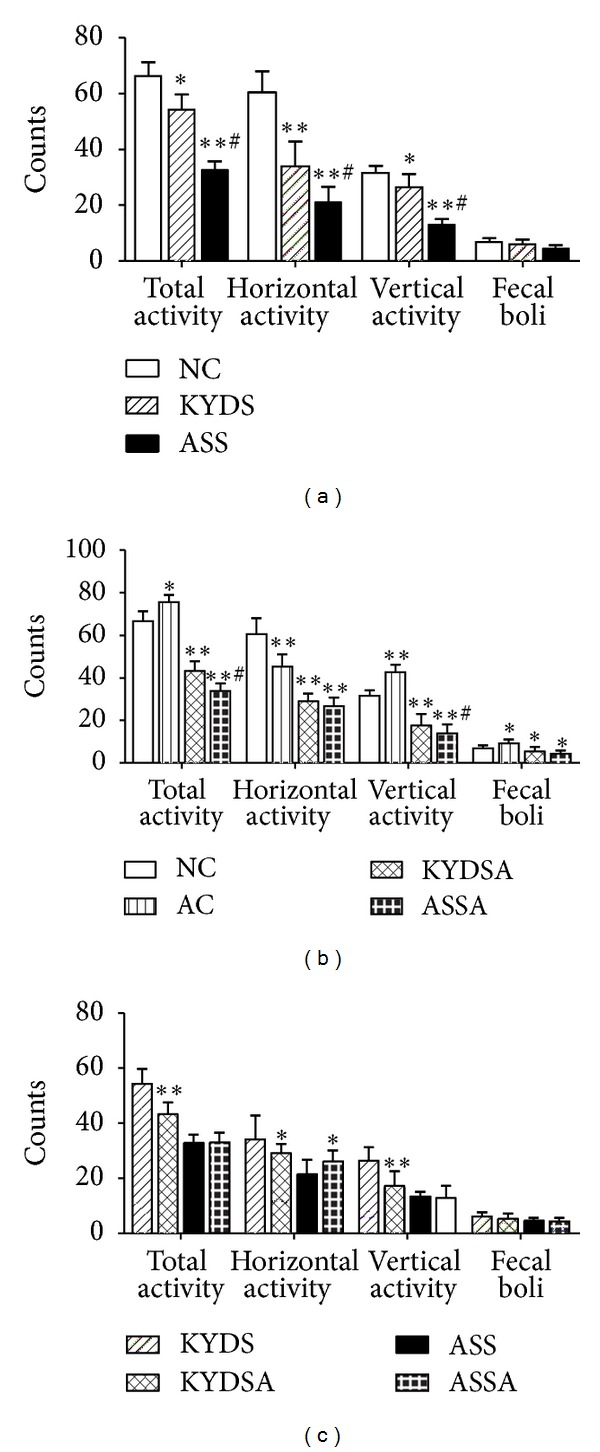
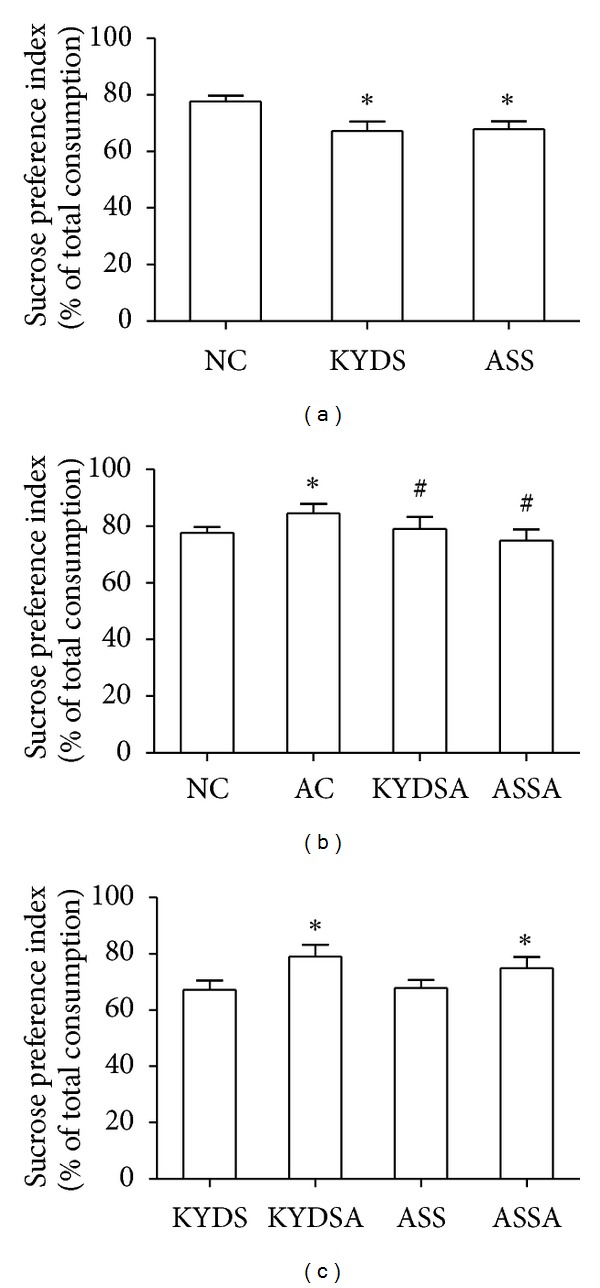
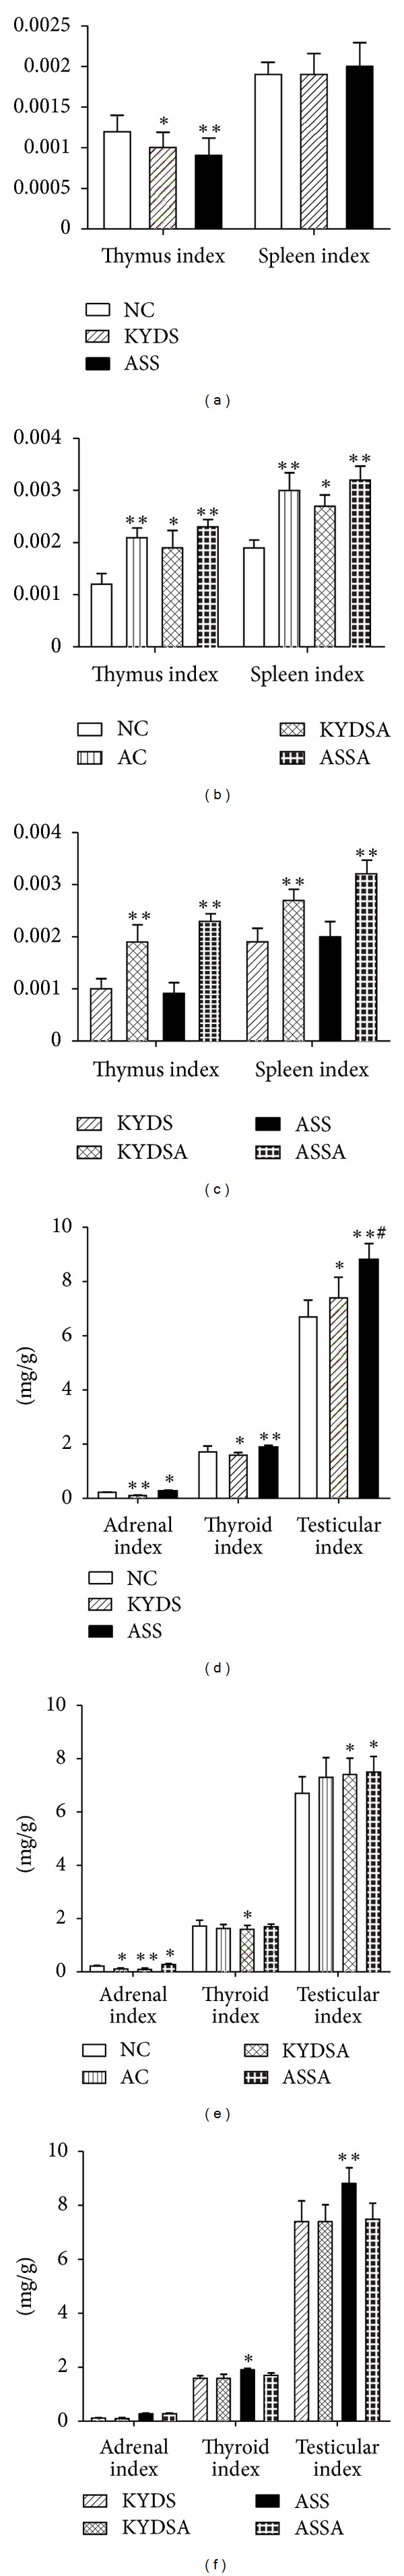
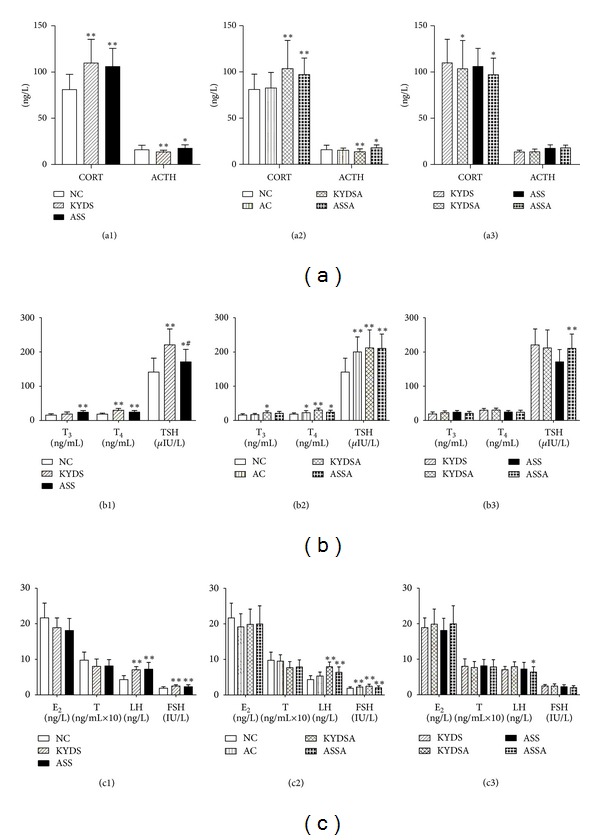
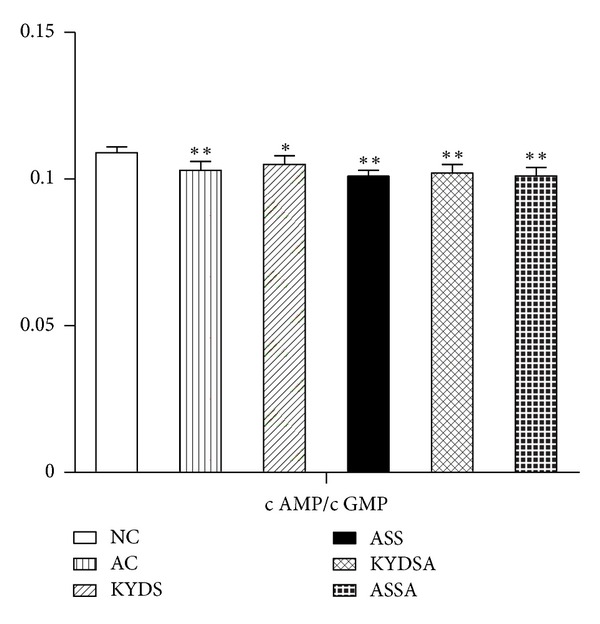
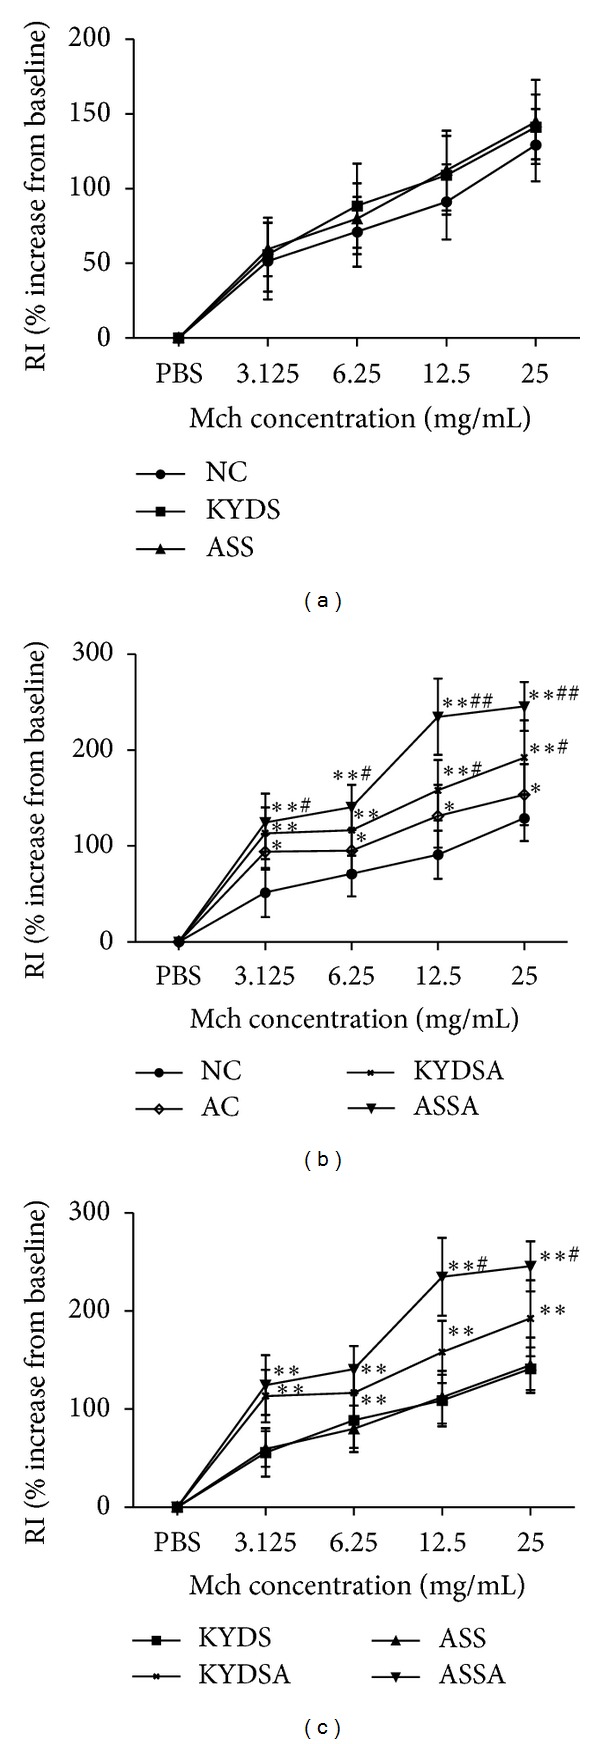
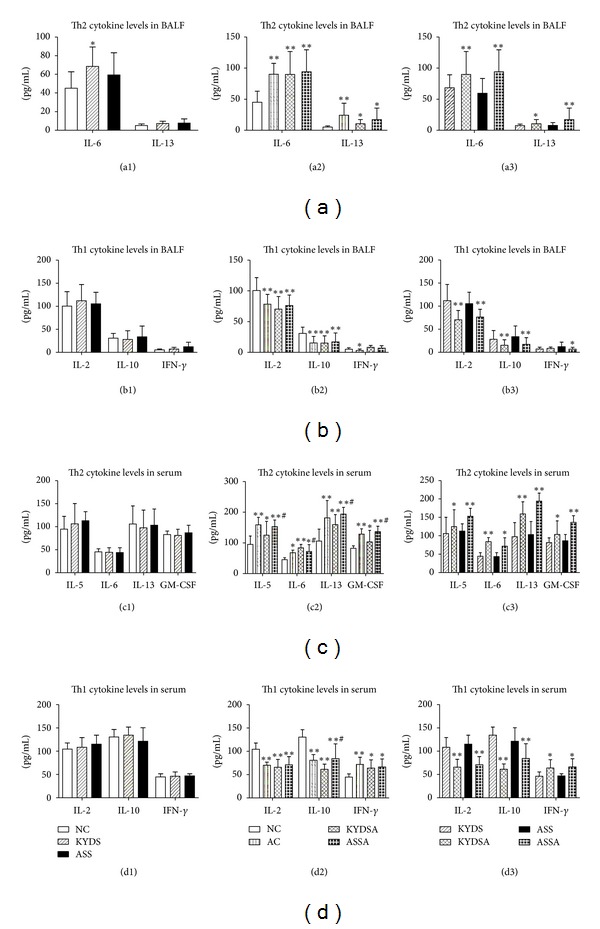
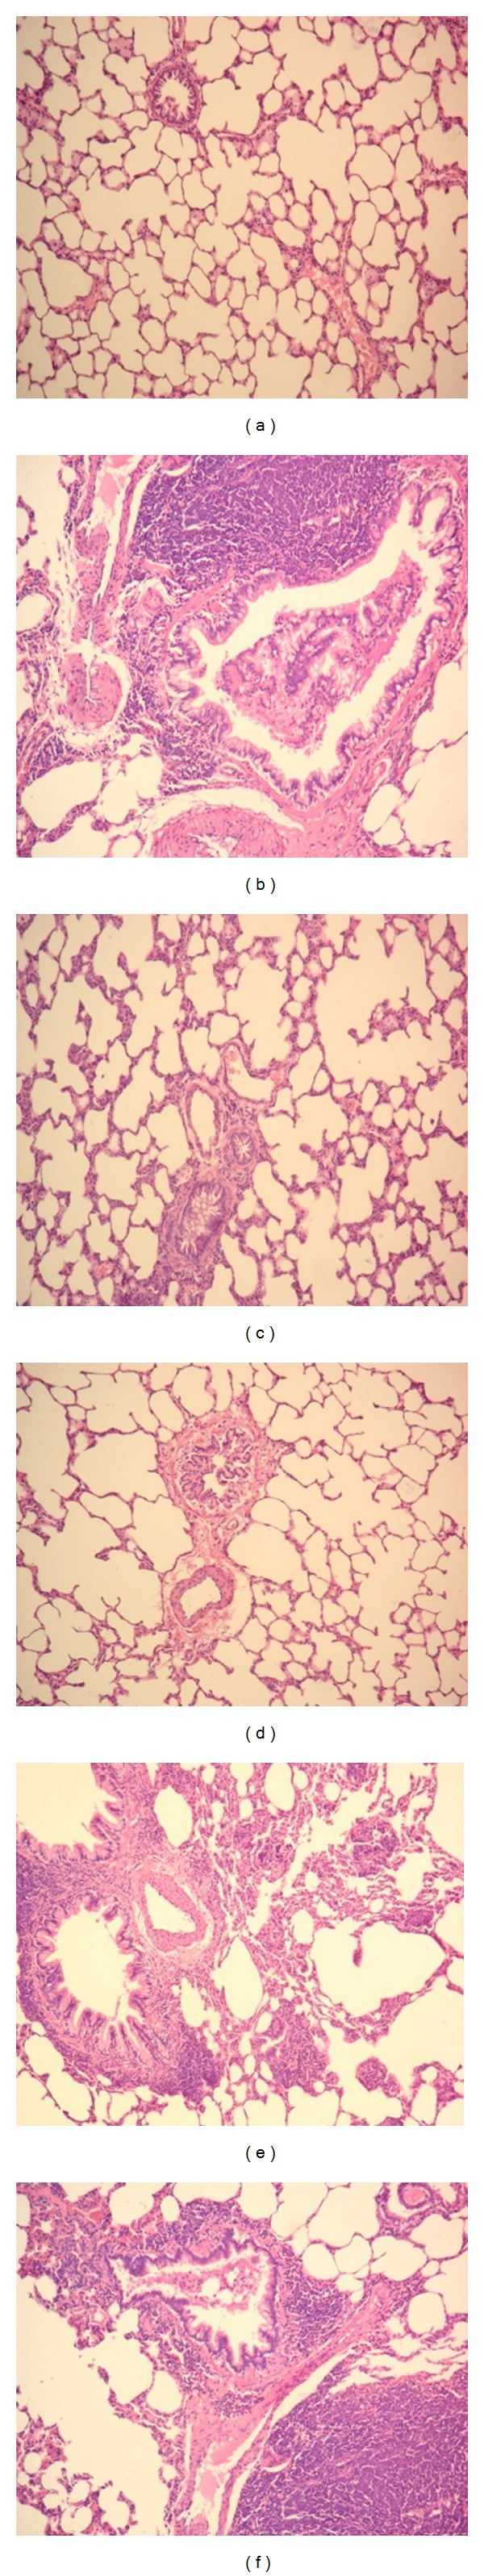
THE STUDY WAS THE FIRST TIME TO ESTABLISH AND COMPARE TWO RAT MODELS OF TWO COMMON SYNDROMES: Kidney Yang Deficiency syndrome (KYDS) in traditional Chinese medicine (TCM) and abnormal savda syndrome (ASS) in traditional Uighur medicine (TUM). Then, we also established and evaluated rat models of combining disease and syndrome models of asthma with KYDS or ASS. Results showed that usage of the high dose of corticosterone (CORT) injection or external factors could successfully establish the KYDS or ASS rat models, and the two models had similar changes in biological characterization, abnormal behaviors, dysfunction of hypothalamic-pituitary-target organ axes (HPTOA), and sympathetic/parasympathetic (S/P) nerve system but varied in different degrees. The rat models of combining disease and syndrome of asthma with KYDS or ASS had either pathological characteristics of asthma such as airway hyperresponsiveness (AHR), airway inflammation, airway remodeling, which were more serious than allergy exposure alone, or the syndrome performance of Kidney Yang Deficiency in TCM and abnormal savda in TUM. These findings provide a biological rationale for further investigation of combining disease and syndrome model of asthma as an effective animal model for exploring asthma based on the theory of traditional medicine.
Figures
Similar articles
-
Metabolic profiling reveals therapeutic biomarkers of processed Aconitum carmichaeli Debx in treating hydrocortisone induced kidney-yang deficiency syndrome rats.J Ethnopharmacol. 2014 Mar 28;152(3):585-93. doi: 10.1016/j.jep.2014.02.011. Epub 2014 Feb 17. J Ethnopharmacol. 2014. PMID: 24556226
-
[Chinmedomics strategy to discover effective constituents and elucidate action mechanism of Nanshi capsule against kidney-yang deficiency syndrome].Zhongguo Zhong Yao Za Zhi. 2016 Aug;41(15):2901-2914. doi: 10.4268/cjcmm20161526. Zhongguo Zhong Yao Za Zhi. 2016. PMID: 28914036 Chinese.
-
Study on the substance basis of the efficacy of eucommiae cortex before and after salt processing for the treatment of kidney-yang deficiency syndrome based on the spectrum-effect relationship.J Ethnopharmacol. 2024 Jan 10;318(Pt A):116926. doi: 10.1016/j.jep.2023.116926. Epub 2023 Jul 20. J Ethnopharmacol. 2024. PMID: 37479066
-
Clinical characteristics of abnormal savda syndrome type in human immunodeficiency virus infection and acquired immune deficiency syndrome patients: A cross-sectional investigation in Xinjiang, China.Chin J Integr Med. 2015 Dec;21(12):895-901. doi: 10.1007/s11655-015-2075-8. Epub 2015 Mar 6. Chin J Integr Med. 2015. PMID: 25749903
-
[Progress on the research of prevention and treatment of female climacteric syndrome by traditional Chinese medicine].Zhongguo Zhong Yao Za Zhi. 2005 Mar;30(6):414-8. Zhongguo Zhong Yao Za Zhi. 2005. PMID: 15810442 Review. Chinese.
Cited by
-
Thyroid Dysfunction, Neurological Disorder and Immunosuppression as the Consequences of Long-term Combined Stress.Sci Rep. 2018 Mar 14;8(1):4552. doi: 10.1038/s41598-018-19564-y. Sci Rep. 2018. PMID: 29540811 Free PMC article.
-
Therapeutic Effect of Ershen Pill () Extract on Pi (Spleen)-Shen (Kidney) Yang Deficiency-Induced Diarrhea in Rat Model.Chin J Integr Med. 2019 Jul;25(7):536-542. doi: 10.1007/s11655-017-2766-4. Epub 2018 Mar 21. Chin J Integr Med. 2019. PMID: 29564802
-
Metabolic differentiation and classification of abnormal Savda Munziq's pharmacodynamic role on rat models with different diseases by nuclear magnetic resonance-based metabonomics.Pharmacogn Mag. 2015 Oct-Dec;11(44):698-706. doi: 10.4103/0973-1296.165551. Pharmacogn Mag. 2015. PMID: 26600713 Free PMC article.
-
Effects of the combined extracts of Herba Epimedii and Fructus Ligustrilucidi on airway remodeling in the asthmatic rats with the treatment of budesonide.BMC Complement Altern Med. 2017 Aug 1;17(1):380. doi: 10.1186/s12906-017-1891-0. BMC Complement Altern Med. 2017. PMID: 28764781 Free PMC article.
-
High-throughput liquid chromatography mass-spectrometry-driven lipidomics discover metabolic biomarkers and pathways as promising targets to reveal the therapeutic effects of the Shenqi pill.RSC Adv. 2020 Jan 13;10(4):2347-2358. doi: 10.1039/c9ra07621b. eCollection 2020 Jan 8. RSC Adv. 2020. PMID: 35494613 Free PMC article.
References
-
- Braman SS. The global burden of asthma. Chest. 2006;130(1, supplement):4S–12S. - PubMed
-
- Ozdoganoglu T, Songu M. The burden of allergic rhinitis and asthma. Therapeutic Advances in Respiratory Disease. 2012;6(1):11–23. - PubMed
-
- Bateman ED, Hurd SS, Barnes PJ, et al. Global strategy for asthma management and prevention: GINA executive summary. European Respiratory Journal. 2008;31(1):143–178. - PubMed
-
- Tattersfield AE, Knox AJ, Britton JR, Hall IP. Asthma. The Lancet. 2002;360(9342):1313–1322. - PubMed
LinkOut - more resources
Full Text Sources
Other Literature Sources
Research Materials
Miscellaneous
