. 2013 May 9;153(4):759-72.
doi: 10.1016/j.cell.2013.04.030.

Reprogramming the maternal zebrafish genome after fertilization to match the paternal methylation pattern

Affiliations

Reprogramming the maternal zebrafish genome after fertilization to match the paternal methylation pattern

Magdalena E Potok et al. Cell. .

Abstract

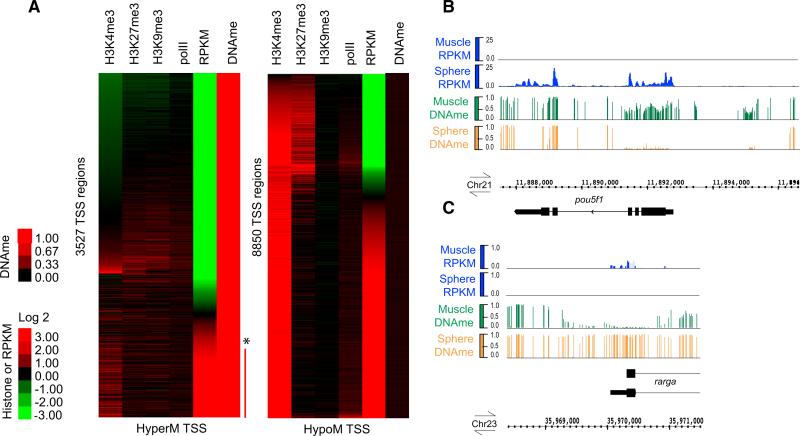
Early vertebrate embryos must achieve totipotency and prepare for zygotic genome activation (ZGA). To understand this process, we determined the DNA methylation (DNAme) profiles of zebrafish gametes, embryos at different stages, and somatic muscle and compared them to gene activity and histone modifications. Sperm chromatin patterns are virtually identical to those at ZGA. Unexpectedly, the DNA of many oocyte genes important for germline functions (i.e., piwil1) or early development (i.e., hox genes) is methylated, but the loci are demethylated during zygotic cleavage stages to precisely the state observed in sperm, even in parthenogenetic embryos lacking a replicating paternal genome. Furthermore, this cohort constitutes the genes and loci that acquire DNAme during development (i.e., ZGA to muscle). Finally, DNA methyltransferase inhibition experiments suggest that DNAme silences particular gene and chromatin cohorts at ZGA, preventing their precocious expression. Thus, zebrafish achieve a totipotent chromatin state at ZGA through paternal genome competency and maternal genome DNAme reprogramming.


Figures

Figure 1
Figure 1. DNAme Features of the Zebrafish Genome
(A) Zebrafish display modest CpG depletion relative to mammals. Observed and expected CpG fractions are displayed. (B) Zebrafish CGIs (zCGIs, UCSC) have extremely high obs/exp CpG frequencies. (C) Reciprocity of zCGIs and repeat types at TSS regions. Distribution of repeats and zCGIs plotted over TSS regions (±2 kb) of protein-coding genes (Ensembl, defined). (D) In zebrafish, fewer gene TSS regions (±250 bp) intersect with CGIs than in mammals. (E) Bulk DNAme levels: all mCG instances over all cytosines sequenced (C+mC). Bulk DNAme levels in oocyte and early embryos are greatly influenced due to the abundance of mitochondrial DNA (chrM), which we find unmethylated. In silico removal of chrM, left. Schematic of stages used in the experiment is shown on the bottom. (F) Regional methylation differences across development reflect bulk methylation changes. DNAme regions (≥ bp, ≥CpGs/region, with a minimum of five reads per CpG) were parsed into HypoM <0.2, PM ≥0.2 to ≤0.8, and HyperM ≥ 0.8. Note the high numbers of PM regions in oocyte and early embryos but exceptionally few in sperm and sphere. See also Figure S1 and Tables S1, S2, and S7 for (A)–(D) and Figure S3 for (F).
Figure 2
Figure 2. DNA Methylation Dynamics at TSS Regions
(A) Four distinctive cohorts in regard to DNAme at TSS regions. k-means clustering (k = 4) of DNAme (mean fraction CG methylation, TSS ± 250 bp). (B–F) Class average DNAme plots were generated on TSS (±2 kb) for gene classes as defined by GO terms or those containing zCGIs. (G) Obs/exp frequency was calculated for each TSS cluster in (A). (H–L) Snapshots visualized on Integrated Genome Browser (IGB) for dnmt6, dnmt3, hoxd cluster, dazl, gata1a, and sox10 (DNAme scale: 0 to 1, mean base fraction CG methylation). See also Figure S6 and Tables S2, S4, S5 and S7.
Figure 3
Figure 3. Maternal DMRs Resolve to Resemble Paternal Status by Sphere Stage
(A) Pairwise comparisons between developmental stages (summed) yielded differentially methylated regions (DMRs, 500 bp windows, ≥5 CpG, ≥5 reads per C; criteria, FDR R 0.001 and absolute log2Ratio ≥ 1.5, >20% change in fraction methylation). Combined unique regions were scored for mean fraction CG methylation across developmental stages and clustered (k-means, k = 9).(B) DMR locations were intersected with annotations (Ensembl). (C) Obs/exp frequency was calculated for each DMR cluster from (A). (D) DNAme reprogramming of the maternal genome occurs in maternal haploids. Assessment of whether DNAme reprogramming in early embryos relies on the continued presence of the paternal genome. The experimental setup (left) compares two types of sphere-stage embryos: (1) maternal/paternal diploid embryos derived from IVF (top) of wild-type oocytes and sperm containing a known mutation in the golden allele (gol b1, marking the paternal genome, yellow color), and (2) maternal haploid embryos derived from IVF of wild-type oocytes and UV-treated (yellow bolt, bottom) sperm from golden males, providing extensive DNA damage and rendering the genome incompetent for replication, rendering a sphere-stage embryo with only maternal DNA (red nucleus in outset). DNA was isolated from sphere-stage IVF embryos, and DNAme levels (mean fraction CG methylation) were assessed at each of 15 promoter regions (krt4, krt8, dnmt6, rarga, zgc:92231, zgc:101640, cpn1 hoxb1a, hoxb3a, pou5f1, dazl, vasa, irx3a, ntl, and dnmt3) using bisulfite sequencing of promoter amplicons in a high-throughput format (right). Here, the order of the genes at right (top to bottom) aligns with the order of the bars in the figure (left to right). Promoters representing sperm DMRs are depicted in red, and oocyte DMRs are depicted in blue. For comparisons, DNAme levels (mean fraction CG methylation) of these same 15 promoters from sperm, oocytes, and normal diploid sphere-stage embryos (converted from our genome-wide data) are provided. See also Figures 4, S6, and S7 and Tables S4 and S7.
Figure 4
Figure 4. Relationship of DNAme and Histone Modifications at the TSS to Gene Expression during Sphere/PostMBT
(A) TSS regions (±250bp) at sphere stage were separated into two groups based on their methylation status: either HyperM ≥ 0.8 or HypoM ≤ 0.2 (mean fraction CG methylation, scale 0 to 1) (note: TSSs with partial methylation are extremely rare at sphere). They were then subjected to separate k-means clustering with data sets for histone modifications and gene expression levels. Promoter histone modification status (mean log 2 ratio, array data; [Lindeman et al., 2011]) only available just after sphere/MBT (50% epiboly, 5.3 hpf). Gene expression RPKM levels (first exon, log 2 converted) from our total RNA-seq at sphere stage. Red bar and asterisk indicate loci with high DNAme and high RPKM, which are “false positives”as they mostly represent alternative or incorrectly annotated TSS with high DNAme (see Resultsand Supplemental Information). (B and C) Example of developmentally regulated DNA demethylation or remethylation at the TSS upon differentiation into muscle with correlated gene expression. Browser snapshots of mean base fraction CG methylation tracks (scale 0 to 1) and relative RPKM values obtained from RNA-seq on total RNA from sphere stage (4 hpf) and adult muscle visualized on Integrated Genome Browser (IGB) for pou5f1 (RPKM scale 0–25) and rarga (RPKM scale 0 to 1). See also Table S7 for (A) and Figure S5 and Tables S5 and S7 for (B) and (C).
Figure 5
Figure 5. Relationship of DNAme Status to Histone Modifications across Development
(A) Epigenetic features at TSS regions (±250 bp). Histone modifications (mean log 2 ratio, scale –1.5 to 1.5, array data: sperm [Wu et al., 2011a]; preZGA (2.5 hpf), ZGA (3.3 hpf), and postZGA (5.3 hpf) [Lindeman et al., 2011]). DNAme: mean faction CG methylation at sperm and sphere stage, with k-means clustering analysis. (B) Snapshots of the krt4 gene, as an example of a gene from cluster 7 whose expression is highly upregulated by 5-Aza-CyD treatment. DNAme (mean base fraction CG methylation, scale 0 to 1), gene expression (RPKM, scale 0–25, from RNA-seq of total RNA), histone modifications (probe log 2 ratio, scale 0–1.5 at postMBT; [Lindeman et al., 2011]) visualized on IGB. See also Tables S6 and S7.
Figure 6
Figure 6. Model Depicting the Logic of DNAme Reprogramming, ZGA Totipotency, and Differentiation
(A) Oocyte DMRs are those bearing DNAme in oocyte, not sperm; these resolve to an unmethylated status and include key germline factors and early transcription factors. Sperm DMRs are those bearing DNAme in sperm, but not the oocyte; these resolve to a methylated status and include factors needed in mid/late embryo development. (B) A logic is presented for the DNAme behavior of gene categories. Factors involved in germ layer specification/gastrulation are designated as “early,” progenitor cells of various stages are considered to be expressed at “mid” stages, and factors involved in terminal differentiation are considered “late.” Expression timing obtained from public sources (http://ZFIN.org). At ZGA/sphere, the DNAme status is consistent with totipotency and germline specification, as transcription factors and germline specification factors needed before or during gastrulation are DNA HypoM (green). Transcription factors utilized during mid/late embryo development can either be HypoM or HyperM (red). Importantly, a set of key factors needed in the early embryo for transcription or germline specification is HyperM in the oocyte, but not the sperm, and transition to demethylation in the embryo prior to ZGA (red to green, transition). Other aspects of these categories and their dynamics are self-evident or are described in the Results.

Comment in

References

    1. Almeida RD, Loose M, Sottile V, Matsa E, Denning C, Young L, Johnson AD, Gering M, Ruzov A. 5-hydroxymethyl-cytosine enrichment of non-committed cells is not a universal feature of vertebrate development. Epigenetics. 2012;7:383–389. - PubMed
    1. Andersen IS, Reiner AH, Aanes H, Aleström P, Collas P. Developmental features of DNA methylation during activation of the embryonic zebrafish genome. Genome Biol. 2012;13:R65. - PMC - PubMed
    1. Arpanahi A, Brinkworth M, Iles D, Krawetz SA, Paradowska A, Platts AE, Saida M, Steger K, Tedder P, Miller D. Endonuclease-sensitive regions of human spermatozoal chromatin are highly enriched in promoter and CTCF binding sequences. Genome Res. 2009;19:1338–1349. - PMC - PubMed
    1. Bogdanovic O, Long SW, van Heeringen SJ, Brinkman AB, Gómez-Skarmeta JL, Stunnenberg HG, Jones PL, Veenstra GJ. Temporal uncoupling of the DNA methylome and transcriptional repression during embryogenesis. Genome Res. 2011;21:1313–1327. - PMC - PubMed
    1. Bogdanovic O, Fernandez-Miñán A, Tena JJ, de la Calle-Mustienes E, Hidalgo C, van Kruysbergen I, van Heeringen SJ, Veenstra GJ, Gómez-Skarmeta JL. Dynamics of enhancer chromatin signatures mark the transition from pluripotency to cell specification during embryogenesis. Genome Res. 2012;22:2043–2053. - PMC - PubMed

Publication types