. 2013 May 7;104(9):2077-88.
doi: 10.1016/j.bpj.2013.03.025.

Mitochondrial localization and the persistent migration of epithelial cancer cells

Affiliations

Mitochondrial localization and the persistent migration of epithelial cancer cells

Salil P Desai et al. Biophys J. .

Abstract

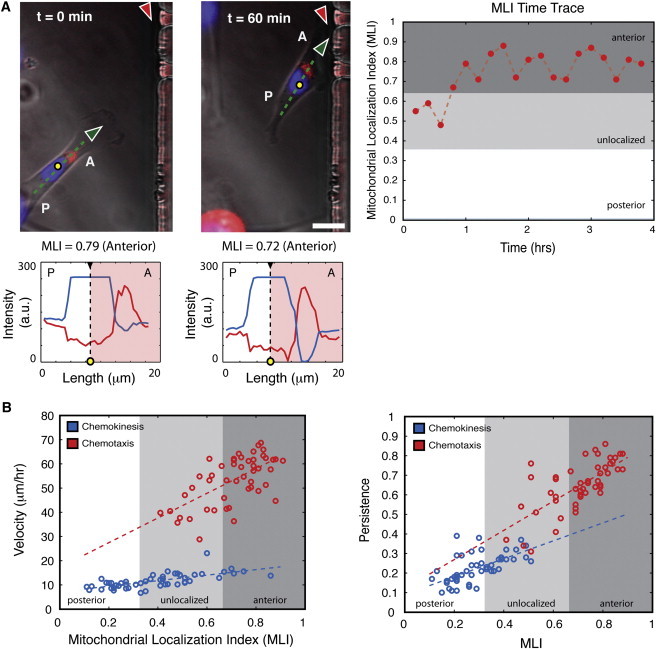
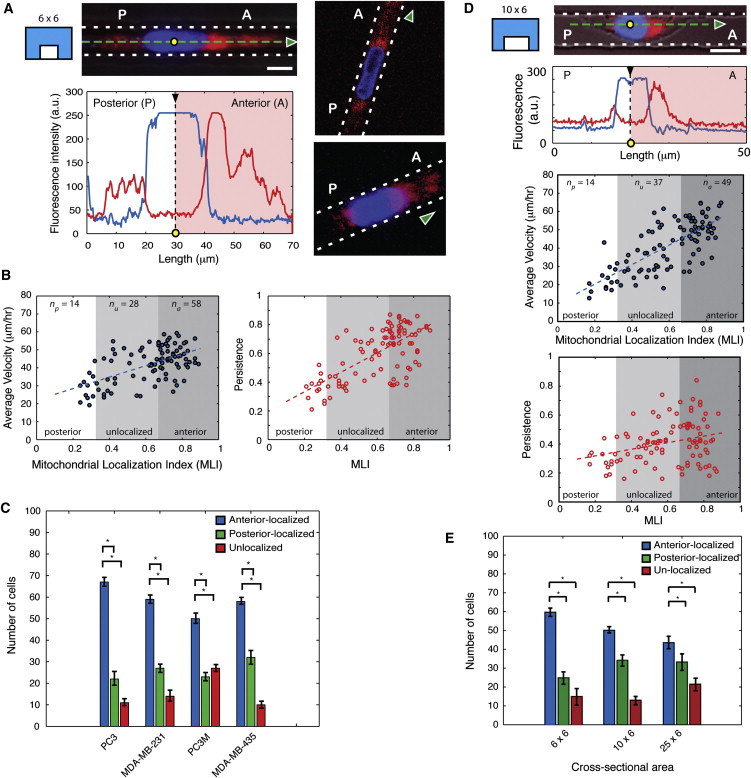
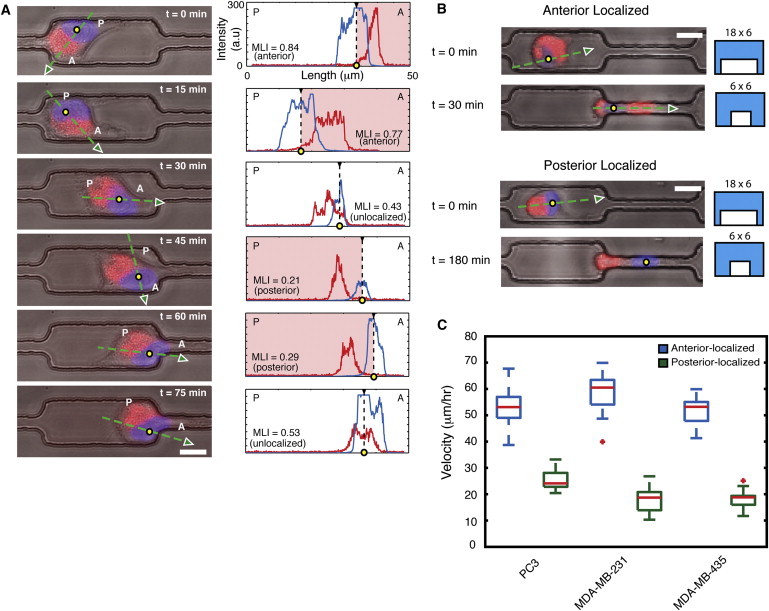
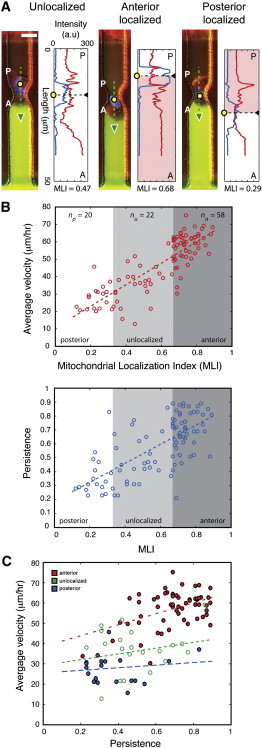
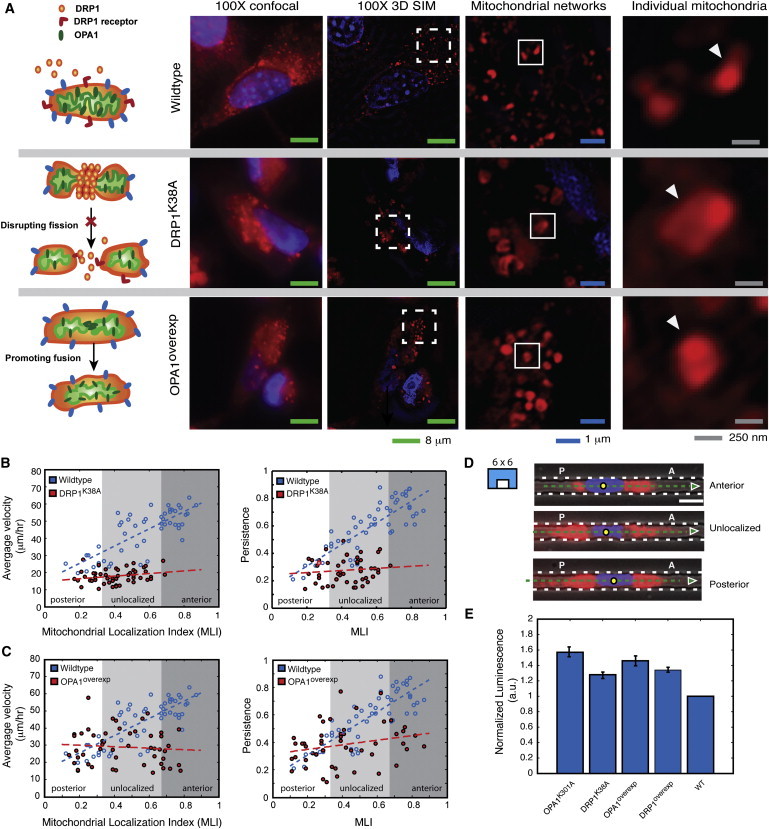
During cancer cell invasion, faster moving cancer cells play a dominant role by invading further and metastasizing earlier. Despite the importance of these outlier cells, the source of heterogeneity in their migratory behavior remains poorly understood. Here, we show that anterior localization of mitochondria, in between the nucleus and the leading edge of migrating epithelial cancer cells, correlates with faster migration velocities and increased directional persistence. The asymmetry of mitochondrial localization along the axis of migration is absent during spontaneous cell migration on two-dimensional surfaces and only occurs in the presence of chemical attractant cues or in conditions of mechanical confinement. Moreover, perturbing the asymmetric distribution of mitochondria within migrating cells by interfering with mitochondrial fusion (opa-1) or fission (drp-1) proteins, significantly reduces the number of cells with anterior localization of mitochondria and significantly decreases the velocity and directional persistence of the fastest moving cells. We also observed similar changes after perturbing the linkage between mitochondria and microtubules by the knockdown of mitochondrial rhoGTPase-1 (miro-1). Taken together, the changes in migration velocity and directional persistence in cells with anterior-localized mitochondria could account for an order of magnitude differences in invasive abilities between cells from otherwise homogenous cell populations.


Figures

Figure 1
Figure 1
Mitochondrial localization during the spontaneous migration of the epithelial cancer cell in unconstrained environments. (A) Composite image of a single breast cancer cell (MDA-MB-231) with outlines/centroids showing the time course of unconstrained, spontaneous migration on a two-dimensional surface. Yellow dots indicate centroids and green arrowheads indicate direction of migration. P and A denote posterior and anterior regions of a migrating cell, respectively. Scale bar 10 μm. Line scans (green dashed line) show snapshot of localization (plot) with mitochondrial (red) and nuclear (blue) fluorescence intensities with mitochondria localized anterior to the nucleus. (B) Single cells from representative time points showing varying mitochondrial localizations. Scale bar 15 μm. (C) Left panel, time trace of instantaneous MLI (red line trace) of a single cell and average MLI (0.61) shown as a dashed line. Right panel, vector map of single cell traveling between nuclear centroid positions (yellow dots). Distances traversed between time points are labeled as dtime point. Dashed red line labeled T denotes shortest distance between start and end positions.
Figure 2
Figure 2
Mitochondrial localization during the migration of the epithelial cancer cell in unconstrained environments in the presence of biochemical gradients. (A) Image of a single breast cancer cell showing distinct anterior localization in a gradient (red arrowheads show location of chemokine source). Yellow dots indicate centroids and green arrowheads indicate direction of migration. Anterior and posterior regions are denoted as A and P. Scale bar 10 μm. Lower panel shows line scans of fluorescence (along dashed green line) indicating anterior localizations. Right panel shows a representative time trace of MLI showing a transient before the cell settles into a sustained anterior localization of mitochondria. (B) During unconstrained migration in the presence of biochemical gradients significant correlations exist between MLI and velocity (m = 0.64, R2 = 0.40), and between MLI and persistence (m = 0.75, R2 = 0.49). During spontaneous, unconstrained migration in the absence of gradients the correlations between MLI and average velocity (left panel, blue dashed line, m = 0.14, R2 = 0.47) and persistence (right panel, blue dashed line, m = 0.45, R2 = 0.38).
Figure 3
Figure 3
Mitochondrial localization during the migration of the epithelial cancer cell in constrained environments. (A) Representative fluorescence image showing breast cancer cell migrating through a 6 × 6 μm cross-section channel with anterior-localized mitochondria. Anterior and posterior regions are denoted as A and P. Dashed green line indicates region of fluorescence line scan, yellow dot indicates centroid, green arrowhead direction of migration, and dashed white lines the sidewalls of the channel. Scale bar 8 μm. Right panels show representative confocal images showing three-dimensional organization of mitochondria. Similarly, arrowheads indicate direction of migration and dashed white lines the sidewalls of channels. (B) Correlation of 100 single cells migrating in 6 × 6 μm cross-section channels indicate distinct relationships between MLI and migration velocity (blue circles, rv = 0.66), and between MLI and persistence (red circles, rp = 0.58). Least-squares fits for velocity (m = 0.4, R2 = 0.43) and persistence (m = 0.66, R2 = 0.34) are indicated by blue and red dashed lines, respectively. (C) Binning of localizations across 4 epithelial cell types with a predominant number of cells anterior-localized (PC3, PC3M, MDA-MB-231, and MDA-MB-435), symbols designate statistically significant differences (p < 0.05). (D) Representative image of anterior localized cells in 6 × 10 μm cross-section channel, yellow dot indicates centroid and green arrowhead the direction of migration. Dashed white lines indicate the sidewalls of the channel. Scale bar 10 μm. Line scans of fluorescence (taken along green dashed) show anterior localization of mitochondria. Scatter plots (lower panels) suggest stronger correlations between MLI and average velocity (blue circles, rv = 0.74) and weaker correlations between MLI and persistence (red circles, rp = 0.29). Least-squares fits for velocity (m = 0.66, R2 = 0.55) and persistence (m = 0.23, R2 = 0.08) are indicated by blue and red dashed lines, respectively. (E) Bar plots showing decreasing number of anterior-localized cells with increasing channel cross-sectional area (ranging from 6 × 6 to 25 × 6 μm cross-section channels). Similarly, symbols designate statistically significant differences (p < 0.05).
Figure 4
Figure 4
Mitochondrial relocalization during the migration of the cancer cell in variegated mechanical confinements. (A) Time series of a single breast cancer epithelial cell relocalizing mitochondria in a larger chamber. Dashed green line indicates region of fluorescence line scan, yellow dot indicates centroid, and green arrowhead direction of migration. Anterior and posterior regions of the cell are denoted as A and P. Localizations cycle through anterior, unlocalized to posterior, with the cell remaining stuck in the constriction and unable to continue migrating. Scale bar 10 μm. (B) Representative composite fluorescence and bright field images of anterior- and posterior-localized cells traversing channels of a varying cross section. Scale bar 12 μm. (C) Quantification of average cell velocity of three different epithelial cancer cell lineages (PC3, MDA-MB-231, and MDA-MB-435) cells with anterior- and posterior-localization traversing such variegated confinements.
Figure 5
Figure 5
Mitochondrial localization with superimposed mechanical and chemical cues. (A) Representative images of anterior-, posterior-, and unlocalized cells migrating in channels with superimposed biochemical gradients of EGF (green fluorescence). Yellow dots indicate centroids of cells and green arrowheads direction of migration. Anterior and posterior regions are denoted as A and P. Corresponding line scans (green dashed line) show traces of mitochondrial (red) and nuclear (blue) fluorescence intensities. Scale bar 20 μm. (B) Cells migrating in response to growth factor gradients show strong relationships between migration velocity and MLI (rv= 0.83) and also with MLI and persistence (rp= 0.70). Linear least-squares fits for velocity (m = 0.77, R2 = 0.69) and persistence (m = 0.68, R2 = 0.49) are indicated by red and blue dashed lines, respectively. (C) Correlation between velocity and persistence shows a distinct clustering of high velocity and high persistent cells, which are anterior-localized (red circles) as compared to posterior-localized (blue circles), and unlocalized (green circles) cells that have low velocity and low persistence. Least-squares fits for anterior-localized (m = 0.34, R2 = 0.21), unlocalized (m = 0.17, R2 = 0.04), and posterior-localized (m = 0.08, R2 = 0.02) cells are indicated by red, green, and blue dashed lines, respectively.
Figure 6
Figure 6
Interfering with mitochondrial shape dynamics alter mitochondrial localization and the migration of cancer cells in constrained environments. (A) Schematic depicting role of drp-1 and opa-1 proteins in mitochondrial shape dynamics. Drp-1 dimerizes and forms constructs that are responsible in breaking mitochondria apart and thereby enabling the cell to redistribute mitochondria and better meet energy requirements during events of high bioenergetic need. Conversely, opa-1 fuses the inner membranes of the mitochondria and serves as a binding protein to fuse distinct mitochondria into larger entities. Super-resolution images of representative WT and mutant cells show that drp-1 mutants and opa-1 overexpression result in significantly larger mitochondria than WT cells. Both images of mitochondrial networks (middle panels) and individual mitochondria (right panels, highlighted with white arrowheads) show evidence of this. (B) Breakdown in correlation between the velocity of migration and MLI can be calculated in DRP1K38A mutants (red circles, rv= 0.24 compared to WT cells (blue circles, rv= 0.78). Similarly, a breakdown in correlation between the persistence of migration and MLI can be calculated in DRP1K38A mutants (red circles, rp= 0.11) compared to WT cells (blue circles, rp = 0.82), suggesting a strong role for anterior localization of mitochondria in epithelial cancer cell migration. Least-squares fits for mutants show near independence of migration velocity (dashed red line, m = 0.09, R2 = 0.06) and persistence (dashed red line, m = 0.07, R2 = 0.01) with MLI, compared to WT cells that display strong correlations of velocity (dashed blue line, m = 0.63, R2 = 0.61) and persistence (dashed blue line, m = 0.79, R2 = 0.68) with MLI. (C) Analysis of the average velocity, persistence for OPA1overexp mutants migrating through 6 × 6 μm cross-section channels also reveals independence between velocity, persistence, and MLI. Least-squares fits for mutants show near independence of migration velocity (dashed red line, m=0.05, R2 = 0.01) and persistence (dashed red line, m = 0.17, R2 = 0.05). Plots and least-squares fits for WT cells (blue circles and dashed lines, respectively) are identical to those in (B). (D) Representative fluorescence images showing DRP1K38A breast cancer cells migrating through 6 × 6 μm cross-section channels showing canonical localizations of mitochondria. Arrowheads indicate the direction of migration and yellow dots the cell centroid. Anterior and posterior regions are denoted as A and P. Scale bar 8 μm. (E) ATP assays show that both mutant and WT cells are bioenergetically similar.
Figure 7
Figure 7
Interfering with mitochondria-microtubule linkage alters mitochondrial localization and the migration of cancer cells in constrained environments. (A) Top panel shows schematic of mitochondria attached to microtubules through mitochondrial rhoGTPases such as miro-1 and miro-2. Western blot analysis of knockdowns shows that a specific hairpin significantly alters miro-1 production without altering microtubule expression (as shown in tubulin blot). Additionally, knockdowns are also bioenergetically similar to WT cells in terms of ATP levels (right panel). (B) Super-resolution microscopy images show a loss of colocalization between mitochondria and microtubules in miro-1 knockdowns (highlighted by black arrowheads), whereas they are highly colocalized in WT cells. (C) Miro-1 knockdowns in breast cancer epithelial cells migrating through a 6 × 6 μm cross-section channel show a loss of mitochondrial localization. Yellow dot indicates the cell centroid, green arrowhead the direction of migration, and dashed green line the line trace for the fluorescence scan (lower panel). Anterior and posterior regions are denoted as A and P. Scale bar 10 μm. (D) Scatter plots of average velocity (left panel, red circles, rv = −0.07) and persistence (right panel, red circles, rp = 0.30), show a distinct breakdown in correlation between MLI and velocity and persistence in miro-1 knockdowns compared to WT cells (blue circles, rv = 0.78 and rp = 0.82). Least-squares fits for miro-1 knockdowns show near independence of migration velocity (left panel, dashed red line, m = −0.05, R2 = 0.01) and persistence (right panel, dashed red line, m = 0.25, R2 = 0.09).

References

    1. Ridley A.J., Schwartz M.A., Horwitz A.R. Cell migration: integrating signals from front to back. Science. 2003;302:1704–1709. - PubMed
    1. Yvon A.M., Walker J.W., Wadsworth P. Centrosome reorientation in wound-edge cells is cell type specific. Mol. Biol. Cell. 2002;13:1871–1880. - PMC - PubMed
    1. Miller P.M., Folkmann A.W., Kaverina I. Golgi-derived CLASP-dependent microtubules control Golgi organization and polarized trafficking in motile cells. Nat. Cell Biol. 2009;11:1069–1080. - PMC - PubMed
    1. Pouthas F., Girard P., Reynaud E.G. In migrating cells, the Golgi complex and the position of the centrosome depend on geometrical constraints of the substratum. J. Cell Sci. 2008;121:2406–2414. - PubMed
    1. Uetrecht A.C., Bear J.E. Golgi polarity does not correlate with speed or persistence of freely migrating fibroblasts. Eur. J. Cell Biol. 2009;88:711–717. - PMC - PubMed

Publication types

MeSH terms