. 2013 Jun 6;92(6):946-54.
doi: 10.1016/j.ajhg.2013.04.011. Epub 2013 May 9.

Mutations in BICD2, which encodes a golgin and important motor adaptor, cause congenital autosomal-dominant spinal muscular atrophy

Affiliations

Mutations in BICD2, which encodes a golgin and important motor adaptor, cause congenital autosomal-dominant spinal muscular atrophy

Kornelia Neveling et al. Am J Hum Genet. .

Abstract

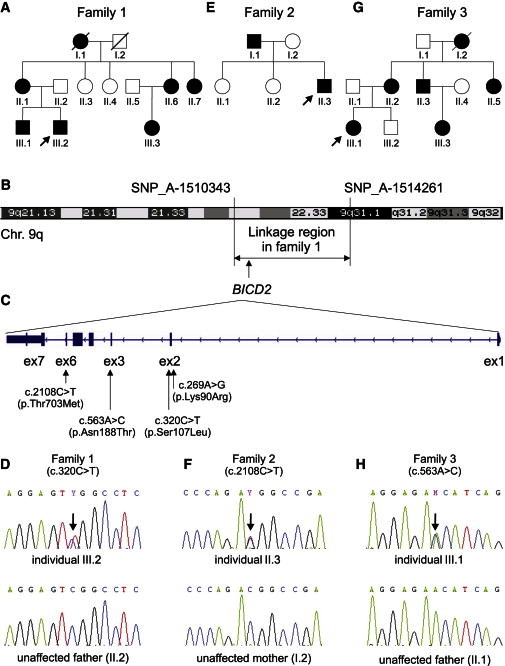
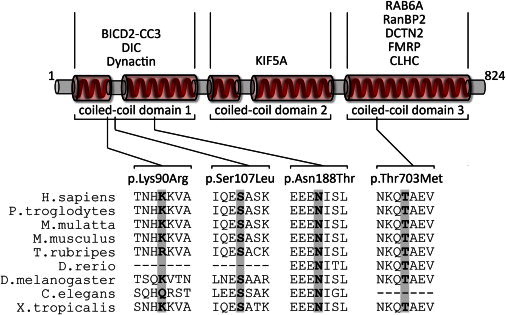
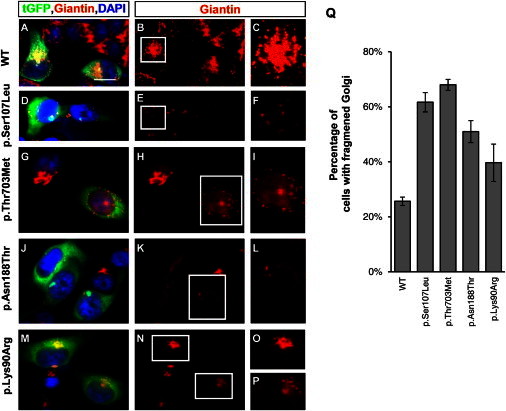
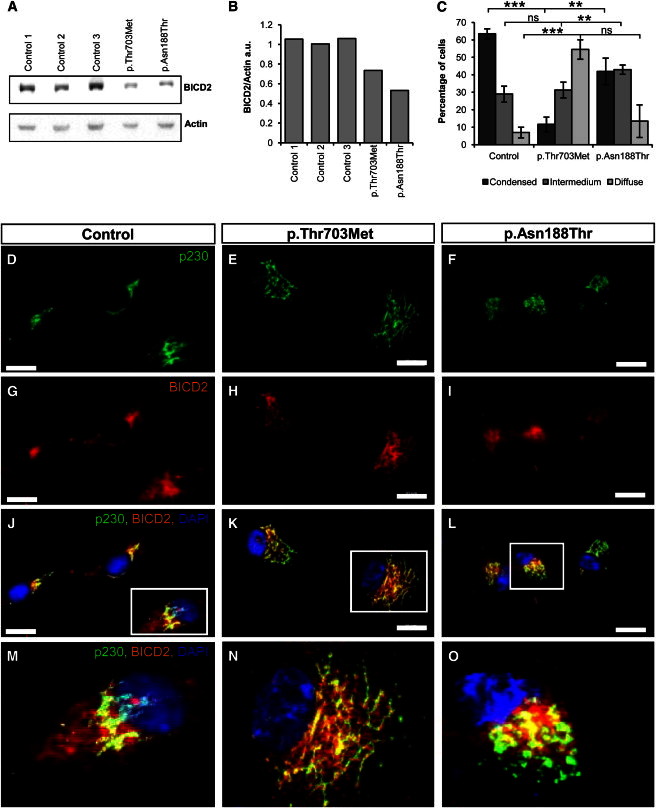
Spinal muscular atrophy (SMA) is a heterogeneous group of neuromuscular disorders caused by degeneration of lower motor neurons. Although functional loss of SMN1 is associated with autosomal-recessive childhood SMA, the genetic cause for most families affected by dominantly inherited SMA is unknown. Here, we identified pathogenic variants in bicaudal D homolog 2 (Drosophila) (BICD2) in three families afflicted with autosomal-dominant SMA. Affected individuals displayed congenital slowly progressive muscle weakness mainly of the lower limbs and congenital contractures. In a large Dutch family, linkage analysis identified a 9q22.3 locus in which exome sequencing uncovered c.320C>T (p.Ser107Leu) in BICD2. Sequencing of 23 additional families affected by dominant SMA led to the identification of pathogenic variants in one family from Canada (c.2108C>T [p.Thr703Met]) and one from the Netherlands (c.563A>C [p.Asn188Thr]). BICD2 is a golgin and motor-adaptor protein involved in Golgi dynamics and vesicular and mRNA transport. Transient transfection of HeLa cells with all three mutant BICD2 cDNAs caused massive Golgi fragmentation. This observation was even more prominent in primary fibroblasts from an individual harboring c.2108C>T (p.Thr703Met) (affecting the C-terminal coiled-coil domain) and slightly less evident in individuals with c.563A>C (p.Asn188Thr) (affecting the N-terminal coiled-coil domain). Furthermore, BICD2 levels were reduced in affected individuals and trapped within the fragmented Golgi. Previous studies have shown that Drosophila mutant BicD causes reduced larvae locomotion by impaired clathrin-mediated synaptic endocytosis in neuromuscular junctions. These data emphasize the relevance of BICD2 in synaptic-vesicle recycling and support the conclusion that BICD2 mutations cause congenital slowly progressive dominant SMA.


Figures

Figure 1
Figure 1
Identified BICD2 Mutations and Their Chromosomal Positions (A, E, and G) Pedigrees of families 1 (A), 2 (E), and 3 (G). (B) An ideogram of chromosome 9 shows the linked region and the flanking SNPs identified in family 1. (C) An ideogram of BICD2 includes exon and intron structure and the identified variants. (D, F, and H) A sequence of the region includes the mutation and the corresponding region of the unaffected parent in families 1 (D), 2 (F), and 3 (H).
Figure 2
Figure 2
Schematic Drawing of BICD2 and Its Interaction Partners The diagram depicts a simplified structure of human BICD2. Indicated are the five coiled-coil domains, which are typically combined as coiled-coil domains 1–3. Numbers indicate the respective amino acid residues. In the upper part of the diagram, known interaction partners of the respective coiled-coil domains are given. Please note that the interaction with FMRP is RNA mediated and the interaction between clathrin heavy chain (CLHC) and BICD2 has only been shown for Drosophila so far. In the lower part of the diagram, the four identified variants and a multispecies alignment of the affected amino acids are given. Protein sequences were aligned with blastp.
Figure 3
Figure 3
Effect of the Mutant BICD2 Alleles on the Golgi Apparatus (A–P) HeLa cells were transfected with tGFP-BICD2 pCMV6-AC cDNA (either wild-type [A–C] or with BICD2 missense variants [D–P]). Cells were fixed and stained for a specific Golgi marker, Giantin (red) (1:100, Abcam), and DAPI (blue) (Life Technologies). Only transfected cells glowed green under the fluorescent microscope and allowed an easy comparison with untransfected cells, which reflected the wild-type situation. For better visibility, the Giantin staining alone is shown in the middle row and the inset in the right row, which represents an enlarged Golgi of a transfected cell. Scale bars represent 20 μm. (A–C) The cells transfected with the wild-type construct show a condensed and abundant Golgi structure. (D–P) Compared to wild-type or nontransfected cells, cells transfected with the three mutant cDNA constructs and the rare variant show a fragmented Golgi with a very diffuse and faint signal. (Q) Quantification of cells with fragmented Golgi; 70–100 cells were counted for each experiment (n = 3) and are shown as the mean ± SD.
Figure 4
Figure 4
Mutations in BICD2 Cause Severe Golgi Fragmentation in Primary Fibroblasts (A) Immunoblot analyses of primary-fibroblast proteins of one control cell line and two cell lines derived from affected individuals. The cells were stained with BICD2 and β-actin as a loading control. (B) Quantification of the immunoblot shows reduced BICD2 levels in fibroblast lines isolated from affected individuals. (C) Golgi structures, defined as condensed, intermedium, or diffuse in 100 cells of each cell line, were counted in three independent experiments and are given as the mean ± SD. Each quantification was done blindly by two independent persons. Statistical significance is given between controls and each of the two cell lines as ∗∗∗p < 0.001, ∗∗p < 0.01, or p < 0.05. The following abbreviation is used: ns, not significant. (D–O) Immunostaining of control (D, G, J, and M) and disease (E, F, H, I, K, L, N, and O) fibroblasts with antibodies against trans-Golgi marker p230 in green (1:100, BD Transduction Laboratories) and BICD2 in red (1:200, Sigma), as well as merged pictures, are shown. The nucleus is stained with DAPI in blue. (M), (N), and (O) show magnified insets of single cells from (J), (K), and (L), respectively. Note that compared to control fibroblasts, affected fibroblasts show strongly fragmented Golgi and BICD2 trapped in the Golgi. Scale bars represent 20 μm.

References

    1. De Jonghe P., Auer-Grumbach M., Irobi J., Wagner K., Plecko B., Kennerson M., Zhu D., De Vriendt E., Van Gerwen V., Nicholson G. Autosomal dominant juvenile amyotrophic lateral sclerosis and distal hereditary motor neuronopathy with pyramidal tract signs: synonyms for the same disorder? Brain. 2002;125:1320–1325. - PubMed
    1. Baets J., Deconinck T., De Vriendt E., Zimoń M., Yperzeele L., Van Hoorenbeeck K., Peeters K., Spiegel R., Parman Y., Ceulemans B. Genetic spectrum of hereditary neuropathies with onset in the first year of life. Brain. 2011;134:2664–2676. - PMC - PubMed
    1. Zickler D., Kleckner N. Meiotic chromosomes: integrating structure and function. Annu. Rev. Genet. 1999;33:603–754. - PubMed
    1. Kiernan M.C., Vucic S., Cheah B.C., Turner M.R., Eisen A., Hardiman O., Burrell J.R., Zoing M.C. Amyotrophic lateral sclerosis. Lancet. 2011;377:942–955. - PubMed
    1. Lefebvre S., Bürglen L., Reboullet S., Clermont O., Burlet P., Viollet L., Benichou B., Cruaud C., Millasseau P., Zeviani M. Identification and characterization of a spinal muscular atrophy-determining gene. Cell. 1995;80:155–165. - PubMed

Publication types

MeSH terms