. 2013 May 8;78(3):510-22.
doi: 10.1016/j.neuron.2013.03.017.

Excitatory/inhibitory synaptic imbalance leads to hippocampal hyperexcitability in mouse models of tuberous sclerosis

Affiliations

Excitatory/inhibitory synaptic imbalance leads to hippocampal hyperexcitability in mouse models of tuberous sclerosis

Helen S Bateup et al. Neuron. .

Abstract

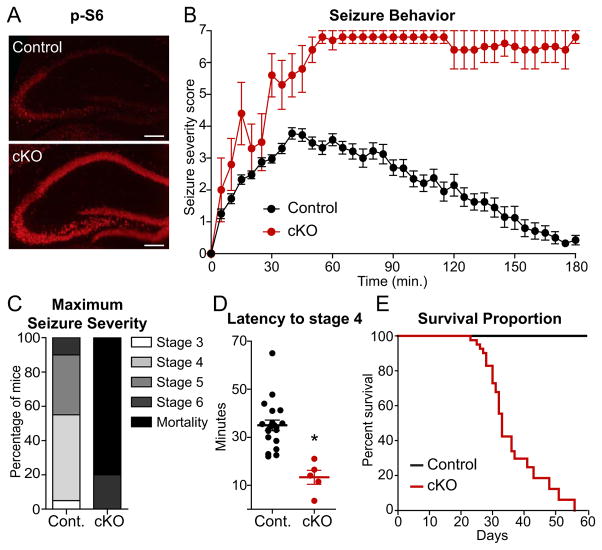
Neural circuits are regulated by activity-dependent feedback systems that tightly control network excitability and which are thought to be crucial for proper brain development. Defects in the ability to establish and maintain network homeostasis may be central to the pathogenesis of neurodevelopmental disorders. Here, we examine the function of the tuberous sclerosis complex (TSC)-mTOR signaling pathway, a common target of mutations associated with epilepsy and autism spectrum disorder, in regulating activity-dependent processes in the mouse hippocampus. We find that the TSC-mTOR pathway is a central component of a positive feedback loop that promotes network activity by repressing inhibitory synapses onto excitatory neurons. In Tsc1 KO neurons, weakened inhibition caused by deregulated mTOR alters the balance of excitatory and inhibitory synaptic transmission, leading to hippocampal hyperexcitability. These findings identify the TSC-mTOR pathway as a regulator of neural network activity and have implications for the neurological dysfunction in disorders exhibiting deregulated mTOR signaling.


Figures

Figure 1
Figure 1. Tsc1 KO hippocampal cultures exhibit an mTOR-dependent increase in spontaneous network activity
(A) Image of a MED64 dual probe with 32 electrodes per chamber. The dotted circles indicate the approximate plating area (~19 mm2) over the planar electrode arrays, 150 × 150 μm inter-electrode distance. Figure adapted from www.MED64.com. (B) Example raster plots of multi-unit activity recorded from Tsc1fl/fl hippocampal neurons plated on a dual chamber probe recorded on days 5 and 14 in vitro (DIV). Each line represents a single spike detected in a given channel during 20 seconds of a recording. Neurons plated on the top array (electrodes #1–32) were treated at 2 DIV with a GFP lentivirus (Control, black). Neurons on the bottom array (electrodes #33–64) were treated with GFP-IRES-Cre lentivirus (Tsc1 KO, red). Bottom, example spiking data from one electrode on days 5 and 14 demonstrating a bursting pattern in Tsc1 KO cultures at DIV 14; scale bar = 5 seconds. (C) Average spike rate per electrode in hertz from control (black) and Tsc1 KO (red) cultures across days in vitro (DIV). Lentivirus was added at 2 DIV (arrow). Data are represented as mean ± SEM. * indicates significant difference (p<0.05) from control on that day. Inset scatter plot shows the average spike rate per electrode on DIV 14 from pairs of control (X axis) and Tsc1 KO (Y axis) cultures (n=15). (D) Bar graphs display western blot data from Tsc1 KO neurons harvested on the indicated DIV. Black bars represent Tsc1 protein levels (normalized to β-Actin loading control) and grey bars represent phosphorylated S6 levels (p-S6, Ser240/244, normalized to total S6), expressed as a percentage of control levels harvested on the same day (n=4–8). Data are represented as mean ± SEM. * indicates significant difference (p<0.05) from control on that day. Dashed line at 100% indicates control levels. (E) Average spike rate per electrode in hertz from control (black) and Tsc1 KO (red) neurons across days in vitro (DIV). At 12 DIV, 50 nM rapamycin was added to both sets of cultures (n=5–7). Data are represented as mean ± SEM. * indicates significant difference (p<0.05) from control on that day. Inset shows the average spike rate on day 12 and day 19 from untreated cultures (dashed lines) and rapamycin treated cultures (solid lines). In black are data from control cultures, in red are data from Tsc1 KO cultures. There was a significant (p<0.05) reduction of spiking activity from day 12 to 19 in the rapamycin treated cultures of both genotypes, denoted by the asterisks.
Figure 2
Figure 2. Transcriptional profiles of control and Tsc1 KO neurons in different activity states
(A) Hierarchical clustering of data from microarray analysis of gene expression in control (C) and Tsc1 KO (KO) hippocampal neurons treated with 1 μM TTX or 50 μM picrotoxin (PTX) for the indicated times in hours. Treatment groups with similar patterns of gene expression cluster together as indicated by the dendrogram at the top of the figure. The left cluster includes control neurons in the basal condition and Tsc1 KO neurons treated for ≥ 6 hours with TTX. The right cluster includes basal state Tsc1 KO neurons and picrotoxin-treated control neurons. The heat-map displays the top 250 differential expression profiles across all treatment groups; red indicates higher expression and blue indicates lower expression relative to the median for all groups. Data were obtained from two separate microarray batches; therefore there are two untreated baseline samples for each genotype indicated by the red and black boxes. The numbers on the right denote clusters of genes displaying similar patterns of regulation determined by cluster analysis. (B) Average log-fold changes in expression for each gene cluster are shown for low, basal, and high network activity conditions across the x axis for control (black) and Tsc1 KO (red) cultures. For each gene, fold changes were calculated relative to the average level across conditions, such that no change from the mean results in log=0 (dashed lines). Clusters 1 and 3 contain genes whose levels are up- or down-regulated, respectively, by activity showing constitutive changes in Tsc1 KO networks that are partially reversed by prolonged activity blockade. Cluster 4 contains immediate early genes that are robustly and transiently increased by activity in both control and Tsc1 KO networks. Cluster 2 contains genes up-regulated by loss of Tsc1 in an activity-independent manner. See also Tables S1 and S2.
Figure 3
Figure 3. Activity-dependent homeostatic pathways are tonically engaged in Tsc1 KO cultures
(A) Quantitative RT-PCR analysis of Arc mRNA levels in control (black) and Tsc1 KO (red) hippocampal cultures following treatment with 50 μM picrotoxin or 1 μM TTX for 6 hours (n=2–6). (B,C) Western blot data of phosphorylated S6 (A) (p-S6 Ser240/244, normalized to total S6) and Arc protein levels (B) (normalized to β-Actin loading control) in control (black) and Tsc1 KO (red) cultures following treatment with 50 μM picrotoxin or 1 μM TTX for 6 hours (n=7–20). (D) Top, representative western blots from a biotin surface-protein labeling experiment. Left lanes are total cell lysates (Input), right lanes are cell surface proteins (Pull-down). C=control, KO=Tsc1 knock-out. Bottom, quantification of surface GluA1 and GluA2 levels from control (black) and Tsc1 KO (red) cultures (n=5–7). (E) Representative traces of miniature excitatory post-synaptic currents (mEPSCs) recorded from control (black) and Tsc1 KO (red) neurons in culture. (F,G) Cumulative distributions of mEPSC amplitudes (F) and inter-event intervals (IEI) (G) from control (black) and Tsc1 KO (red) neurons in culture (n=9–10). (H–J) Top, representative western blots of Arc (H), GluA1 (I), and GluA2 (J) protein in control and Tsc1 KO cultures following 7 days of treatment 50 nM with rapamycin. Bottom, bar graphs displaying summary western blot data for Arc (H), GluA1 (I), and GluA2 (J) expressed as a percentage of untreated control (n=9–10). Protein levels were normalized to β-Actin loading control. Data in bar graphs are represented as mean ± SEM, normalized to the control baseline condition. * indicates significant difference (p<0.05) from untreated control; # indicates significant difference (p<0.05) from untreated Tsc1 KO. See also Figure S1.
Figure 4
Figure 4. Loss of Tsc1 in forebrain excitatory neurons increases seizure severity resulting in premature death
(A) Immunohistochemistry staining for phosphorylated S6 (p-S6, Ser240/244) in hippocampal brain sections from a control (CamkII α Cre+;Tsc1wt/wt) and Tsc1 conditional knock-out mouse (cKO, CamkII αCre+;Tsc1fl/fl) at four weeks of age. (B) Severity of seizure behavior over time following i.p. injection of 15 mg/kg kainic acid in 4–5 week old Tsc1 cKO (n=5) and littermate control mice (n=20). Higher scores correspond to more severe seizure status; a score of seven indicates mortality. Data are represented as mean ± SEM. (C) Tsc1 cKO mice displayed increased seizure severity demonstrated by a higher percentage of mice with a maximum seizure score of 6 (tonic-clonic seizures) or 7 (mortality) within the 3 hour test period. (D) Scatterplot summary of the time in minutes to reach seizure stage 4 (forelimb clonus with intermittent rearing) in control and Tsc1 cKO mice. * indicates significant difference (p<0.001) from control. (E) Kaplan-Meier survival curve for untreated control (CamkIIαCre+;Tsc1wt/wt, n=40) and Tsc1 cKO (CamkIIαCre+;Tsc1fl/fl, n=41) littermate mice.
Figure 5
Figure 5. Tsc1 KO neurons in acute brain slices show reduced intrinsic excitability but normal synaptically-driven excitability
(A) Hippocampal section from a Tsc1fl/fl mouse injected with an adeno-associated virus expressing a nuclear targeted Cre-EGFP fusion protein (green, top panel) in the CA1 region of the hippocampus, and stained with an antibody against phosphorylated S6 (Ser240/244, red, middle panel). Overlaid image shows elevated phosphorylation of S6 in Cre-expressing neurons. Scale bar = 10 μm. (B) Example action potential traces from whole cell current clamp recordings of control (Cre-EGFP-, black) and Tsc1 KO (Cre-EGFP+, red) CA1 neurons evoked by one second depolarizing current steps in the presence of excitatory and inhibitory synaptic blockers. (C,D) Mean ± SEM number of action potentials (C) and latency to first spike (D) in control and Tsc1 KO neurons following injection of depolarizing current steps (n=9–12). * indicates significant difference (p<0.05, two-way ANOVA, Bonferroni’s post-hoc analysis). (E) Scatterplot of excitatory post-synaptic potential (EPSP) amplitude in pairs of neighboring control and Tsc1 KO neurons following single stimulation of Schaffer collaterals in the presence of inhibitory synaptic blockers (n=19 pairs). Inset shows overlaid EPSP traces from a pair of neighboring control (black) and Tsc1 KO neurons (red). (F) Left, example trains of 5 EPSPs evoked by 5 Hz Schaffer collateral stimulation. Right, mean ± SEM EPSP amplitudes for a train of 5 EPSPs showing no differences between control and Tsc1 KO neurons (n=16 pairs). (G) Left, action potentials evoked by 20 Hz Schaffer collateral stimulation for one second. Right, mean ± SEM number of action potentials evoked by 20 Hz stimulation at 3 different stimulus durations demonstrating no difference between control and Tsc1 KO neurons (n=11 pairs).
Figure 6
Figure 6. Decreased amplitude of inhibitory synaptic currents in Tsc1 KO neurons
(A) Example recordings of miniature inhibitory post-synaptic currents (mIPSCs) from control (black) and Tsc1 KO (red) CA1 neurons from an acute brain slice. (B,C) Cumulative distributions of mIPSC amplitudes (B) and inter-event intervals (IEI) (C) from control (black) and Tsc1 KO (red) neurons (n=11–12). Insets show scatterplot summaries of cell averages; horizontal lines indicate the mean and error bars denote SEM. * indicates significant difference (p<0.05) from control. (D) Left, scatterplot of evoked IPSC amplitude in pairs of neighboring control and Tsc1 KO neurons following stimulation of the CA1 pyramidal cell layer with excitatory synaptic transmission blocked (n=16 pairs). Inset shows overlaid IPSC traces from a pair of neighboring control (black) and Tsc1 KO neurons (red). Scale bar = 25 ms ×100 pA. Right, mean ± SEM evoked IPSC amplitude in control and Tsc1 KO neurons. * indicates significant difference (p<0.05) from control. (E) Left, representative overlaid traces for sets of two IPSCs evoked by stimuli delivered at different inter-stimulus intervals (ISI). Right, mean ± SEM paired pulse ratios of IPSCs from neighboring control and Tsc1 KO neurons at different ISIs (n=14 pairs) demonstrating no difference between genotypes.
Figure 7
Figure 7. Excitatory-inhibitory synaptic imbalance in Tsc1 KO neurons
(A) Top, a high titer adeno-associated virus expressing a nuclear localized Cre-EGFP fusion protein was stereotaxically injected unilaterally into the CA1 region to delete Tsc1 from >90% of neurons (“widespread knock-out”). Scale bar = 100 μm. Bottom, example recordings of miniature inhibitory post-synaptic currents (mIPSCs) from a control neuron (black) in the uninjected hemisphere and a Tsc1 KO neuron (red) in the injected hemisphere. (B,C) Cumulative distributions of mIPSC amplitudes (B) and inter-event intervals (IEI) (C) from control neurons in the uninjected hemisphere and Tsc1 KO neurons in the injected hemisphere (n=12). Insets show scatterplot summaries of cell averages; horizontal lines indicate the mean and error bars denote SEM. * indicates significant difference (p<0.05) from control. (D) Example recordings of miniature excitatory post-synaptic currents (mEPSCs) from a control neuron (black) in the uninjected hemisphere and a Tsc1 KO neuron (red) in the injected hemisphere following widespread injection of Cre. (E,F) Cumulative distributions of mEPSC amplitudes (E) and inter-event intervals (IEI) (F) from control neurons in the uninjected hemisphere and Tsc1 KO neurons in the injected hemisphere (n=11–14). Insets show scatterplot summaries of cell averages demonstrating no difference between genotypes; horizontal lines indicate the mean and error bars denote SEM. (G) Scatterplot of excitatory/inhibitory (E/I) ratio in pairs of neighboring control and Tsc1 KO neurons following sparse deletion of Tsc1 (“sparse knock-out”, as in Fig. 5A). Inset shows mean ± SEM E/I ratio in cells of both genotypes (n=13 pairs). * indicates significant difference (p<0.05) from control. (H) Sparse knock-out. Left, overlaid traces of compound excitatory (EPSP) and inhibitory (IPSP) post-synaptic potentials evoked by Schaffer collateral stimulation in a neighboring pair of control (black) and Tsc1 KO (red) neurons. Dashed line indicates the baseline. Right, mean ± SEM EPSP and IPSP amplitude in control and Tsc1 KO neurons (n=13 pairs). * indicates significant difference (p<0.05) from control. (I) Widespread knock-out. Left, example traces of compound post-synaptic potentials evoked by Schaffer collateral stimulation in a control neuron in the uninjected hemisphere (black) and a Tsc1 KO neuron in the injected hemisphere (red) following widespread unilateral injection of Cre. Dashed lines indicate the baseline. Right, mean ± SEM EPSP and IPSP amplitude in control and Tsc1 KO neurons (n=8–9). * indicates significant difference (p<0.05) from control. (J) Sparse knock-out. Mice were injected daily with 5 mg/kg rapamycin for six days prior to and on the day of electrophysiological analysis. Top, overlaid recordings of compound post-synaptic potentials evoked by Schaffer collateral stimulation in a neighboring pair of control (black) and Tsc1 KO (red) neurons. Dashed line indicates the baseline. Bottom, mean ± SEM of EPSP and IPSP amplitude after seven days of treatment with rapamycin demonstrating no difference between control and Tsc1 KO neurons (n=8 pairs). See also Figures S2–4.

References

    1. Auerbach BD, Osterweil EK, Bear MF. Mutations causing syndromic autism define an axis of synaptic pathophysiology. Nature. 2011;480:63–68. - PMC - PubMed
    1. Bateup HS, Takasaki KT, Saulnier JL, Denefrio CL, Sabatini BL. Loss of Tsc1 in vivo impairs hippocampal mGluR-LTD and increases excitatory synaptic function. J Neurosci. 2011;31:8862–8869. - PMC - PubMed
    1. Bourgeron T. A synaptic trek to autism. Curr Opin Neurobiol. 2009;19:231–234. - PubMed
    1. Chevere-Torres I, Kaphzan H, Bhattacharya A, Kang A, Maki JM, Gambello MJ, Arbiser JL, Santini E, Klann E. Metabotropic glutamate receptor-dependent long-term depression is impaired due to elevated ERK signaling in the DeltaRG mouse model of tuberous sclerosis complex. Neurobiol Dis. 2012;45:1101–1110. - PMC - PubMed
    1. Cudmore RH, Fronzaroli-Molinieres L, Giraud P, Debanne D. Spike-time precision and network synchrony are controlled by the homeostatic regulation of the D-type potassium current. J Neurosci. 2010;30:12885–12895. - PMC - PubMed

Publication types

MeSH terms

Substances